Abstract
In this work, we report for the first time on the influence of the quality of reactants and reaction conditions on the production of hydrophobically modified ethoxylated urethanes (HEURs) and selected prepolymers without the use of solvents. We show that the polyol water concentration is detrimental to the progress of the main urethane forming reaction, confirming the necessity of carefully drying the reactants below 1000 ppm to suppress the consumption of diisocyanate toward urea during HEUR synthesis. Increasing the mixing speed (≈30 to 750 rpm), reaction temperature (80–110 °C), and catalyst concentration (0.035–2.1 wt % bismuth carboxylate) can significantly increase the rate of molecular weight buildup, but their effect decreases with time as the bulk viscosity increases and mixing limitations eventually take over, leading to the Weissenberg effect and chain growth termination. Consequently, for the selected formulation, the maximum product molecular weight attained lies in the range of ≈20 000–22 000 g/mol, irrespective of the specific process conditions applied.
1. Introduction
1.1. HEURs: General Introduction, Chemistry, and Processing
Hydrophobically modified ethoxylated urethanes (HEURs) belong to the broader polyurethane (PU) family that holds a well-established position in the polymer market, covering a broad range of indoor/outdoor applications.1 HEURs, in particular, have an established share in the polymer market mainly due to their use in paints and coatings, while their application in personal care, construction, and pharmaceutical products is predicted to keep rising.2 HEURs are used in waterborne systems, paints, and coatings as rheology modifiers.3−7 Owing to the preference for sustainable manufacturing of environmentally friendly products, understanding the bulk polymerization and production optimization of these additives, which constitute a small but important part of a final paint formulation,8 is crucial. When dissolved in water and above a certain concentration, HEUR polymers form flowerlike micelles because of interactions between their hydrophobic ends. Further increase in the HEUR concentration can force the micelles to link between themselves, resulting in a unique transient network.9 This dynamic reversible phenomenon imparts pseudoplastic rheological properties to the final paint or coating product; at low shear rates, the viscosity is higher, thereby prolonging the product shelf life, while at higher shear rates, the product viscosity decreases, allowing for easier paint application: from loading of the brush to the film building on the wall.9,10
HEUR production follows the same principles as the production of PUs. A formulation consisting of two basic ingredients constitutes the core of the synthesis: a polyisocyanate reacts with a polyol, resulting in urethane repeating groups. The presence of a catalyst, a chain extender, and additives is also possible.11 The quality of the reactants is paramount for the control of the reaction pathway because isocyanates can readily react with various OH-containing compounds (such as alcohols, water, or carboxylic acids), amines, and urethanes/ureas. In the “simple” two-reactant system described above, the reaction stoichiometry can therefore become unpredictable if moisture has physically or chemically been adsorbed by the solid polyol material (during production, handling, or storage).11−13 The selection and quality of reactants play a major role in the final product, as does the chosen processing method. The importance of carefully controlling both has been highlighted in various works.7,13−15 For PU production, there are two processing possibilities. The first one is to add all of the reactants simultaneously (one-step process). The second one is to first let the polyol and polyisocyanate react and form a chain called the prepolymer, followed by the addition of a molecule capable of terminating the reaction (two-step process).12 Usually, some metals or amines are used as catalysts.9 In the current study, the one-step synthesis was used for all synthesized HEURs.
Another important aspect in the production of PUs in general and HEURs in particular is the use of a solvent phase. The most common practice reported in the literature is to apply solution polymerization, either in one or in two steps.16 The use of a solvent can assist in viscosity reduction and result in better heat transfer, easier mixing, and improved product homogeneity. In general, the chosen solvent should be inert to the isocyanate and be able to dissolve the polyol and the polyurethane product.17 Examples of appropriate solvents include benzene, toluene, xylene, and aromatic hydrocarbon-rich compounds17 or other commonly used ones such as dimethylformamide (DMF), tetrahydrofuran (THF), dimethyl sulfoxide (DMSO), and 1,2-dichloroethane (DCE).18 On the downside, an extra purification step is required to separate the obtained polymer from the solvent. Many examples of works with a variety of solvents are available in the literature. More specifically, toluene, diethyl ether, and hexane were used for polymer reprecipitation.14 Dried toluene was used in the work of Fonnum et al.6 Many articles by Barmar et al.7,13,15,19−21 discuss various parameters related to the HEUR rheological behavior, emphasizing the role of the hydrophobic and hydrophilic parts of the molecule among others. In all of these works, HEURs were produced in a similar way using dry toluene, THF, petroleum ether, and acetone. The detailed synthesis is described in Barmar et al.19
Despite the process-related advantages when carrying out HEUR syntheses in solvents, the pressing quest for sustainability, profitability, and low toxicity in chemical manufacturing requires the drastic reduction or even elimination of solvents to avoid the need for their separation from the polymer product downstream, which increases the total production cost and the CO2 equivalent emissions corresponding to the extra energy demand for solvent separation and purification. However, solventless HEUR production has never been investigated from the process point of view to shed light on the role of operating conditions that determine product quality.
In the current study, all HEUR polymers were synthesized in bulk with poly(ethylene glycol) (PEG, Mw = 8000 g/mol), which was coupled with 4,4-dicyclohexylmethane diisocyanate (H12MDI). 1-Octanol was used as a short hydrophobic molecule that terminated the developed polymeric chains. The manuscript provides insights into the effect of the moisture concentration of the polyol, the catalyst concentration, the reaction temperature, and the mixing profile on the HEUR product quality. The polymer products were characterized in terms of molecular weight by GPC and APC, chemical structure by FTIR, and viscosity by rotational and oscillatory testing. The crystallinity, thermal stability, and heat capacity of the polymer products were also investigated through XRD, TGA, and DSC characterization. Selected nonhydrophobically terminated polymers or prepolymers were also produced to assess the impact of the chain stopper (1-octanol) on the system.
2. Materials and Methods
2.1. Materials
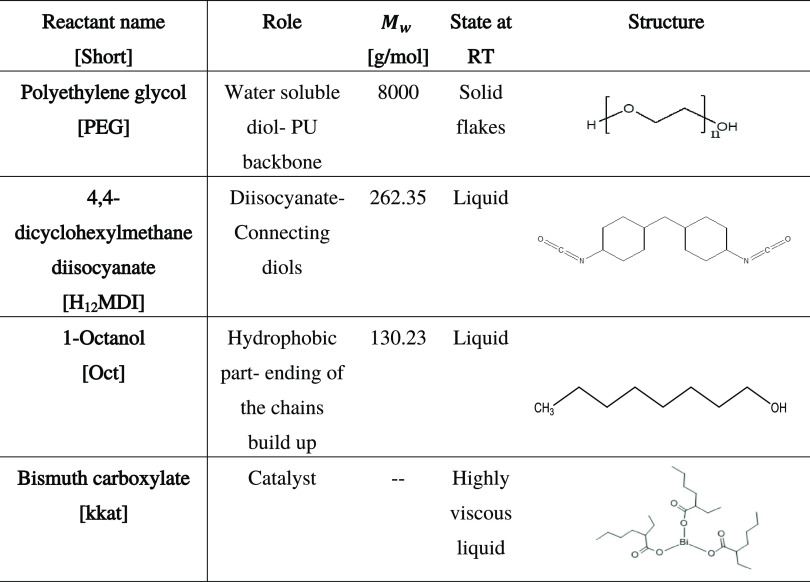
Poly(ethylene glycol) of molecular weight 8000 g/mol with a purity of >99.5% was kindly provided by Clariant. H12MDI (4,4-Methylenebis(cyclohexyl isocyanate), mixture of isomers, 90% purity) from Acros Organics and 1-octanol (99% purity) from Alfa Aesar were used as received. Bismuth carboxylate (KKAT XCB221), kindly provided by the King Industries, was selected as the catalyst. The structures of all main reactants and some basic properties are presented in Table 1. Chloroform (>99.8% purity) stabilized with amylene was purchased from Fisher Chemicals and was dried using 4 A molecular sieves. Chloroform-d (99.8%) for NMR was purchased from Sigma-Aldrich. Extra dry methanol for synthesis was purchased from Fischer Scientific, dibutylamine (>99.5%) was obtained from Sigma-Aldrich, and THF (HPLC grade, >99.8%) was from Chem-Lab.
Table 1. Summary of the Role, Physical State at Room Temperature (RT), and Molecular Structure of the Different Reactants.
2.2. Synthesis of Polymers
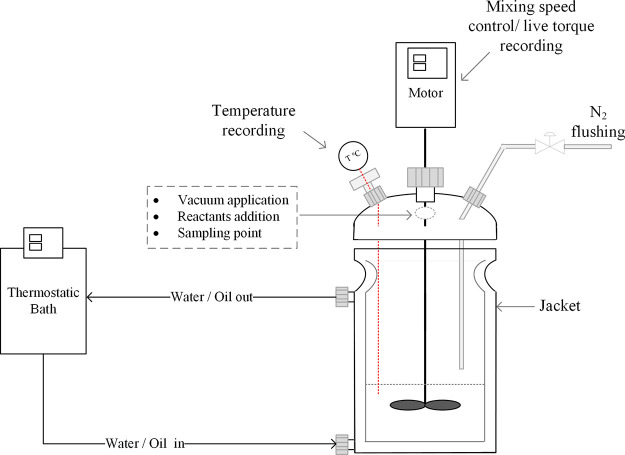
The formulation used for all of the substudies in the current work combines PEG, H12MDI, and 1-octanol, called “HMDI” and “Oct” for simplicity hereafter, in the following molar ratios: 1:1.5:1. The reactants were weighed and added to the reactor. A double-wall glass vessel with four openings was used as the reactor. The vessel temperature was controlled by a heating jacket. A simplified scheme of the reactor setup is presented in Figure 1. The synthesis procedure applied was common for all of the cases: initially, poly(ethylene glycol) flakes were melted in the preheated reactor. The melted PEG was then subjected to a vacuum treatment step under constant mechanical mixing. Vacuum was applied until the desired moisture concentration of the PEG was reached; this was confirmed by the coulometric Karl–Fischer titration method. Polyol samples were taken from various spots of the bulk and were directly dissolved in dry chloroform. The obtained solution was titrated immediately. The moisture measurements were repeated at least three times. Immediately after the vacuum stopped, nitrogen was applied in the reactor as close as possible to the liquid surface to create an inert blanket that would prevent air moisture from being absorbed by the polyol. Next, the catalyst diluted in dried chloroform (2% w/w) was added to the vessel at the selected concentration. The diol and the catalyst were mixed for a few minutes before octanol was added. The reactants were left to mix properly before the isocyanate addition, which was marked as “time zero” of each experiment. A PTFE three-blade impeller connected to a stirring motor able to control the mixing speed and record torque data online was used (Hei-Torque overhead stirrer from Heidolph).
Figure 1.
Experimental reactor setup used for the study, including a double-wall glass reactor, special openings for the various processing steps, and the motor/agitator able to record online torque data.
2.3. Sampling of the Produced Polymers
In the current work, two sampling methods were applied: the “solid method”, in which the molten sample was collected from the bulk and analyzed after solidification; and the “liquid” or “in situ” method, in which the molten sample was directly dissolved in vials with preweighed dry chloroform. It was observed that when applying the “solid method” the obtained number-average molecular weight (Mn) values were 50–77% higher compared to the case of the “in situ” method (Figures S1 and S2). Another observation was related to the FTIR spectra that were different when solid and in situ-obtained samples were analyzed. Specifically, it was noticed that the characteristic N=C=O peak of the diisocyanate was not present in any of the analyzed solid samples (reference is made to the FTIR results reported in Section 2.6). The latter is most likely due to consumption of the N=C=O groups either during ongoing polymerization in the collected solid sample or by the moisture of the air (postpolymerization effect). Further investigation was not part of the current study.
To the best of our knowledge, only few studies refer to the exact method applied for the sample collection. In the work of Stern,22 the author mentioned: “the still hot solid polymer was cut into quarters and removed from the reactor” and in the work of Arnould et al.,23 the following procedure was performed: “at the end of the reaction, polyurethane prepolymers were kept under argon”. In the same work, the authors applied an extra pretreatment step comprising quenching of the prepolymers with anhydrous methanol to avoid further reactions of the remaining N=C=O groups in the reactive mixture, which would potentially alter the obtained molar masses.23 The use of dry methanol did not show any advantages compared to the “in situ” method implemented in the current study. Nevertheless, the results of these tests can be found in Figure S3. It is emphasized that proper sampling is crucial to avoid misleading values of product properties (molecular weight, composition, viscosity, etc.). The GPC, APC, and FTIR results presented in our study are based on the liquid/in situ method. More details and results on comparison of the two sampling methods can be found in the Supporting Information (Section A).
2.4. Homogeneity of the Bulk Polymers
The homogeneity of the bulk in terms of molecular weight was investigated by collecting samples from various spots of the reactor during two selected syntheses. Specifically, in the course of two different polymerizations at 80 and 110 °C, polymer samples were collected in situ from five different reactor spots over 5 and 15 min, respectively. The formulation details can be found in Table S4. For both syntheses, it was observed that the molecular weight of the bulk can vary up to 9% when comparing the maximum and minimum values. The results from the two cases can be found in Figure S4 and Table S5 (Supporting Information, Section B).
2.5. Description of Parametric Studies
The parametric variations applied in this work are summarized in Table 2. In all parametric studies, polymer products were sampled during the course of the reaction for further characterization.
Table 2. Summary of Parameters Investigated in the Current Work.
| parameter modified | polyol moisture concentration [ppm] | temperature [°C] | mixing profile [rpm] | catalyst [%] |
|---|---|---|---|---|
| polyol moisture | ≈500/800/1000/2000/3000/4500/6000/13 000 | 80 | 100 | 0.035 |
| catalyst concentration | ≈800 | 80 | 100 | 0.035/0.14/0.35/2.1 |
| reaction temperaturea | ≈800 | 80/95/110 | 100 | 0.035 |
| mixing regime | ≈800 | 80 | 30/100/300/750 | 0.035 |
Both HEURs and prepolymers were investigated in this study.
2.5.1. Polyol Moisture Effect Investigation
In step growth polymerizations, the production of high-molecular-weight polymers is aimed for. To this end, reactants of high quality in combination with strict reaction stoichiometry control are necessary. Consistency in reactant quality constitutes a challenge because the purity grade of commercially available monomers may significantly vary among different producers or even from batch to batch. In the case of HEUR synthesis, particular polyols may contain moisture due to their hydrophilic nature. As a consequence, hydrolysis of the diisocyanate (the second main reactant in the system) can occur and, as a result, urea formation will be favored instead of the desired urethane forming reaction. The two molecules are presented in Figure 2. More details on the reaction schemes in the system can be found in the Supporting Information (Section C, Figures S5–S10).
Figure 2.
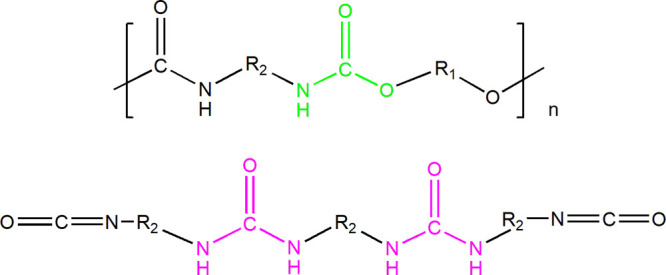
Polyurethane (top) and urea containing molecules (bottom) resulting from the main PEG-H12MDI and the PEG-water reactions, respectively.
Even though multiple studies have underlined the importance of dehydrating the polyol before reacting it with isocyanate, no quantitative data are available regarding the initial moisture of polyol and its effect on the polymer weight average molecular weight (Mw) and the number-average molecular weight (Mn). Hence, the main goal of the study on the moisture effect is to quantitatively assess how the initial moisture of PEG affects the HEUR chain growth in terms of Mn and Mw. All processing parameters, that is, the stoichiometric ratio of the reactants (1 PEG/1.5 HMDI/1 Oct), the mixing speed (100 rpm), the reaction temperature (80 °C), and the catalyst concentration (0.035%) remained the same for all experiments. The polymers were collected in situ at 45 min of reaction time. Due to the broad range of moisture concentrations (between 500 and 13000 ppm) in the initial PEG materials, an excess of HMDI (1.5 HMDI/1 PEG) instead of the theoretical optimum molar ratio (1 HMDI/1 PEG or 1 NCO/1 OH based on Szycher12) was chosen for the study on the moisture effect reported herein. To reach the moisture level required to perform these experiments, either vacuum pretreatment was applied for a few hours under mixing at 100 °C when reduction in the moisture level was desired or distilled water was added to the mixture of reagents, which was then mixed vigorously, to reach a higher moisture level.
2.5.2. Catalyst Concentration Effect Investigation
In this parametric study, the initial PEG moisture concentration (≈800 ppm), the reactant’s stoichiometric ratio (1 PEG/1.5 HMDI/1 Oct), the reaction temperature (80 °C), and the mixing speed (100 rpm) were kept constant, but the catalyst concentration was modified from 0.035 to 2.1% to investigate whether higher catalyst concentrations can overcome mass transfer limitations inherent in viscous mixtures. The aim of this parametric study was to verify the maximum attainable HEUR molecular weight level for reaction times up to 120 min, which is the nominal industrial process time for this synthesis.
2.5.3. Reaction Temperature Effect Investigation
In this set of experiments, all processing parameters except for temperature, namely, the stoichiometric ratio of reactants (1 PEG/1.5 HMDI/1 Oct for the HEUR synthesis and 1 PEG/1.5 HMDI for the prepolymer), the mixing speed (100 rpm), the initial PEG moisture concentration (≈800 ppm), and the catalyst concentration (0.035%), remained the same. The reaction temperature was varied between 80 and 110 °C. The lower limit (80 °C) is the minimum temperature required for the PEG8000 flakes to melt. The upper limit (110 °C) was selected taking into consideration the fact that in the temperature range ≈100 to 110 °C, PEG degradation and product yellowing were observed after a few hours of processing.
2.5.4. Mixing Regime Effect Investigation
In this study, the rotation speed of the overhead stirrer was varied between 30 and 750 rpm while keeping constant the HEUR polymerization formulation ratio (1 PEG/1.5 HMDI/1 Oct), the initial PEG moisture concentration (≈800 ppm), the reaction temperature (80 °C), and the catalyst concentration (0.035%).
2.6. Analytical Methods
2.6.1. Gel Permeation Chromatography (GPC)
The weight/number-average molecular weight (Mw/Mn) was determined by GPC from Shimadzu, using four Styragel columns from Waters. Chloroform was the mobile phase (1 mL/min) at 30 °C operating temperature. Poly(ethylene glycols/oxides) (PEG/PEO) were used as calibration standards.
2.6.2. Advanced Permeation Chromatography (APC)
The multimodal molecular weight distribution of the samples was determined by APC from Waters, using three Acquity APC XT columns from Waters. THF was the mobile phase (1 mL/min) at 35 °C operating temperature. Poly(methylmethacrylate) (PMMA) standards were used for the calibration.
2.6.3. Fourier Transform Infrared Spectroscopy (FTIR)
The qualitative analysis of the obtained polymers was done by FTIR, which was performed using attenuated total reflectance-Fourier transform infrared spectroscopy (ATR-FTIR, Perkin Elmer, spectrum 100). At least four scans for each sample were conducted in the span range of 4000–650 cm–1. The products were collected at 45 min and were directly diluted in chloroform-d at a concentration of 0.05 g/mL. The liquid samples were placed in the analysis cell, and the spectra were recorded after the total solvent spontaneous evaporation.
2.6.4. Thermogravimetric Degradation Analysis (TGA)
TGA was performed using a TGA-Q500 (TA Instruments). Samples of ∼10 mg were weighed in high-temperature platinum pans and heated from 20 to 550 °C at a heating rate of 10 °C/min and a nitrogen gas flow of 60 mL/min for the sample and 40 mL/min for the balance.
2.6.5. Differential Scanning Calorimetry (DSC)
The heat capacity curves were obtained using a DSC-Q2000 (TA Instruments). The DSC cell was purged with nitrogen gas at a flowrate of 50 mL/min. Samples of ∼8 to 10 mg were placed in sealed aluminum pans. Samples were measured while being heated and subsequently cooled at 10 °C/min between 10 and 200 °C with 5 min isothermal time at the extremes. Both heating and cooling cycles were repeated twice per measurement. An empty aluminum pan was used as a reference.
2.6.6. Powder X-Ray Diffraction (PXRD)
Samples were analyzed in a Bruker D2 PXRD device. Each sample was scanned with 2θ ranging from 4 to 45° with a resolution of 0.02°/s.
2.6.7. Rheological Measurements
The rheological properties of HEUR aqueous solutions were measured on a Haake Mars 60 rheometer, using a cone and plate geometry of 25 mm diameter, 1° angle cone, made of titanium and sand-blasted (C25 1°/Ti/SB). The distance of the gap was 0.056 mm. Water–HEUR solutions were prepared by directly dissolving a known amount of the HEUR in distilled water, resulting in 20% w/w solutions. The solution was stirred for a few hours to make it homogeneous, and then, the samples were left to rest overnight. The water amount was selected based on industrial tests performed during the commercialization stage of a thickener product. A range of 17–20% dilutions in water is normally applied and considered representative of the downstream processing behavior of the final product.
Zero shear viscosity and shear stress profiles were obtained for shear rate testing from 0.01 to 10 000 s–1. To ensure that all samples were subjected to the same shear history, an equilibration time of 60 s was applied to each shear rate. Dynamic viscoelastic properties of the solutions were measured in the oscillatory shear mode, in the frequency range of 0.05–100 Hz, with a constant deformation amplitude γ0 = 0.01 s–1. All rheological measurements were performed at 25 °C.
3. Results and Discussion
3.1. Effect of Polyol Moisture Concentration
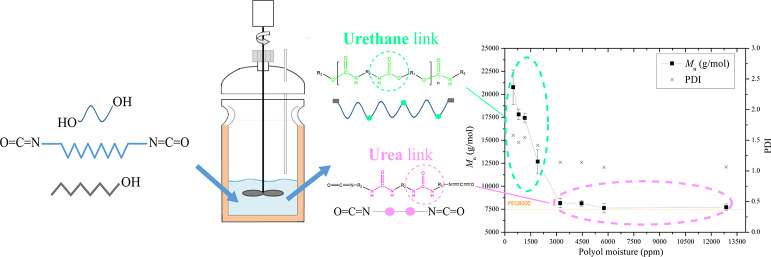
The molecular weight development is directly related to the degree of polymerization. The obtained HEUR Mn values over a range of initial PEG moisture concentrations are shown in Figure 3, where it can be seen that Mn is severely restrained when the moisture concentration of PEG is above 3000 ppm. More specifically, at this moisture level, the water is in excess compared to the PEG (≈20% in molar terms), which could provoke the side reaction of diisocyanate toward urea. On the contrary, when a lower moisture concentration (<3000 ppm) is present, the Mn starts increasing, and for the minimum moisture concentration of 500 ppm, the maximum Mn ≈ 21 000 g/mol is attained. In this case, the desired urethane reaction is favored. The polydispersity index (PDI) or the Mw/Mn fraction of the products is also presented in Figure 3. The PDI values range from 1 (corresponding to pure polyol) to 1.5 for HEURs produced from polyols with a low moisture concentration. For all of the polymers produced in the current paper and considering that the initial moisture concentration of the polyol was controlled (≈800 ppm), PDI values remained approximately equal to 1.5.
Figure 3.
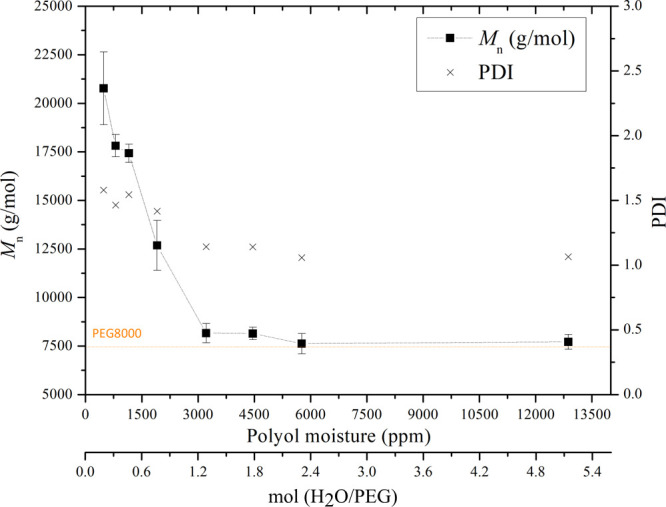
Mn and PDI values of the produced HEURs obtained for various initial PEG moisture concentrations. The second x-axis shows the corresponding molar ratio (water/PEG). The measured Mn of the PEG8000 analyzed—as received—is also shown on the graph. The dashed lines have been added to guide the eye. Experiments were performed in at least three repetitions.
The APC analysis in Figure 4 shows that there is multimodal molecular weight distribution (MWD) in the HEUR samples produced from both low- and high-moisture-concentration PEGs. Both HEURs show multiple peaks, besides the first peak, which is attributed to PEG8000, corresponding to dimers, trimers, and polymers consisting of a higher number of connected repeating units, indicative of multiple distinct molecular weight populations. Direct comparison of the obtained curves showed that the HEUR produced with PEG of a low moisture concentration (500 ppm) has a broader MWD and a higher-molecular-weight shoulder on the left of the curve. The latter is also confirmed by the PDI increase when starting from a PEG with a lower moisture concentration.
Figure 4.
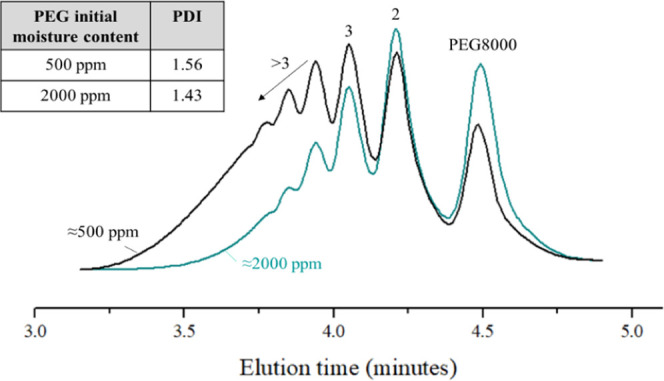
APC results for two samples from the moisture study.
Further investigation of the effect of PEG moisture concentration on the chemical composition of the produced HEUR was done with FTIR analysis, which confirms the presence of urethane or urea-related groups in the HEUR samples. Figure 5 shows the FTIR spectra of two samples produced from PEG with low moisture concentrations (500 and 1150 ppm) and three samples produced from PEG with high moisture concentrations (2000, 3200, and 5800 ppm). Band differences are spotted in two absorption regions: from ≈1630 to 1720 cm–1 corresponding to the stretching vibrations of the carbonyl C=O groups and the −NH bending vibration region from ≈1530 to 1560 cm–1. For all analyzed samples, the characteristic −CH stretching band appears at ≈2850 to 2900 cm–1 and the characteristic absorption peak of the isocyanate group (N=C=O) appears at 2270 cm–1. The peak at 730 cm–1 is attributed to the solvent used for the in situ sampling.
Figure 5.
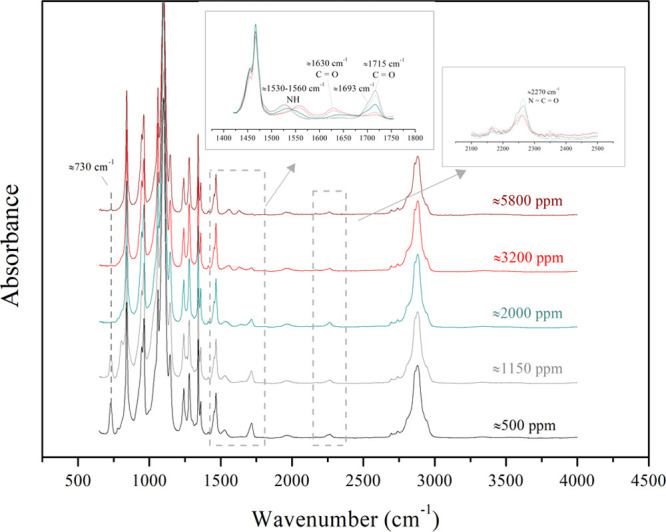
FTIR spectra of selected HEUR samples from the moisture study; the initial moisture concentration (in ppm) of the polyol is indicated on the graphs.
For the HEURs produced from PEG8000 containing the highest moisture concentrations (≈5800 and 3200 ppm), a discrete peak appears at 1630 cm–1, attributed to the ordered hydrogen-bonded urea carbonyl (C=O).24−28 The peak at 1560 cm–1 can be associated with the bending vibrations of the NH groups in the urea bonds.26 For these samples, a peak with a very low intensity appears at 1715 cm–1, which can be assigned to the disordered hydrogen-bonded carbonyl (C=O) groups in the urethane molecule.24−27 On the contrary, the intensity of this peak at 1715 cm–1 increases considerably for the lower PEG8000 moisture concentration HEURs (≈1150 and 500 ppm). The C=O of polyurethane is connected to −NH and −O, while the C=O of urea is connected to two −NH. This makes the three-dimensional urea H-bonding stronger than the urethane one and, as a result, the frequency of the urea carbonyl is lower than the urethane one.24,25
For the lower PEG8000 moisture concentration samples, the small shoulder, visible at 1693 cm–1 as well, can be attributed to the ordered hydrogen-bonded urethane C=O group.24−27 The shape of the peak representing the carbonyl of the urethane molecule is affected by the presence of free or hydrogen-bonded carbonyls.27 The peak at 1530 cm–1 represents the bending vibrations of the NH in the urethane groups.22,25,29,30 The sample synthesized with PEG8000 of ≈2000 ppm moisture concentration shows an intermediate behavior, namely, both urea and urethane peaks are present, but the peaks’ intensity is lower. The spectra in Figure 5 clearly indicate that the moisture concentration of the polyol determines the intensity of the urea and urethane peaks, as well as the presence of characteristic bonds (−NH–C=O–O– for urethane and −NH–C=O–NH– for urea).
An interesting observation can be made by comparing the area below the two kinds of carbonyl peaks at the two extreme moisture concentrations, that is, 500 ppm and 5800 ppm: the urethane peak at 1715 cm–1 is higher—almost double—than the urea one at 1630 cm–1. Although the performed FTIR analysis is not quantitative, this difference is possibly due to the fact that during the urea forming reaction between water and diisocyanate, one molecule of CO2 is released per urea bond formed, which is not the case in the urethane reaction. Additionally, the products of the reaction between H12MDI and 1-octanol and H12MDI and dibutylamine served as standards and confirmed the urea and urethane carbonyl peaks’ attribution experimentally. These spectra compared to the targeted HEURs can be found in Figures S12 and S13. The FTIR spectra interpretation confirms that above a water concentration of 3000 ppm in PEG, the urea formation severely inhibits the urethane forming reaction. The opposite occurs when the moisture concentration is below 1000 ppm and the urea peak is not detected in the spectra. Based on the obtained results, the necessity of careful storing and handling of the polyol is confirmed and a pretreatment step is necessary for controlling the reaction pathway. In practice, the initial polyol moisture concentration should be limited below ≈1000 ppm and the polyol should be stored under an inert atmosphere, such as N2 blanketing, which is typically applied in the industry, to avoid moisture uptake.
Direct comparison of the steady shear rotational testing results between 20% w/w aqueous solutions of HEURs produced with low or high PEG moisture concentrations shows differences in the Newtonian region of viscosities, as shown in Figure 6. The viscosity of the Newtonian plateau of HEURs synthesized with a PEG moisture concentration of ≈2000 ppm is higher than the ≈500 ppm one, while for the former, the shear thinning behavior starts at lower shear rates. This is related to the presence of urea in this HEUR molecule,31 as confirmed by the FTIR analysis (Figure 5). As mentioned earlier, the urea hydrogen bonds are stronger compared to the ones of urethane.24,25 This effect has also been verified through TGA analysis, which is presented in Figure S14, and can explain the viscosity trends. Specifically, the HEURs containing urea, produced with PEG containing 2000 ppm of moisture, required a higher temperature for the mass reduction of 3%. It is remarked that the viscosity of the HEUR product at 20% concentration in water is an important property for HEUR industrial users as it determines its transportability through pumping lines. Viscosities on the order of ≈26 Pa s, corresponding to an initial moisture concentration of 2000 ppm in the PEG, as shown in Figure 6, are quite high in this regard and are better avoided. Therefore, limiting the initial moisture concentration below 1000 ppm, as mentioned above, is suggested to facilitate downstream HEUR transportation and postprocessing.
Figure 6.
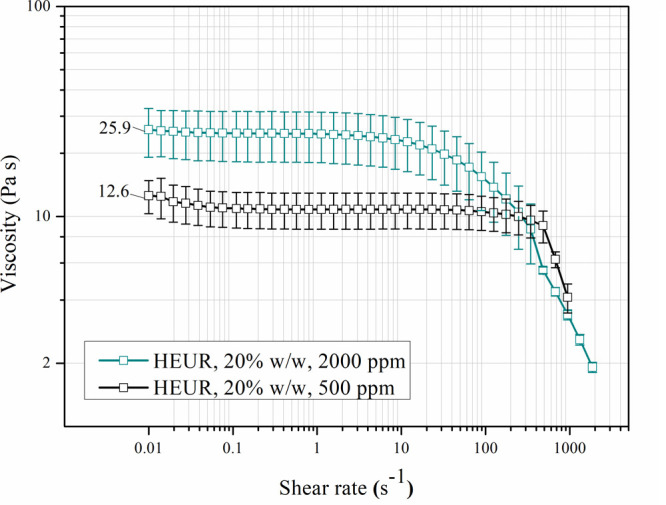
Steady shear viscosity testing of two HEUR products from the moisture study (500 and 2000 ppm initial PEG moisture concentrations), diluted in water (20%) and measured at 25 °C. The zero shear viscosity values are indicated on the graphs.
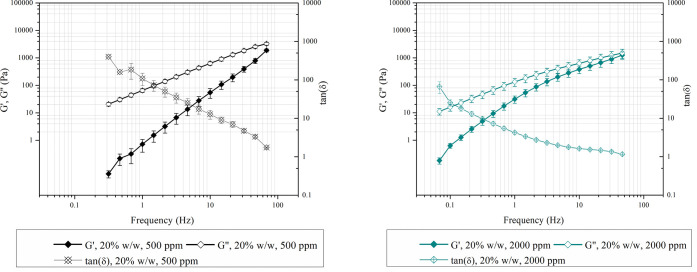
Oscillatory measurements were performed to characterize the viscoelastic behavior of the aforementioned HEUR samples. Both the storage modulus (G′) and loss modulus (G″) increase with increasing frequency in the tested region (Figure 7). The G″ is related to the viscous behavior of a polymer, G′ expresses the elastic response of a polymer, and tan(δ) is the ratio of the two (viscous or energy dissipation over elastic or storage behavior).32,33 For both evaluated samples, G″ has higher values than G′ over the entire tested frequency region, and no crossover frequency is detected. The former indicates that the viscous portion of the viscoelastic performance of the HEUR aqueous solutions is predominant.34 This liquid-like behavior is expected for low-concentration HEUR aqueous solutions. Additionally, when comparing the tan(δ) values of the samples (Figure 7), higher values were obtained for the low moisture samples, which implies a more liquid-like behavior.33 Therefore, less pumping energy will be required for the postprocessing of this type of material. On the contrary, the high moisture samples showed lower tan(δ) values, implying that the solution shows a more elastic response. In this case, it is more likely that the sample will store an applied deformation load instead of dissipating it.35
Figure 7.
Storage modulus (G′, solid symbols) and loss modulus (G″, open symbols) versus frequency for two HEUR products starting from PEG with initial moisture concentrations 500 ppm (left) and 2000 ppm (right), diluted in water (20%). Measurements were made at 25 °C.
The crystallinity of the HEURs produced as a function of the process parameters has been investigated though XRD analysis, and it is concluded that for the operating windows in this study, the product crystallinity is not affected when compared to the PEG8000 starting material (Figure S15). In addition, the heat capacity of the HEURs was investigated as a function of the PEG moisture concentrations. The results show that the heat capacity remains practically unaffected when comparing the HEURs starting from polyols with different initial moisture concentrations. Indicative DSC graphs are presented in Figure S16. Although in situ analysis is preferred for HEURs, solid samples were used for characterization through TGA, XRD, and DSC due to the technical requirements of the methods. The obtained results are considered representative of the properties of the synthesized HEURs.
3.2. Effect of Catalyst Concentration
To identify the attainable molecular weight range that could be obtained for the specific stoichiometric ratios applied (1 PEG/1.5 HMDI/1 Oct), the modification of the catalyst concentration used in all other experiments (0.035%) was multiplied by factors of 4, 10, and 60, and the obtained Mn values are presented in Table 3.
Table 3. Effect of Catalyst Concentration on the Mn of the HEURs Produceda.
| reaction
time [min] |
||||
|---|---|---|---|---|
| 3 | 15 | 45 | 120 | |
| catalyst [%] | Mn [g/mol] | |||
| 0.035 | 9800 | 15 900 | 17 800 | 21 500 |
| 0.14 | 15 200 | 18 100 | – | – |
| 0.35 | 18 800 | 20 900 | – | – |
| 2.1 | 19 900 | 20 500 | – | – |
“–” corresponds to not measured data.
The Mn values obtained for the highest catalyst concentrations (0.35 and 2.1 wt %) resulted in approximately constant Mn values (≈20 000 to 21 000 g/mol) after 15 min of reaction. A similar Mn value (≈21 500 g/mol) was obtained after 120 min of reaction for the working catalyst concentration (0.035 wt %). The results from this modification show that a limitation exists regarding the maximum Mn range (≈20 000 to 22 000 g/mol) for HEURs produced in the studied system. This range will be referred to as the “Mn plateau” in the next paragraphs. Similar final HEUR molecular weights have been reported in relevant chemistries using catalyst concentrations in the range of 0.2–0.4 wt %, which is typical in HEUR synthesis (0.2 wt % dibutyltin dilaurate (DBTDL) or tertiary amine catalyst is mentioned in the review by Quienne et al.9). Table 4 lists the operating conditions applied and the final number-average molecular weights in relevant published works.
Table 4. Summary of Processing Conditions and Final Mn for the HEUR Synthesis in the Literature.
| [molar ratio] reactants/catalyst | processinga [min] | temperature [°C] | Mn [g/mol] | PDI | reference |
|---|---|---|---|---|---|
| [1] PEG8000/[1.5] IPDI/[1] 1-tetradecanol, DBTDL (0.2%) | 300 | 90 | 20 500 | 1.2 | Lu et al.3 |
| [1] PEG6000/[1.5] HMDI/[1.2] cetyl alcohol, DBTDL (0.3%) | >120 | 45 | 16 500 | 1.4 | Barmar et al.19 |
| [3.2] PEG6000/[4.2] HDI/[1.1] alkyl amine, DBTDL (0.4%) | 90 | 45 | 18 000 | 1.6 | May et al.36 |
| [3.2] PEG6000/[4.2] HMDI/[1.1] alkyl amine, DBTDL (0.4%) | 90–270 | 45 | 17 600 | 1.7 | |
| [1] PEG8000/[1.5] HMDI/[1] Oct, kkat (0.035%) | 120 | 80 | 21 500 | 1.5 | this work |
| [1] PEG8000/[1.5] HMDI/[1] Oct, kkat (0.35%) | 15 | 80 | 20 900 | 1.5 |
Total processing time (prepolymer and chain stopper addition steps).
Overall, an increase in catalyst concentration increases the rate of HEUR synthesis and can lead to a targeted molecular weight product, within the attainable molecular weight range, at a lower process time and therefore lower energy consumption. This is important from both the energy efficiency and productivity points of view. Besides, HEUR synthesis time reduction is indispensable in light of a desired transition from batch-to-continuous (i.e., extruder) processing to increase the throughput and product quality.
3.3. Effect of Reaction Temperature
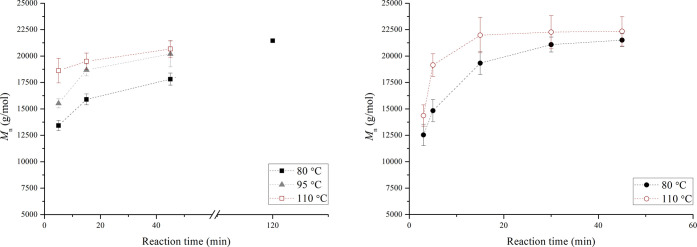
For the reaction temperature study, both HEURs and prepolymers were produced to compare directly the effect of the chain stopper in the produced polymer. The obtained Mn results are presented in Figure 8.
Figure 8.
Mn of the produced HEURs obtained for reaction temperatures of 80, 95, and 110 °C (left). Mn for the prepolymers at 80 and 110 °C (right). The dashed lines have been added to guide the eye. Experiments were performed in at least three repetitions with the exception of the point of 120 min for 80 °C of the HEURs (left diagram).
In Figure 8 (left), the effect of the reaction temperature at short reaction times can be observed. At 110 °C, the Mn at 5 min of reaction (18 618 g/mol) is 90% of the value at 45 min (20 667 g/mol). At 80 °C, the Mn at 5 min (13425 g/mol) is ∼60% of the value at 120 min (21 452 g/mol), which is a representative process time required to reach the Mn plateau level (≈21 000 g/mol) when working at 80 °C in industrial batch reactors. This is a clear indication that a higher temperature results in achieving the Mn plateau value faster. Taking into consideration the fact that the plateau Mn value for all applied temperatures is approximately the same (≈21 000 to 22 000 g/mol), it can be stated that no side reactions or dissociations are favored within the applied temperature range. This claim is also supported by literature studies related to the effect of reaction temperature on bulk polyurethane synthesis.37,38 In the moisture study presented earlier, it was shown that for the lowest reaction temperature applied (80 °C) the dominant factor controlling the urea forming side reaction is the PEG moisture concentration. Given that below 1000 ppm, no urea peaks were traced (Figure 5) and that for the study of the reaction temperature effect, the polyol moisture concentration was restricted well below this threshold, the urea forming side reaction can be safely excluded for all tested temperatures in the current work.
The results from the prepolymer analysis indicate a similar trend to that observed for the HEURs. In Figure 8 (right), it can clearly be seen that an increase in the reaction temperature shortens the required time for achieving a certain Mn value. Similar results have also been reported in the literature, but for higher temperatures applied.38 The FTIR spectra in Figure 9 do not suggest the occurrence of side reactions for the prepolymers. The only difference between HEURs and prepolymers is the intensity of the N=C=O peak at 2270 cm–1. The peak is higher for the prepolymer, possibly due to the absence of octanol that would attach to either free isocyanate or N=C=O ending HEUR chains.
Figure 9.
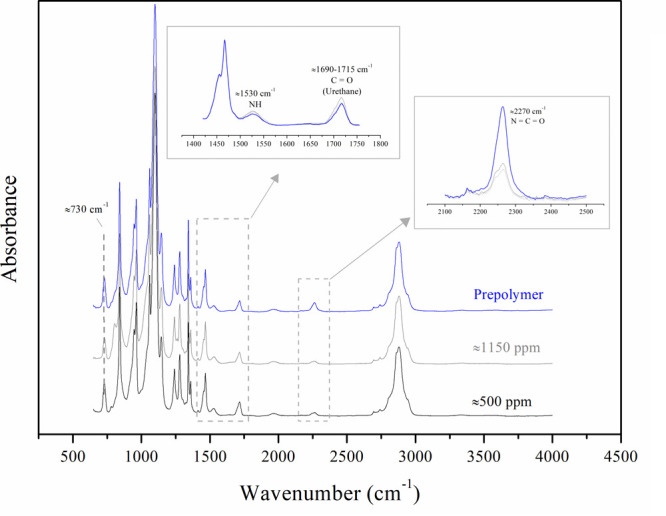
FTIR spectra of selected HEUR samples from the moisture study compared to the prepolymer produced with low-moisture-concentration PEG8000 (≈500 ppm). The initial moisture concentration (in ppm) of the polyol is also indicated on the graphs.
Another observation occurs when comparing directly the Mn results of HEURs and prepolymers at the lowest temperature applied (80 °C). Figure 10 shows that when the chain stopper is present in the reactive mixture, the rate of the molecular weight development is restrained, while the same maximum value (range of ≈20 000 to 22 000 g/mol) is reached for both the prepolymers and the HEUR products. This might be due to the mixing limitations, related to the bulk synthesis applied, and is further elaborated on in the following section of the manuscript.
Figure 10.
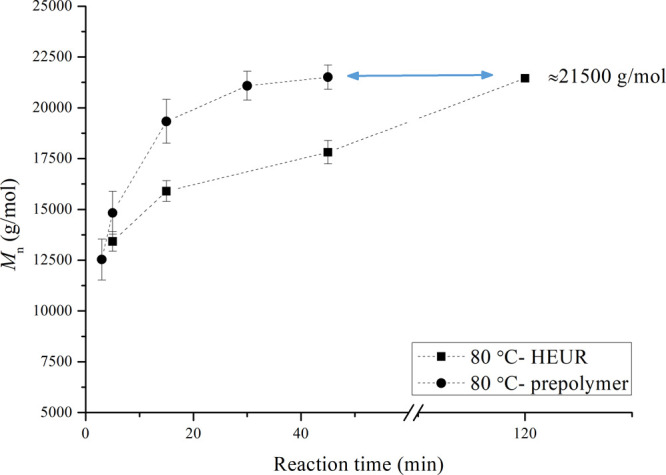
Direct comparison of Mn obtained for HEURs and prepolymers for the reaction temperature of 80 °C. The dashed lines have been added to guide the eye. Experiments have been performed at least in three repetitions with the exception of the point of 120 min for the HEURs.
3.4. Effect of Mixing Speed
Taking into account that the inhomogeneity of the bulk can reach 9% (Figure S4), it can be stated that for mixing speeds of 30–750 rpm, the Mn of the produced HEURs resulted in similar values (≈16 000 to 18 000 g/mol) over time, as presented in Figure 11. Similar to the temperature effect, the mixing speed has an impact on the molecular weight of the HEURs during the first few minutes of the reaction, while the effect decreases over time.
Figure 11.
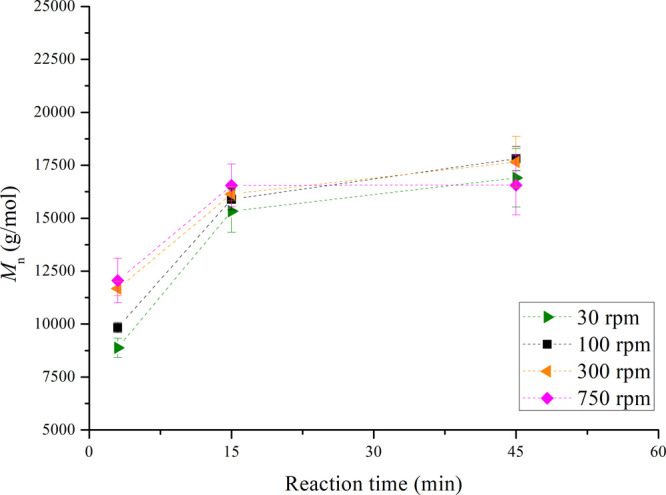
Comparison of Mn obtained for HEURs at different mixing speeds (30, 100, 300, and 750 rpm). The dashed lines have been added to guide the eye. Experiments have been performed in at least three repetitions, with the exception of the experiments at 30 rpm, which were performed in two repetitions.
Specifically, at 30 and 100 rpm, the chain buildup within the first 3 min is delayed compared to that at 300 and 750 rpm. As the reaction time progresses, the transient behavior of the Mn evolution shows that for speeds of up to 300 rpm the Mn increases monotonically. However, in the case of 750 rpm, a maximum Mn value was already reached at 15 min and slightly decreased thereafter. It should be noted that application of mixing speeds >300 rpm can cause segregation of the bulk mixture39 and thereby entrapment of nitrogen bubbles into the melt, eventually leading to product inconsistencies. In addition, such high mixing speeds are difficult to apply in industrial-scale batch reactors of several cubic meters.
During polymerizations at different mixing speeds, the torque exerted on the impeller by the motor was recorded online. Pure melted PEG8000 was used as the background for all mixing speed recordings. As seen in Figure 12, the torque recordings for the 300 and 750 rpm cases showed an instant torque slope increase compared to the 100 rpm case. This behavior indicates faster polymeric chain development and molecular weight buildup initiation.40
Figure 12.
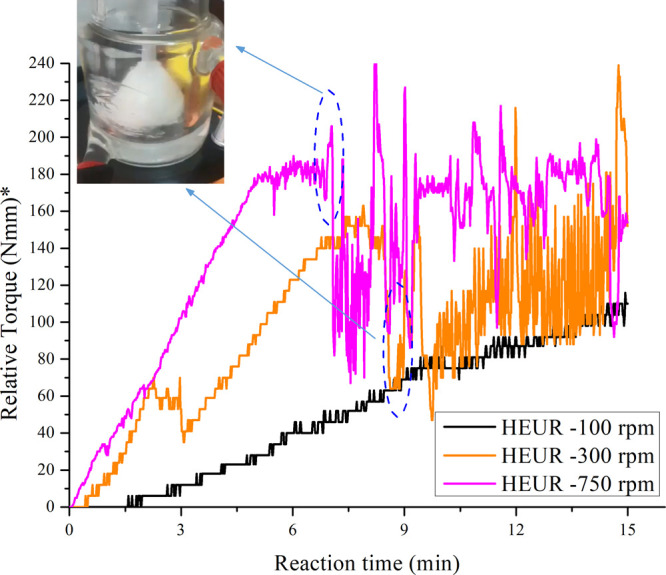
Online torque recordings during polymerizations at different mixing speeds (100, 300, 750 rpm); the recorded signals at 300 and 750 rpm present a sharp drop, indicated on the graph. At this point, the bulk becomes a gel and crawled on the rod of the agitator, as seen in the photo inside the graph. *Relative torque refers to the difference in the actual torque value of the polymer relative to a baseline recording of pure PEG8000 at 80 °C.
As time proceeds, the torque signal increases consistently for all applied speeds, indicating the evolution of the polymerization reaction and the increase in Mn. Figure 12 shows that for higher mixing speeds (300 and 750 rpm), the obtained signal presents a sharp drop and a vigorous oscillation starting at the indicated points in Figure 12. At these points, the reactive mixture became a very viscous gel and crawled on the agitator rod, resulting in poor mixing of the bulk fluid, similar to what was reported by Winters et al.41 for the synthesis of aromatic polyamides. As the authors41 mention, “this phenomenon is known as the Weissenberg effect”. Further, the oscillations of the torque measurements are due to the constant collision of the gel with the walls of the reactor. It is finally noted that the torque measurements were used only for qualitative analysis, as the absolute values of the torque signal are strongly affected by the frictional loads applied at the connection point of the motor with the agitator rod.40
3.5. Mixing Limitations in the System
Possible connection of the Weissenberg phenomenon with the obtained results for both HEURs and prepolymers was further investigated to understand how this effect could possibly be related to reaching similar Mn maximum values when varying different operating parameters. To make this correlation more clear, the temporal evolution of Mn compared to the temporal torque profile for the prepolymer at 110 °C is presented in Figure 13.
Figure 13.
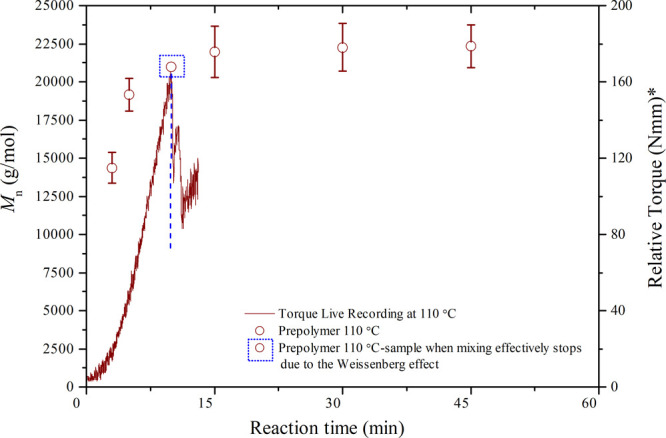
Mn development and online torque recordings during prepolymer production at 110 °C. The Mn of the sample corresponding to when mixing effectively stops due to the Weissenberg effect is highlighted on the graph. *Relative torque refers to the difference in the actual torque value of the prepolymer relative to a baseline recording of pure PEG8000 at 110 °C.
Figure 13 shows that the point of initiation of the Weissenberg effect marks the end of the Mn increase. In other words, the Mn plateau is reached exactly when the phenomenon starts occurring, due to the mixing limitations of the reactive mixture that becomes highly viscous and starts turning around together with the agitator. A similar effect was reported by Stern22 during bulk polyurethane synthesis.
4. Conclusions
We have investigated the effect of critical process parameters of HEUR polymerization, that is, moisture concentration in the starting polyol material, reaction temperature, catalyst concentration, and mixing intensity, on physicochemical and rheological properties of the obtained products. We conclude that the modification of the moisture concentration of the polyol used in HEUR synthesis directly impacts the progress of polymerization. Below a threshold value (≈1000 ppm), the consumption of diisocyanate toward urea is avoided and the main urethane reaction is promoted. This moisture level is in agreement with industrial standards, namely, lower than 1000 ppm. These conclusions are also supported by FTIR and TGA analyses. XRD characterization of the HEURs showed that the crystallinity of the samples remains unaffected compared to the starting polyol, while DSC measurements showed that HEURs starting from PEG with different moisture concentrations result in similar heat capacity curves. Further, steady shear rotational testing of HEUR aqueous solutions (20%) revealed that the presence of urea results in higher viscosity at the Newtonian plateau, while the shear thinning behavior starts at lower shear rates for the HEURs produced with PEG of high moisture concentration. Oscillatory measurements of samples from the moisture study confirmed the viscous character of the HEUR aqueous solutions, and no crossover point was detected in the tested region.
Increase in catalyst concentration in the range of 0.035–2.1 wt % imparts acceleration of the polymerization kinetics, leading to a significant reduction of the processing time and required energy for the synthesis of products with specific Mn. However, the maximum attainable molecular weight is not affected when varying the catalyst concentration for the chosen working system, as it is mixing limitations that mark the end of the polymerization process at high bulk viscosities. The reaction temperatures applied (80–110 °C) indicated that no byproducts are favored as long as a low polyol moisture concentration is maintained. Further, the final Mn appears to be insensitive to temperature both for HEURs and for prepolymers. However, an increase in operating temperature clearly increases the polymerization rate toward the final Mn value. The direct comparison between molecular weight values of HEURs and prepolymers shows that the presence of the chain stopper in HEUR delays the rate of Mn buildup over the entire temperature rate tested, with the effect being more pronounced at lower temperature levels (80 °C).
Finally, increasing the mixing speed from 30 to 750 rpm is beneficial for Mn development during the first few reaction minutes, but after 15 min, the effect vanishes due to the mixing limitations imposed by the viscosity increase of the bulk, which becomes a gel and keeps rotating, violently hitting the reactor walls: a phenomenon known as the Weissenberg effect. The progress of Mn increase in the reactor can qualitatively be monitored via online recording of torque, which keeps increasing with Mn increasing up to the start of the Weissenberg effect, where it sharply drops, indicating termination of bulk mixing. It is envisioned, however, that on process scale-up, using alternative and more efficient mixing technologies, such as static mixers and extruders, complete fluid segregation will not take place, allowing for the attainment of a wider range of Mn values depending on the applied mixing efficiency.
Acknowledgments
The project leading to this publication has received funding from the European Union’s Horizon 2020 Research and Innovation Programme under Grant Agreement No. 820716. The authors would like to thank the Department of Soft Matter, Rheology and Technology of KU Leuven for providing access to DSC and TGA equipment. The authors are also grateful to Antoine Baldin for the rheological testing performed at COATEX.
Supporting Information Available
The Supporting Information is available free of charge at https://pubs.acs.org/doi/10.1021/acsomega.2c04530.
Detailed results on the sampling method (solid and in situ), bulk homogeneity investigation, possible reactions in the system, and additional FTIR, TGA, XRD, and DSC spectra (PDF)
Author Contributions
∥ A.B. and I.T. contributed equally to this work.
The authors declare no competing financial interest.
Supplementary Material
References
- Akindoyo J. O.; Beg M. D. H.; Ghazali S.; Islam M. R.; Jeyaratnam N.; Yuvaraj A. R. Polyurethane Types, Synthesis and Applications – a Review. RSC Adv. 2016, 6, 114453–114482. 10.1039/C6RA14525F. [DOI] [Google Scholar]
- Pulidindi K.; Mukherjee S.. Rheology Modifiers Market Size By Product (Organic, Inorganic), By Application (Paints & Coatings, Personal Care, Adhesives & Sealants, Textiles, Pharmaceuticals, Pulp & Paper, Construction). https://www.gminsights.com/industry-analysis/rheology-modifiers-market, 2016.
- Lu M.; Song C.; Wan B. Influence of Prepolymer Molecular Weight on the Rheology and Kinetics of HEUR-Thickened Latex Suspensions. Prog. Org. Coat. 2021, 156, 106223 10.1016/j.porgcoat.2021.106223. [DOI] [Google Scholar]
- Huldén M. Hydrophobically Modified Urethane-Ethoxylate (HEUR) Associative Thickeners 1. Rheology of Aqueous Solutions and Interactions with Surfactants. Colloids Surf., A 1994, 82, 263–277. 10.1016/0927-7757(93)02637-T. [DOI] [Google Scholar]
- Huldén M. Hydrophobically Modified Urethane-Ethoxylate (HEUR) Associative Thickeners 2. Interaction with Latex. Colloids Surf., A 1994, 88, 207–221. 10.1016/0927-7757(94)02835-4. [DOI] [Google Scholar]
- Fonnum G.; Bakke J.; Hansen F. K. Associative Thickeners. Part I: Synthesis, Rheology and Aggregation Behavior. Colloid Polym. Sci. 1993, 271, 380–389. 10.1007/BF00657419. [DOI] [Google Scholar]
- Barmar M.; Barikani M.; Kaffashi B. Steady Shear Viscosity Study of Various HEUR Models with Different Hydrophilic and Hydrophobic Sizes. Colloids Surf., A 2005, 253, 77–82. 10.1016/j.colsurfa.2004.06.028. [DOI] [Google Scholar]
- Lambourne R.; Jeffs R. A.; Jones W.. Paint and Surface Coatings Theory and Practice, IInd ed.; Lambourne R.; Strivens T. A., Eds.; Woodhead Publishing, 1999. [Google Scholar]
- Quienne B.; Pinaud J.; Robin J. J.; Caillol S. From Architectures to Cutting-Edge Properties, the Blooming World of Hydrophobically Modified Ethoxylated Urethanes (HEURs). Macromolecules 2020, 53, 6754–6766. 10.1021/acs.macromol.0c01353. [DOI] [Google Scholar]
- Winnik M. A.; Yekta A. Associative Polymers in Aqueous Solution. Curr. Opin. Colloid Interface Sci. 1997, 2, 424–436. 10.1016/s1359-0294(97)80088-x. [DOI] [Google Scholar]
- Sharmin E.; Zafar F.. Polyurethane: An Introduction Sharmin E.; Zafar F., Eds.; IntechOpen: London, U.K., 2012. [Google Scholar]
- Szycher M.Szycher’s Handbook of Polyurethanes, IInd ed.; Szycher M., Ed.; CRC Press, 2013. [Google Scholar]
- Barmar M.; Ribitsch V.; Kaffashi B.; Barikani M.; Sarreshtehdari Z.; Pfragner J. Influence of Prepolymers Molecular Weight on the Viscoelastic Properties of Aqueous HEUR Solutions. Colloid Polym. Sci. 2004, 282, 454–460. 10.1007/s00396-003-0968-0. [DOI] [Google Scholar]
- Annable T.; Buscall R.; Ettelaie R.; Whittlestone D. The Rheology of Solutions of Associating Polymers: Comparison of Experimental Behavior with Transient Network Theory. J. Rheol. 1993, 37, 695–726. 10.1122/1.550391. [DOI] [Google Scholar]
- Barmar M. Study of the Effect of PEG Length in Uni-HEUR Thickener Behavior. J. Appl. Polym. Sci. 2009, 111, 1751–1754. 10.1002/app.29192. [DOI] [Google Scholar]
- Vermette P.; Griesser H. J.; Laroche G.; Guidoin R.. Biomedical Applications of Polyurethanes Vermette P., Ed.; Landes Bioscience: TX, 2001. [Google Scholar]
- Emmons W. D.; Stevens T. E.. Polyurethane Thickeners in Latex Compositions. U.S. Patent US4079028, 1978.
- Chiono V.; Sartori S.; Calzone S.; Boffito M.; Tonda-Turo C.; Mattu C.; Gentile P.; Ciardelli G.. Synthetic Biodegradable Medical Polyurethanes, Zhang X., Ed.; Woodhead Publishing Series in Biomaterials; Woodhead Publishing, 2017. [Google Scholar]
- Barmar M.; Barikani M.; Kaffashi B. Synthesis of Ethoxylated Urethane and Modification with Cetyl Alcohol as Thickener. Iran. Polym. J. 2001, 10, 331–335. [Google Scholar]
- Barmar M.; Barikani M. Investigation of the Thickening Efficiency of HEUR on the Behavior of Two Different Latex Types. Int. Polym. Process. 2009, 24, 218–222. 10.3139/217.2191. [DOI] [Google Scholar]
- Barmar M.; Kaffashi B. Rheological Behavior of HEUR Mixtures in Aqueous Media. Int. Polym. Process. 2022, 22, 146–150. 10.1515/ipp-2007-0004. [DOI] [Google Scholar]
- Stern T. Conclusive Chemical Deciphering of the Consistently Occurring Double-Peak Carbonyl-Stretching FTIR Absorbance in Polyurethanes. Polym. Adv. Technol. 2019, 30, 675–687. 10.1002/pat.4503. [DOI] [Google Scholar]
- Arnould P.; Bosco L.; Sanz F.; Simon F. N.; Fouquay S.; Michaud G.; Raynaud J.; Monteil V. Identifying Competitive Tin-or Metal-Free Catalyst Combinations to Tailor Polyurethane Prepolymer and Network Properties. Polym. Chem. 2020, 11, 5725–5734. 10.1039/d0py00864h. [DOI] [Google Scholar]
- Zhao X.; Qi Y.; Li K.; Zhang Z. Hydrogen Bonds and FTIR Peaks of Polyether Polyurethane-Urea. Key Eng. Mater. 2019, 815, 151–156. 10.4028/www.scientific.net/KEM.815.151. [DOI] [Google Scholar]
- Yilgör E.; Burgaz E.; Yurtsever E.; Yilgör I. Comparison of Hydrogen Bonding in Polydimethylsiloxane and Polyether Based Urethane and Urea Copolymers. Polymer 2000, 41, 849–857. 10.1016/S0032-3861(99)00245-1. [DOI] [Google Scholar]
- Teo L. S.; Chen C. Y.; Kuo J. F. Fourier Transform Infrared Spectroscopy Study on Effects of Temperature on Hydrogen Bonding in Amine-Containing Polyurethanes and Poly(Urethane-Urea)s. Macromolecules 1997, 30, 1793–1799. 10.1021/ma961035f. [DOI] [Google Scholar]
- Mattia J.; Painter P. A Comparison of Hydrogen Bonding and Order in a Polyurethane and Poly(Urethane-Urea) and Their Blends with Poly(Ethylene Glycol). Macromolecules 2007, 40, 1546–1554. 10.1021/ma0626362. [DOI] [Google Scholar]
- Shi Y.; Zhan X.; Luo Z.; Zhang Q.; Chen F. Quantitative IR Characterization of Urea Groups in Waterborne Polyurethanes. J. Polym. Sci., Part A: Polym. Chem. 2008, 46, 2433–2444. 10.1002/pola.22577. [DOI] [Google Scholar]
- Auguścik M.; Kurańska M.; Prociak A.; Karalus W.; Lipert K.; Ryszkowska J. Production and Characterization of Poly(Urea-Urethane) Elastomers Synthetized from Rapeseed Oil-Based Polyols Part I. Structure and Properties. Polymers 2016, 61, 490–498. 10.14314/polimery.2016.490. [DOI] [Google Scholar]
- Delpech M. C.; Miranda G. S. Waterborne Polyurethanes: Influence of Chain Extender in FTIR Spectra Profiles. Open Eng. 2012, 2, 231–238. 10.2478/s13531-011-0060-3. [DOI] [Google Scholar]
- Hajas J.; Woocker A. Modified Ureas: An Interesting Opportunity to Control Rheology of Liquid Coatings. Macromol. Symp. 2002, 187, 215–224. . [DOI] [Google Scholar]
- Kousaalya A. B.; Biddappa B. I.; Rai S.; Pilla S.. Mechanical Performance of Poly(Propylene Carbonate)-Based Blends and Composites, 14th ed.; Elsevier Ltd., 2015. [Google Scholar]
- Whittingstall P.Paint Evaluation Using Rheology TA instruments, Thermal Analysis & Rheology, 2000, http://www.tainstruments.com/pdf/literature/RH059.pdf. Last accessed: September 2022. [Google Scholar]
- Ren S.; Liu X.; Fan W.; Wang H.; Erkens S. Rheological Properties, Compatibility, and Storage Stability of SBS Latex-Modified Asphalt. Materials 2019, 12, 3683 10.3390/ma12223683. [DOI] [PMC free article] [PubMed] [Google Scholar]
- Sadeghi F.; Le D. Characterization of Polymeric Biomedical Balloon: Physical and Mechanical Properties. J. Polym. Eng. 2021, 41, 799–807. 10.1515/polyeng-2021-0203. [DOI] [Google Scholar]
- May R.; Kaczmarski J. P.; Glass J. E. Influence of Molecular Weight Distributions on HEUR Aqueous Solution Rheology. Macromolecules 1996, 29, 4745–4753. 10.1021/ma9507655. [DOI] [Google Scholar]
- Heintz A. M.; Duffy D. J.; Hsu S. L.; Suen W.; Chu W.; Paul C. W. Effects of Reaction Temperature on the Formation of Polyurethane Prepolymer Structures. Macromolecules 2003, 36, 2695–2704. 10.1021/ma021559h. [DOI] [Google Scholar]
- Ando T. Effect of Reaction Temperature on Polyurethane Formation in Bulk. Polym. J. 1993, 25, 1207–1209. 10.1295/polymj.25.1207. [DOI] [Google Scholar]
- Paul E. L.; Atiemo-Obeng V. A.; Kresta S. M.. Handbook of Industrial Mixing: Science and Practice, John Wiley & Sons, 2003. [Google Scholar]
- Ponnuswamy S.; Shah S. L.; Kiparissides C. On-line Monitoring of Polymer Quality in a Batch Polymerization Reactor. J. Appl. Polym. Sci. 1986, 32, 3239–3253. 10.1002/app.1986.070320127. [DOI] [Google Scholar]
- Winters J.; Bolia R.; Dehaen W.; Binnemans K. Synthesis of Polyaramids in γ-Valerolactone-Based Organic Electrolyte Solutions. Green Chem. 2021, 23, 1228–1239. 10.1039/d0gc03470c. [DOI] [Google Scholar]
Associated Data
This section collects any data citations, data availability statements, or supplementary materials included in this article.


