

Abstract
Background:
Little is known about the impact of multimorbidity on long term outcomes for older emergency general surgery patients.
Study Design:
Medicare beneficiaries, age 65 and older, who underwent operative management of an emergency general surgery condition were identified using Centers for Medicare and Medicaid claims data. Patients were classified as multimorbid based on the presence of a Qualifying Comorbidity Set (a specific combination of comorbid conditions known to be associated with increased risk of in-hospital mortality in the general surgery setting) and compared to those without multimorbidity. Risk adjusted outcomes through 180 days after discharge from index hospitalization were calculated using linear and logistic regressions.
Results:
Of 174,891 included patients, 45.5% were identified as multimorbid. Multimorbid patients had higher rates of mortality during index hospitalization (5.9% vs 0.7%, OR 3.05, p<0.001), and through six months (17.1% vs 3.4%, OR 2.33, p<0.001) after discharge. Multimorbid patients suffered higher rates of readmission at one month (22.9% vs 11.4%, OR 1.48 p<0.001) and six months (38.2% vs 21.2%, OR 1.48 p<0.001) after discharge, lower rates of discharge to home (42.5% vs 74.2%, OR 0.52 p<0.001), higher rates of discharge to rehab/nursing facility (28.3% vs 11.3%, OR 1.62 p<0.001), greater than double the use of home oxygen, walker, wheelchair, bedside commode, and hospital bed (p<0.001), longer length of index hospitalization (1.33 additional in-patient days, p<0.001), and higher costs through six months ($5,162 additional, p<0.001).
Conclusions:
Older, multimorbid patients suffer worse outcomes, including survival and independent function, after emergency general surgery than non-multimorbid patients through six months after discharge from index hospitalization. This information is important for setting recovery expectations for high-risk patients to improve shared decision making.
Keywords: Multimorbidity, Emergency General Surgery, Mortality, Outcomes, Function, Cost
Precis
This national retrospective observational study finds multimorbid patients, when defined by presence of a Qualifying Comorbidity Set, to suffer worse outcomes (including higher mortality and decreased independence) than non-multimorbid patients through 6 months after emergency general surgery.
Introduction
Emergency general surgery (EGS), a major facet of acute care surgery, is a heterogenous field fraught with complex decision making regarding high-stakes interventions, and currently lacking the necessary rigorous and innovative outcomes research necessary to understand and improve EGS care (1). EGS patients represent a distinct population and, on average, suffer poorer outcomes than patients receiving similar elective operations (1–4). Additionally, many EGS patients are older, with many medical problems, which influences outcomes and adds difficulty to pre-operative patient counseling and decision-making (5–14).
Given the potential for comorbid conditions to interact and influence overall risk of poor outcomes, multimorbidity has been identified as a global health challenge (15,16). In 2018, Silber et al. (5) identified specific combinations of comorbidities, known as Qualifying Comorbidity Sets, that can be used to label patients as multimorbid based on two-fold increased mortality after general surgery. Our group’s prior work has found that using Qualifying Comorbidity Sets to define multimorbidity offers greater selectivity in identifying multimorbid patients and is associated with poorer short-term outcomes after emergency general surgery than having three or more comorbidities (17). However, the impact of multimorbidity on health outcomes beyond thirty days after emergency general surgery currently lacks robust investigation and would be of tremendous use to clinicians in identifying patients at high risk for complications and to aid in pre-operative counseling. Furthermore, patients care about prognosis beyond survival – they care about their function, independence, and about what to expect after surgery (18,19). Outcomes such as use of Durable Medical Equipment (DME) and discharge destination give us insight into patient’s lives that we can evaluate on the population level.
This study aims to examine the impact of multimorbidity, defined by the presence of a Qualifying Comorbidity Set, on major health outcomes through six months after operative management of emergency general surgery conditions. We hypothesize that older, multimorbid, operative EGS patients will have higher rates of mortality persisting through six months after discharge from index hospitalization, decreased independence, and increased post-operative resource utilization than comparable, non-multimorbid patients. This information will allow clinicians and surgeons to discuss post-operative expectations more accurately with older, multimorbid patients with EGS conditions, to improve shared-decision making and goal-concordant care.
Methods
This is a nationwide, retrospective observational cohort study of Medicare beneficiaries aged 65+ using national Centers for Medicare and Medicaid (CMS) claims data. Patients were identified using International Classification of Disease, Ninth/Tenth Revision Clinical Modification (ICD 9/10 CM) billing codes (5,20,21). All included patients underwent operative intervention on hospital day 0, 1, or 2 of admission for an emergency general surgery condition. All included patients were admitted through the emergency department to a nonfederal, acute care hospital between July 1, 2015 and June 30, 2018 and enrolled in Medicare fee-for-service. Type of emergency general surgery condition (colorectal, general abdominal, hepatopancreatobiliary, intestinal obstruction, and upper gastrointestinal) was identified using ICD-9/10 CM codes described by the American Association of the Surgery of Trauma and modified by our research group’s prior work (20,21). Surgeons were included if they performed five or more general surgery operations per year, and general surgery operations were identified using standard Current Procedural Terminology (CPT) codes (22). Patients were excluded if they did not have continuous Part A & B Medicare coverage or if they were enrolled in a Health Maintenance Organization (HMO) at any time between 6 months prior and 6 months after the index emergency general surgery admission (to ensure that their available claims represented all billable encounters). See Figure 1 for a CONSORT flow diagram of patients screened and included in final analysis.
Figure 1:
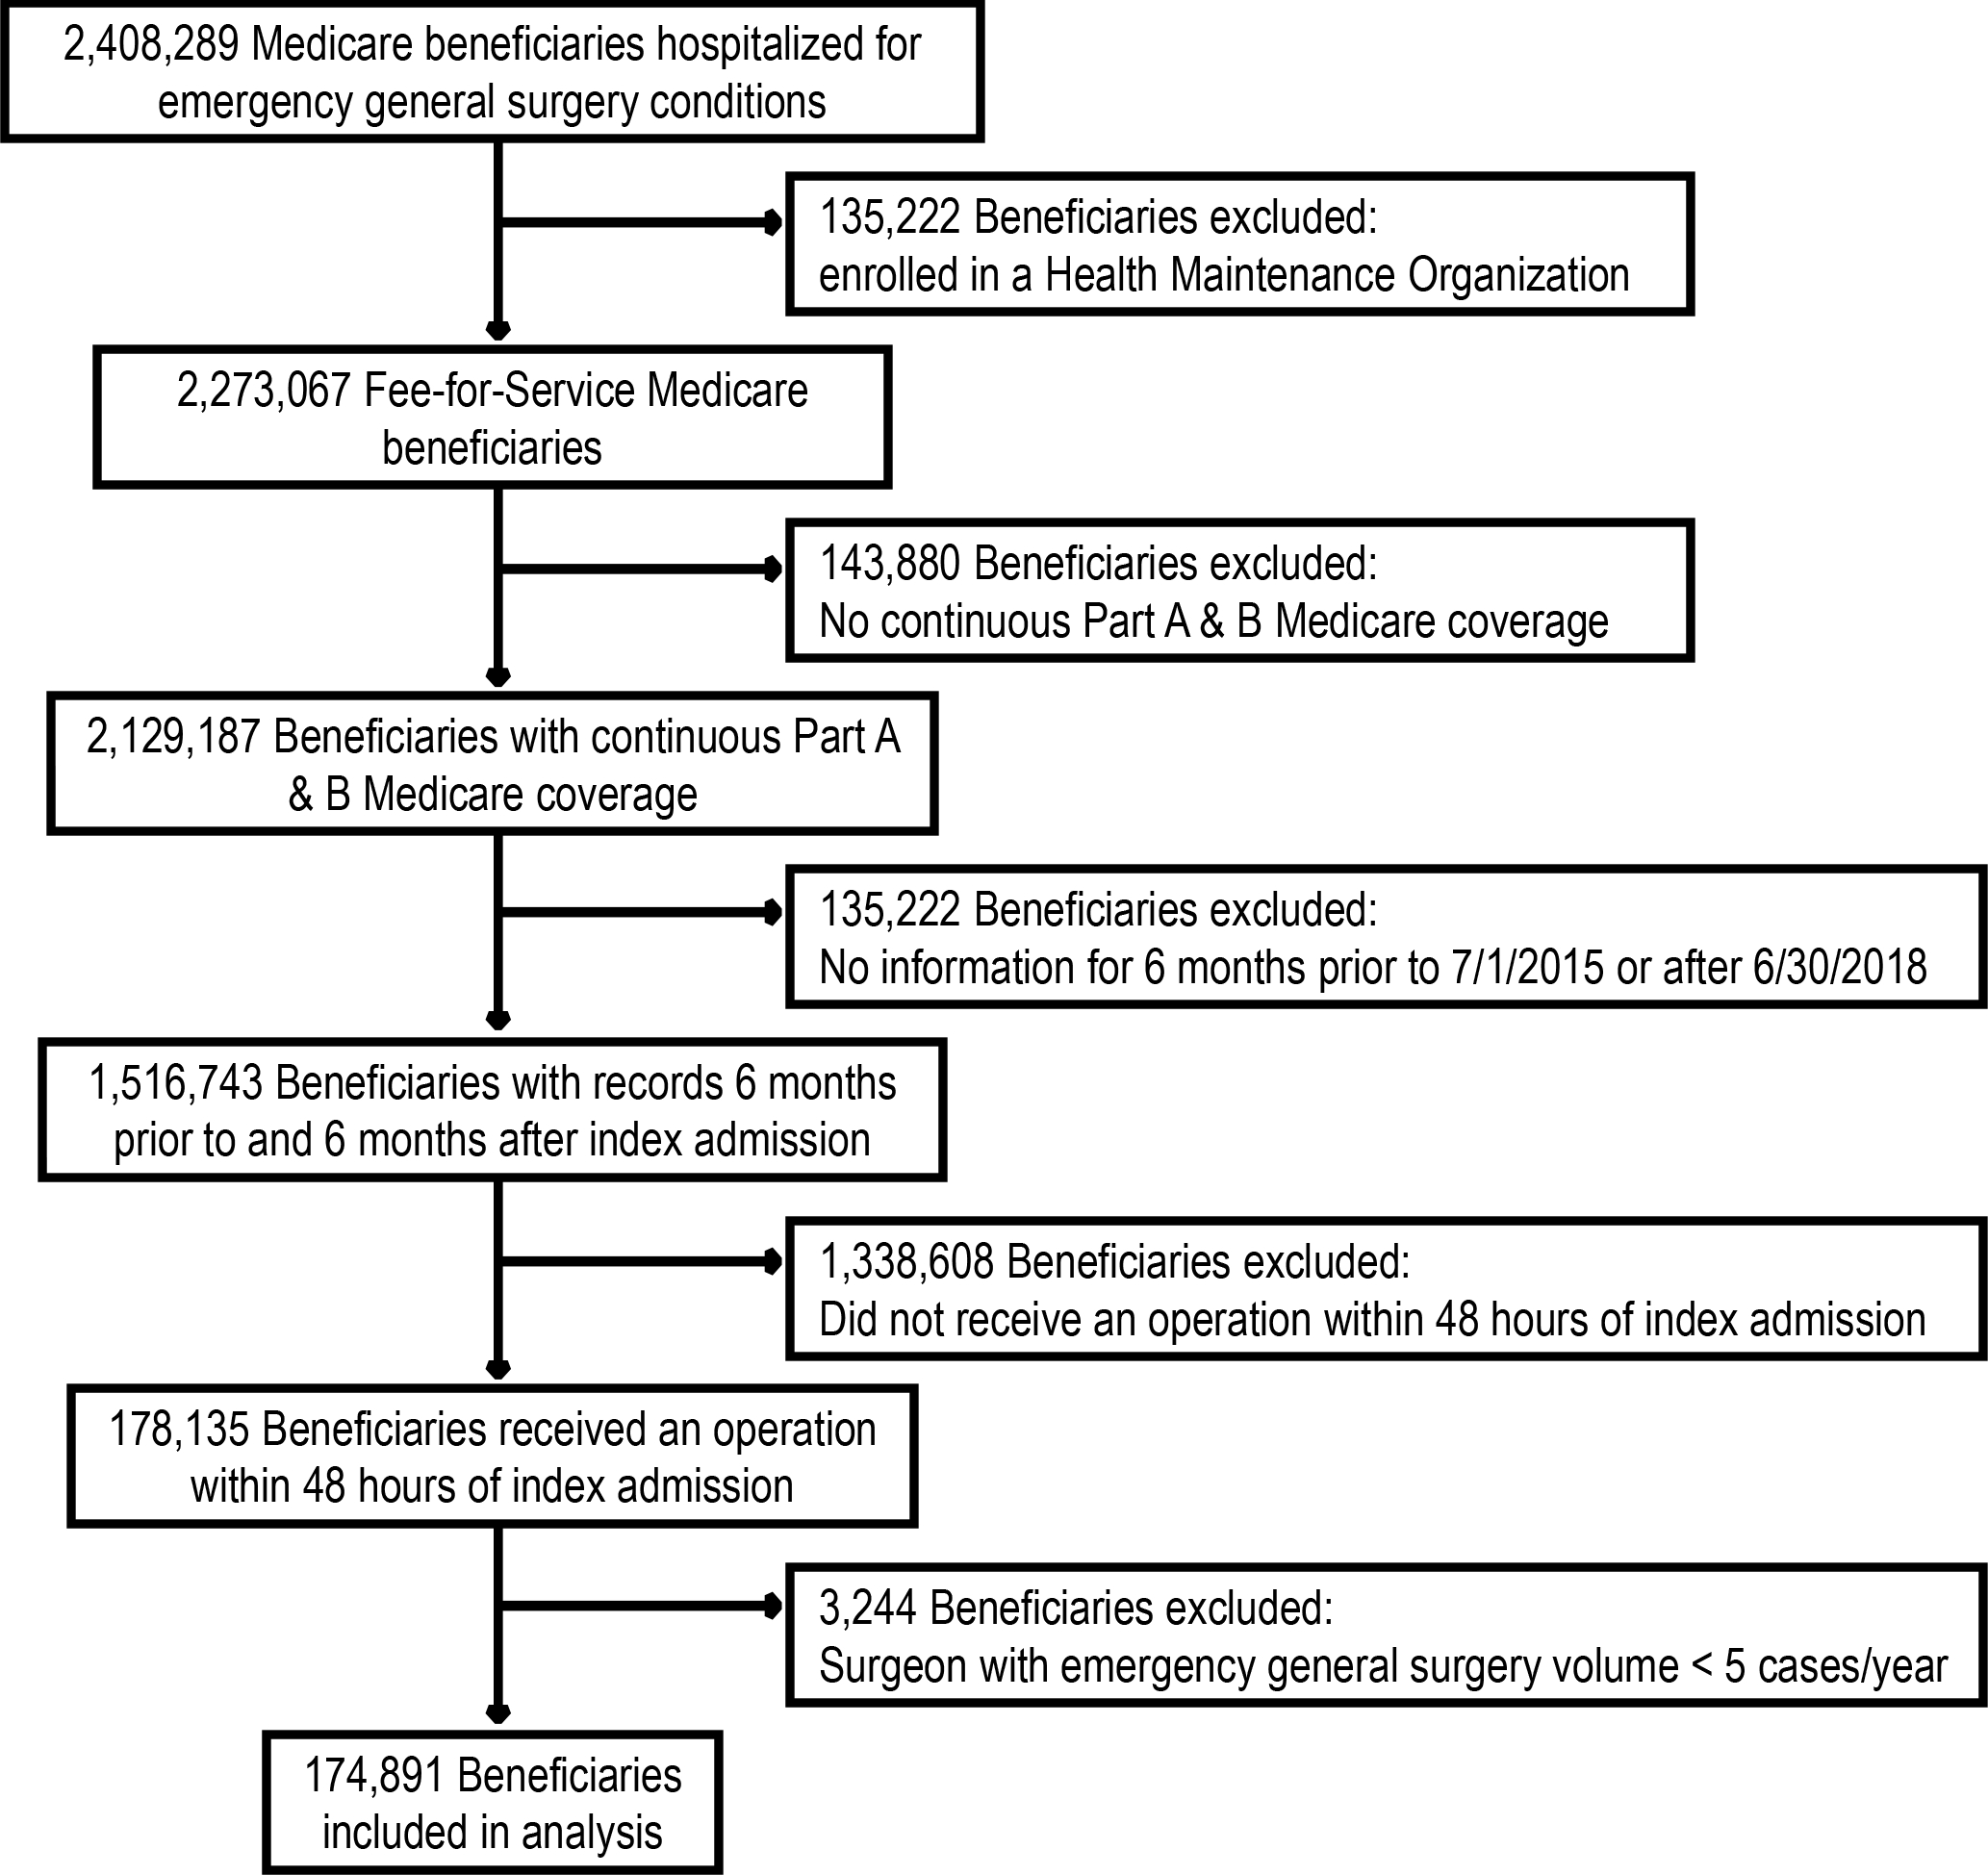
CONSORT flow diagram of patients screened and included in analysis.
Exposure:
First, we identified comorbid conditions using the standard Medicare Hierarchical Condition Category (HCC) coding system (version 22) (23–27) and indicators for disability with CPT codes for durable medical equipment. Comorbid conditions were defined using a six-month look back period of the Medpar, Part B, and durable medical equipment files in addition to the codes present on admission at the time of the index hospitalization. We then defined multimorbidity as the presence of a Qualifying Comorbidity Set (specific combinations of comorbid conditions) identified by Silber et al. (5) to be associated with two-fold increased mortality risk after a general surgery operation (see eTable 1 in the Supplement for full list of analyzed comorbidities and eTable 2 in the Supplement for Qualifying Comorbidity Sets). Patients who did not satisfy a Qualifying Comorbidity Set were identified as non-multimorbid (Non-MM). The purpose of this study was to examine multimorbidity as a binary condition – present for those with a Qualifying Comorbidity Set and not present for patients who may still have multiple comorbidities, but whose specific combinations of comorbidities did not satisfy a Qualifying Comorbidity Set.
Outcomes:
The primary outcome was mortality (from any cause) during index admission and at one month (30 calendar days), three months (90 calendar days), and six months (180 calendar days) after discharge from index hospitalization. Secondary outcomes included complications (20), readmission rates at one, three, and six months after discharge from index hospitalization (excluding patients who died by each time interval), hospital length of stay of index admission (differentiated by mortality), discharge status (to home, to home with home services, to hospice, to rehabilitation/nursing facility), new durable medical equipment use among patients discharged to home (home oxygen, walker, cane, wheelchair/scooter, hospital bed, patient lift, enteral or parenteral supplemental nutrition/hydration; see eTable 3 in the Supplement for list of CPT and HCPCS codes used to identify durable medical equipment use), and cost (of index admission and of subsequent care related to emergency general surgery diagnosis at one, three, and six months after discharge from index hospitalization).
Covariates:
Covariates included age, sex, race category (White, Black, Asian, Hispanic, Native American, Other, Unknown), number of comorbidities at admission and/or within the 6-month look-back period (0, 1, 2, or 3+ comorbid conditions), surgical condition bucket (colorectal, general abdominal, hepatopancreatobiliary, intestinal obstruction, and upper gastrointestinal) (20,21), and dual-eligibility status (having both Medicare and Medicaid coverage, as a proxy for socioeconomic status). The presence of sepsis/septic shock was calculated using the Angus-Sepsis Score (28). Frailty was determined according to the method of Kim and Schneeweiss (29). Covariates were assessed for collinearity and multicollinearity with variance inflation factor of <10 required for inclusion in our regression models (30,31).
The multimorbid population was compared to non-multimorbid patients. Outcomes were reported as numbers of patients and percentage of patients applicable to each outcome. Length of stay was reported as the number of in-patient calendar days and cost was reported in 2018 United States dollars using the medical component of the consumer price index for all urban consumers (32). Continuous variables were reported as mean ± standard deviation. Univariate analyses of continuous variables were performed using one-way ANOVAs, and categorical variables were analyzed using Pearson Chi-squared tests. A Kaplan-Meier curve of all-cause mortality was constructed for multimorbid patients and for non-multimorbid patients with survival curve comparison using the log-rank test (33). Risk-adjusted outcomes for binary variables were generated using multivariable logistic regression models for categorical variables and linear regression for continuous outcomes. We clustered the data by hospital to account for within-hospital correlations that might understate the standard errors. Univariate statistical significance was based on p<0.05, while significance of adjusted outcomes was assessed after Bonferroni correction at p<0.00238. In the adjusted models, the beta coefficients for length of stay and costs represent the increased or decreased days in the hospital or dollars spent for multimorbid as compared to non-multimorbid patients.
This study was deemed exempt from continuing review by the Institutional Review Board of the University of Pennsylvania (Protocol number 832059). Data analysis and statistics were performed using Stata version 17.0 (StataCorp LLC, College Station, TX). This manuscript was prepared in compliance with the Strengthening the Reporting of Observational Studies in Epidemiology (STROBE) reporting guidelines for observational studies (34).
Results
Demographics:
In this retrospective observational study of 174,891 patients who underwent operative intervention for an emergency general surgery condition within 48 hours of their initial presentation, 45.5% (n=79,607) were identified as multimorbid (satisfaction of a Qualifying Comorbidity Set), see Table 1. Though most patients overall were female (54.2%, n=94,732), there were slightly more males in the multimorbid (MM) group (49.2%, n=39,189) than the non-multimorbid (Non-MM) group (43.0%, n=40,970; p <0.001).
Table 1.
Multimorbid vs Non-Multimorbid Patient Demographics
| Variable | Non-multimorbid | Multimorbid | Total | p Value |
|---|---|---|---|---|
| Total, n (%) | 95,284 (54.5) | 79,607 (45.5) | 174,891 (100) | |
| Age, y, mean±SD | 71.8 ± 11.9 | 75.1 ± 11.5 | 73.3 ± 11.9 | <0.001 |
| Sex, n (%) | <0.001 | |||
| Male | 40,970 (43.0) | 39,189 (49.2) | 80,159(45.8) | |
| Race, n (%) | <0.001 | |||
| White | 81,668 (85.7) | 67,710 (85.1) | 149,378 (85.4) | |
| Black | 6,976 (7.3) | 6,885 (8.6) | 13,861 (7.9) | |
| Asian | 1,337 (1.4) | 1,074 (1.3) | 2,411 (1.4) | |
| Hispanic | 2,157 (2.3) | 1,713 (2.2) | 3,870 (2.2) | |
| Native American | 497 (0.5) | 535 (0.7) | 1,032 (0.6) | |
| Other | 1,353 (1.4) | 1,003 (1.3) | 2,356 (1.3) | |
| Unknown | 1,296 (1.4) | 687 (0.9) | 1,983 (1.1) | |
| Number category of comorbid conditions*, n (%) | <0.001 | |||
| 0 | 6,513 (6.8) | 0 (0) | 6,513 (3.7) | |
| 1 | 12,772 (13.4) | 539 (0.7) | 13,301 (7.6) | |
| 2 | 21,788 (19.0) | 1,994 (2.5) | 20,109 (11.5) | |
| 3+ | 57,884 (60.7) | 77,084 (96.8) | 134,968 (77.2) | |
| Number of comorbid conditions*, mean±SD | 3.2 ± 2.0 | 7.6 ± 3.5 | 5.2 ± 3.5 | <0.001 |
| Emergency general surgery condition, n (%) | <0.001 | |||
| Colorectal | 4,903 (5.1) | 5,370 (6.7) | 10,273 (5.9) | |
| General abdominal | 3,252 (3.4) | 11,301 (14.2) | 14,553 (8.3) | |
| Hepatopancreatobiliary | 44,744 (47.0) | 25,687 (32.3) | 70,431 (40.3) | |
| Intestinal obstruction | 21,788 (22.9) | 21,381 (26.9) | 43,169 (24.7) | |
| Upper gastrointestinal | 20,597 (21.6) | 15,868 (19.9) | 36,465 (20.9) | |
| Claims-Based Frailty Index26, mean±SD | 0.129 ± 0.032 | 0.171 ± 0.061 | 0.148 ± 0.052 | <0.001 |
| Preoperative angus sepsis25, yes, n (%) | 2,196 (2.3) | 17,215 (21.6) | 19,411 (11.1) | <0.001 |
| Medicaid dual-eligible, yes, n (%) | 15,350 (16.5) | 15,258 (20.1) | 30,608 (18.1) | <0.001 |
Multimorbidity defined by the satisfaction of Qualifying Comorbidity Set; Non-Multimorbid patients’ comorbidities do not satisfy a Qualifying Comorbidity Set
See eTable 1 for comorbid conditions
Comorbid Conditions
Multimorbid patients had a mean of 7.86 ± 3.5 comorbid conditions, compared to a mean of 3.2 ± 2.0 comorbid conditions among non-multimorbid patients (p<0.001). The majority of multimorbid patients had 3 or more comorbid conditions (96.8%, n=77,084), and almost all had 2+ comorbid conditions (99.3%, n=79,078). Among non-multimorbid patients, 60.7% (n=57,884) had 3 or more and 79.7% (n=79,762) had 2 or more comorbid conditions. The most common comorbid condition was hypertension among both multimorbid patients (81.8%, n = 65,098) and non-multimorbid patients (71%, n = 67,687). See eTable4 in the Supplement for the prevalence of specific comorbid conditions among multimorbid and non-multimorbid patients.
Surgical Condition
The most common EGS condition category for both multimorbid and non-multimorbid patients was hepatopancreatobiliary (32.3% MM, 47% Non-MM), followed by intestinal obstruction (26.9% MM, 22.9% Non-MM), and upper gastrointestinal (19.9% MM, 21.6% Non-MM) conditions (see Table 1). The frequency of emergency general surgery sub-conditions among multimorbid and non-multimorbid patients can be seen in eTable 5 in the Supplement. “Gallstones and related diseases” constituted the most common indication for surgery in our population: 30% of multimorbid patients and 43.4% of non-multimorbid patients. There was a statistically significant difference in the distribution of types of operations received by multimorbid and non-multimorbid patients (p<0.001). The most common operation performed was cholecystectomy (33.9% MM, 45.8% Non-MM) followed by open partial colectomy (15.3% MM, 8.8% Non-MM), laparoscopic appendectomy (7.4% MM, 12.9% Non-MM), and small bowel resection (10.4% MM, 6.4% Non-MM). See Table 2.
Table 2.
Procedure Type by Multimorbidity
| Category, procedure type | Non-multimorbid, n (%) | Multimorbid, n (%) | Total, n (%) |
|---|---|---|---|
| Appendix | |||
| Appendectomy | 2,219 (2.3) | 1,433 (1.8) | 3,652 (2.1) |
| Appendectomy – laparoscopic | 12,297 (12.9) | 5,890 (7.4) | 18,187 (10.4) |
| Hepato-pancreato-biliary | |||
| Biliary common duct | 658 (0.7) | 497 (0.6) | 1,155 (0.7) |
| Biliary other | 34 (<0.1) | 54 (0.1) | 88 (0.1) |
| Cholecystectomy | 43,639 (45.8) | 27,015 (33.9) | 70,654 (40.4) |
| Liver other | 45 (<0.1) | 38 (<0.1) | 83 (<0.1) |
| Liver partial hepatectomy | 115 (0.1) | 164 (0.2) | 279 (0.2) |
| Pancreatectomy | 25 (<0.1) | 59 (0.1) | 84 (<0.1) |
| Enterostomy | |||
| Closure of enterostomy | 23 (<0.1) | 49 (0.1) | 72 (<0.1) |
| Closure of enterostomy with resection | 43 (<0.1) | 101 (0.1) | 144 (0.1) |
| Colon & rectum | |||
| Colectomy partial - laparoscopic | 1,417 (1.5) | 1,217 (1.5) | 2,634 (1.5) |
| Colectomy partial - open | 8,404 (8.8) | 12,151 (15.3) | 20,555 (11.8) |
| Colectomy total - laparoscopic | 17 (<0.1) | 30 (<0.1) | 47 (<0.1) |
| Colectomy total - open | 247 (0.3) | 916 (1.2) | 1,163 (0.7) |
| Large bowel other | 567 (0.6) | 795 (1.0) | 1,362 (0.8) |
| Proctectomy | 690 (0.7) | 746 (0.9) | 1,436 (0.8) |
| Proctectomy - laparoscopic | 200 (0.2) | 107 (0.1) | 307 (0.2) |
| Proctopexy | 66 (0.1) | 40 (0.1) | 106 (0.1) |
| Hernia | |||
| Hernia abdominal - laparoscopic | 1,340 (1.4) | 1,020 (1.3) | 2,360 (1.3) |
| Hernia abdominal - open | 5,179 (5.4) | 4,901 (6.2) | 10,080 (5.8) |
| Hernia groin - laparoscopic | 580 (0.6) | 388 (0.5) | 968 (0.6) |
| Hernia groin - open | 4,448 (4.7) | 3,904 (4.9) | 8,352 (4.8) |
| Small intestine | |||
| Small bowel other | 971 (1.0) | 1,367 (1.7) | 2,338 (1.3) |
| Small bowel resection | 6,125 (6.4) | 8,304 (10.4) | 14,429 (8.3) |
| Adhesions | |||
| Lysis of adhesions | 2,874 (3.0) | 2,998 (3.8) | 5,872 (3.4) |
| Stomach & duodenum | |||
| Pyloroplasty | 30 (<0.1) | 59 (0.1) | 89 (0.1) |
| Stomach anti-reflux | 39 (<0.1) | 37 (<0.1) | 76 (<0.1) |
| Stomach gastric bypass (non-bariatric) | 106 (0.1) | 184 (0.2) | 290 (0.2) |
| Stomach other | 160 (0.2) | 302 (0.4) | 462 (0.3) |
| Stomach partial gastrectomy | 279 (0.3) | 556 (0.7) | 835 (0.5) |
| Stomach total gastrectomy | 13 (<0.1) | 44 (0.1) | 57 (<0.1) |
| Ulcer | 2,365 (2.5) | 4,033 (5.1) | 6,389 (3.7) |
| Spleen | |||
| Splenectomy | 53 (0.1) | 139 (0.2) | 192 (0.1) |
Multimorbidity defined by the satisfaction of Qualifying Comorbidity Set; Non-Multimorbid patients’ comorbidities do not satisfy a Qualifying Comorbidity Set
Unadjusted Outcomes: Multimorbid vs Non-Multimorbid Patients
Multimorbid patients had higher rates of mortality during the index hospitalization (5.9% vs 0.7%, p<0.001), and also within one month (9.4% vs 1.4%, p<0.001), two months (12.2% vs 2%, p<0.001), three months (13.8% vs 2.4%, p<0.001), and six months (17.1% vs 3.4%, p<0.001) of discharge from index hospitalization. Kaplan-Meier survival curves between multimorbid and non-multimorbid patients were significantly different (p<0.001), see Figure 2. Multimorbid patients were also less likely than non-multimorbid patients to be discharged to home (42.4% vs 74.2%, p<0.001), and more likely to be discharged to a rehabilitation center or skilled nursing facility (28.3% vs 11.3%, p<0.001) or to Hospice (2.1% vs 0.3%, p<0.001). Furthermore, multimorbid patients were more likely to be readmitted to the hospital within one month (22.9% vs 11.4%, p<0.001), two months (27.2% vs 13.8%, p<0.001), three months (30.5% vs 16%, p<0.001), and six months (38.2% vs 21.2%, p<0.001) of discharge from their index hospitalization, see Table 3.
Figure 2:
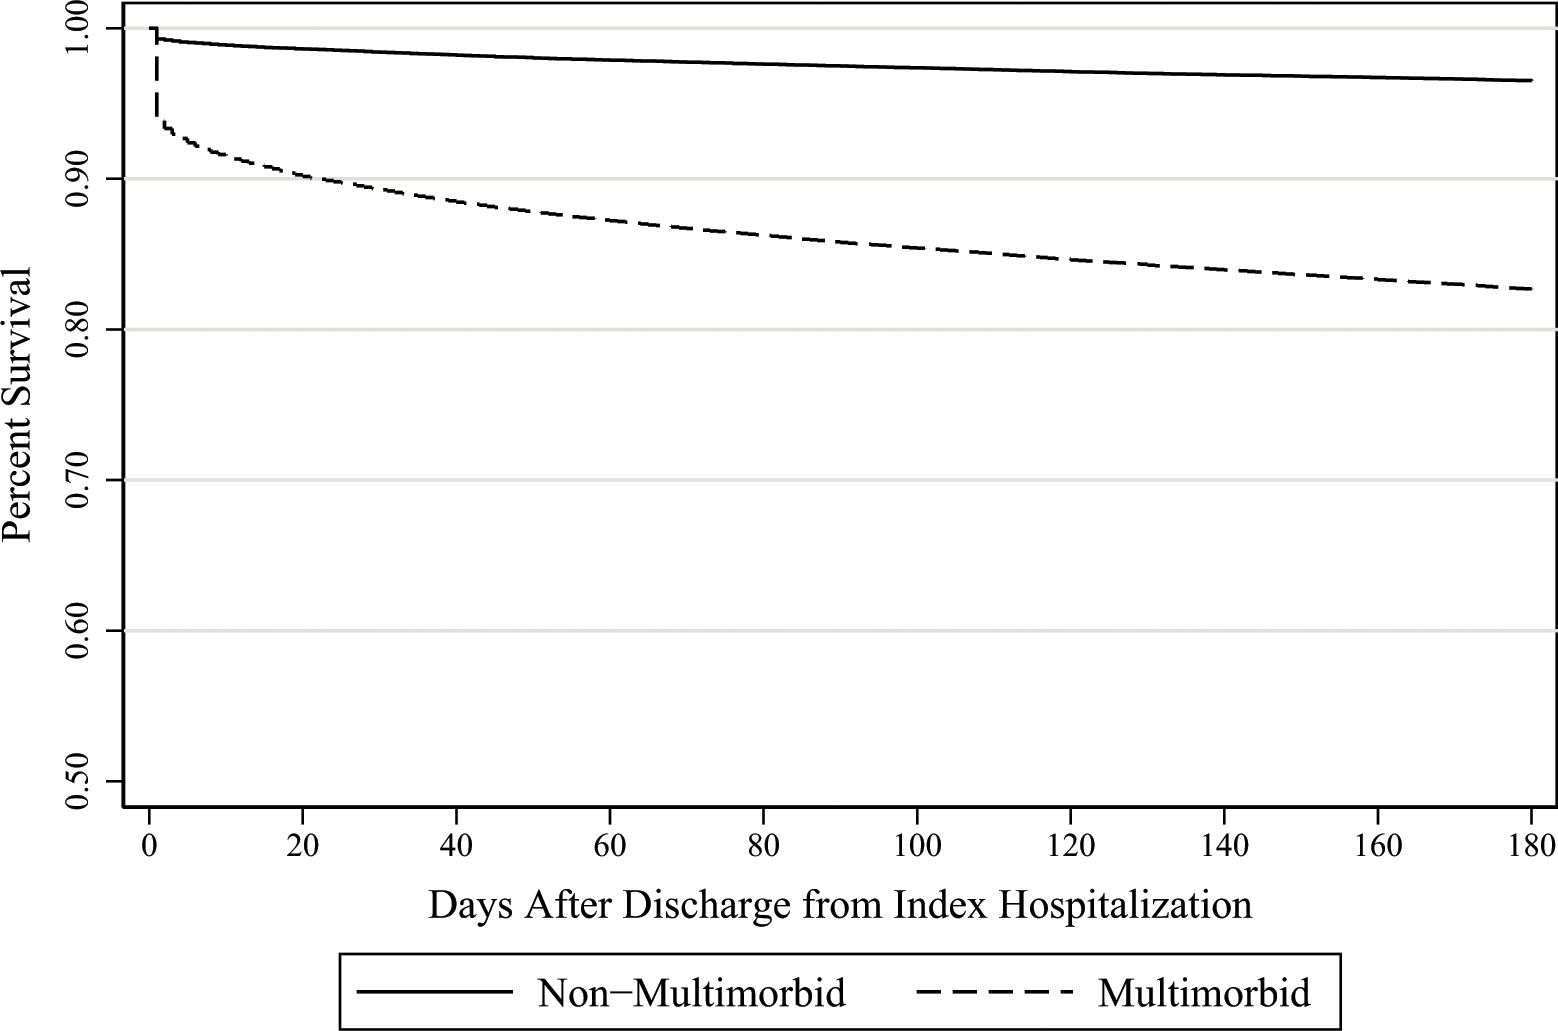
Survival rates by multimorbid status over time.
Table 3.
Comparing Unadjusted Outcomes for Multimorbid vs Non-Multimorbid Patients
| Variable | Non-Multimorbid | Multimorbid | Total | p Value |
|---|---|---|---|---|
| Mortality, n (% of total patients) | ||||
| During index hospitalization | 657 (0.7) | 4,706 (5.9) | 5,363 (3.1) | <0.001 |
| Within 30 days of index hospitalization discharge | 1,337 (1.4) | 7,518 (9.4) | 8,855 (5.1) | <0.001 |
| Within 60 days of index hospitalization discharge | 1,911 (2.0) | 9,677 (12.2) | 11,588 (6.6) | <0.001 |
| Within 90 days of index hospitalization discharge | 2,315 (2.4) | 10,977 (13.8) | 13,292 (7.6) | <0.001 |
| Within 180 days of index hospitalization discharge | 3,273 (3.4) | 13,614 (17.1) | 16,887 (9.7) | <0.001 |
| Discharge status, n (% of patients who survived index hospitalization) | ||||
| Discharged to home | 70,726 (74.2) | 33,871 (42.5) | 104,597 (59.8) | <0.001 |
| Discharged to home with home health services | 21,177 (22.2) | 34,508 (43.3) | 55,685 (31.8) | <0.001 |
| Discharged to hospice | 310 (0.3) | 1,697 (2.1) | 2,007 (1.1) | <0.001 |
| Discharged to rehabilitation center or nursing facility | 10,798 (11.3) | 22,506 (28.3) | 33,304 (19.0) | <0.001 |
| Readmissions, n (% of patients who survived to that time point) | ||||
| Within 30 days of index hospitalization discharge | 10,703 (11.4) | 16,507 (22.9) | 27,210 (16.4) | <0.001 |
| Within 60 days of index hospitalization discharge | 12,867 (13.8) | 19,029 (27.2) | 31,896 (19.5) | <0.001 |
| Within 90 days of index hospitalization discharge | 14,900 (16.0) | 20,948 (30.5) | 35,848 (22.2) | <0.001 |
| Within 180 days of index hospitalization discharge | 19,516 (21.2) | 25,212 (38.2) | 44,728 (28.3) | <0.001 |
| New durable medical equipment use within 30 days of index hospitalization, n (% of patients discharged to home) | n=68,130 | n=36467 | n=104597 | |
| Home oxygen | 777 (1.0) | 1,274 (3.7) | 2,051 (2.0) | <0.001 |
| Cane/crutch | 141 (0.2) | 147 (0.4) | 288 (0.3) | 0.060 |
| Walker | 3,173 (4.5) | 3,896 (11.5) | 7,069 (6.8) | <0.001 |
| Wheelchair or scooter | 280 (0.4) | 681 (2.0) | 961 (0.9) | <0.001 |
| Bedside commode | 832 (1.2) | 1,244 (3.7) | 2,076 (2.0) | <0.001 |
| Hospital bed | 175 (0.2) | 441 (1.3) | 616 (0.6) | <0.001 |
| Patient lift | 21 (<0.1) | 74 (0.1) | 95 (0.1) | <0.001 |
| Home infusion therapy supplies | 91 (0.1) | 194 (0.6) | 285 (0.3) | <0.001 |
| Length of stay (calendar days), mean±SD | ||||
| Index hospital admission | 4.5 ± 3.9 | 7.5 ± 6.7 | 5.9 ± 5.6 | <0.001 |
| Index hospital admission (excluding in-hospital death) | 4.5 ± 3.9 | 7.5 ± 6.5 | 5.8 ± 5.4 | <0.001 |
| ICU | 0.7 ± 2.4 | 2.7 ± 5.1 | 1.6 ± 4.0 | <0.001 |
| ICU (excluding in-hospital death) | 0.7 ± 2.3 | 2.5 ± 4.9 | 1.5 ± 3.8 | <0.001 |
| Emergency general surgery-related cost, $, mean±SD | ||||
| In-hospital | 13,764±9,737 | 21,258±17,047 | 17,175±14,066 | <0.001 |
| 30-day | 14,395±10,828 | 23,189±19,532 | 18,398±16,022 | <0.001 |
| 90-day | 14,957±12,265 | 24,951±23,139 | 19,506±18,720 | <0.001 |
| 180-day | 15,565±13,778 | 26,452±25,794 | 20,521±20,873 | <0.001 |
Multimorbidity defined by the satisfaction of Qualifying Comorbidity Set; Non-Multimorbid patients’ comorbidities do not satisfy a Qualifying Comorbidity Set
During index hospitalization, multimorbid patients stayed on average 7.5 ± 6.7 days in the hospital while non-multimorbid patients stayed 4.5 ± 3.9 days (p<0.001). Excluding those who died during the index hospitalization, multimorbid patients stayed 7.5 ± 6.5 days compared to 4.5 ± 3.9 days for non-multimorbid patients (p<0.001). Additionally, multimorbid patients stayed an average of 2.7 ± 5.1 days in the intensive care unit during index hospitalization compared to 0.7 ± 2.4 days for non-multimorbid patients (p<0.001), and for those who survived index hospitalization, multimorbid patients stayed 2.5 ± 4.9 days in the intensive care unit during index hospitalization compared to 0.7 ± 2.3 days for non-multimorbid patients.
New use of durable medical equipment within 30 days of discharge from index hospitalization was more common among multimorbid patients than non-multimorbid patients, though there was low prevalence overall. Multimorbid patients were more than twice as likely to require a walker (11.5% vs 4.5%, p<0.001), home oxygen (3.7% vs 1%, p<0.001), a bedside commode (3.7% vs 1.2%, p<0.001), a wheelchair/scooter (2% vs 0.4%, p<0.001), or a hospital bed (1.3% vs 0.2%, p<0.001).
Multimorbid patients cost significantly more to treat than non-multimorbid patients during the index hospitalization ($21,258 ± 17,047 vs $13,764 ± 9,737 per patient, p<0.001), and at one month ($23,189 ± 19,532 vs $14,395 ± 10,828 per patient, p<0.001), three months ($24,951 ± 23,139 vs $14,957 ± 12,265 per patient, p<0.001), and six months ($26,452 ± 25,794 vs $15,565 ± 13,778 per patient, p<0.001) after discharge from index hospitalization.
Adjusted Outcomes: Multimorbid vs Non-Multimorbid Patients
Multimorbid patients had three-times increased odds of death during index hospitalization compared to non-multimorbid patients (OR = 3.05, p<0.001), and at six months after index hospitalization still had over double the odds of death (OR=2.33, p<0.001), see Table 4. Additionally, multimorbid patients had 72% higher odds of a complication during the index admission (OR = 1.72, p<0.001). Multimorbid patients had half as likely odds of being discharged to home (OR = 0.52, p<0.001) and 2.51 times increased odds of being discharged to Hospice than non-multimorbid patients (p<0.001). Multimorbid patients had 50% higher odds of readmission to the hospital at one, three, and six months compared to non-multimorbid patients (p<0.001) and stayed, on average, 1.3 calendar days longer in the hospital than non-multimorbid patients during the index admission, even when stratified by in-hospital mortality (p<0.001). The cost discrepancy between multimorbid and non-multimorbid patients increased over time, from $4,051 extra dollars spent per multimorbid patient in-hospital (p<0.001) to $5,162 extra dollars spent per multimorbid patient at six months after discharge (p<0.001). For our population of 79,607 multimorbid patients, this is 410 million extra dollars.
Table 4.
Adjusted Outcomes
| Variable | Measure, comparison | p Value† |
|---|---|---|
| Mortality | Odds ratio, multimorbid vs non-multimorbid patients | |
| During index hospitalization | 3.05 | <0.001 |
| Within 30 days of index hospitalization discharge | 2.68 | <0.001 |
| Within 90 days of index hospitalization discharge | 2.45 | <0.001 |
| Within 180 days of index hospitalization discharge | 2.33 | <0.001 |
| Discharge status | ||
| Discharged to home | 0.52 | <0.001 |
| Discharged to home with home health services | 1.54 | <0.001 |
| Discharged to hospice | 2.51 | <0.001 |
| Discharged to rehabilitation center or nursing facility | 1.62 | <0.001 |
| Complication | ||
| Complications (during index admission) | 1.72 | <0.001 |
| Readmissions OR | ||
| Within 30 days of index hospitalization discharge | 1.48 | <0.001 |
| (Excluding patients who died within 30 days) | 1.50 | <0.001 |
| Within 90 days of index hospitalization discharge | 1.49 | <0.001 |
| (Excluding patients who died within 90 days) | 1.49 | <0.001 |
| Within 180 days of index hospitalization discharge | 1.48 | <0.001 |
| (Excluding patients who died within 180 days) | 1.49 | <0.001 |
| Length of stay | Additional inpatient calendar days compared to non-multimorbid patients | |
| Index hospital admission | + 1.33 | <0.001 |
| Index hospital admission (excluding in-hospital death) | + 1.32 | <0.001 |
| EGS related cost | Additional US dollars spent compared to non-multimorbid patients | |
| In-hospital | 4,051.1 | <0.001 |
| 30-day | 4,538.9 | <0.001 |
| 90-day | 4,914.7 | <0.001 |
| 180-day | 5,162.1 | <0.001 |
Multimorbidity defined by the satisfaction of Qualifying Comorbidity Set; Non-Multimorbid patients’ comorbidities do not satisfy a Qualifying Comorbidity Set
Bonferroni correction yields significance threshold of <0.00238
Discussion
In this national CMS claims-based study, we found that the presence of a Qualifying Comorbidity Set, when used to designate a patient as multimorbid, confers substantially increased odds of mortality through six months after discharge from index hospitalization for surgical management of an EGS condition. Furthermore, our multimorbid EGS population suffered increased readmission rates through six months, increased rates of complications, decreased rates of discharge to home, increased rates of discharge to a skilled nursing facility or to Hospice, increased use of durable medical equipment, and increased cost of care through six months when compared to non-multimorbid patients. Several of these outcomes, especially readmission risks, discharge status, and dependency on medical equipment, are important for expectation planning with older patients in the pre-operative setting. The considerable risk associated with multimorbidity suggests that the use of Qualifying Comorbidity Sets to identify multimorbid patients is a useful tool in the EGS setting.
Multimorbidity, recognized as a global health challenge (16,35) and highlighted as by the National Institutes of Health (NIH) through an initiative to expand research on measurement, causes, and consequences of multimorbidity (36), has various definitions. This variation, and the complexity of multimorbid patients, limits evidence-based clinical decision support for multimorbid patients (37,38). Suls et al. (39) recommend consideration of the purpose of multimorbidity identification when selecting the appropriate measurement – for example, a claims-based approach when attempting to predict morbidity, mortality, and health care utilization of patients, as in our study. The most straightforward definition of multimorbidity is the presence of two or more comorbidities (11,40,41). Though this definition of multimorbidity may allow providers to quickly recognize a patient as “multimorbid”, this count-based definition fails to value the interactions between specific medical conditions that may contribute to overall health and risks. In response, Silber et al. (5) developed Qualifying Comorbidity Sets to define multimorbidity using ICD-9/10 CM claims to identify specific patient populations at high risk for adverse outcomes after surgery. Our current investigation highlights the selectivity of using Qualifying Comorbidity Sets to define multimorbidity as opposed to simply counting comorbid conditions, reaffirming and expanding on our prior work (17) – in our total cohort, 45.5% of patients were found to have a Qualifying Comorbidity Set and were thus identified as multimorbid, while 79.7% of patients without a Qualifying Comorbidity Set had two or more comorbidities and 60.7% had 3+ comorbidities. Our cohort with a Qualifying Comorbidity Set suffered worse outcomes, through six months, than patients without a Qualifying Comorbidity Set, of whom 79.7% may be labeled as “multimorbid” with a simple count-based method. Ho et al. (42) recently found older patients with “complex multimorbidity” (i.e. functional limitations, geriatric syndrome, and chronic medical conditions) have higher risk of mortality within three years after an EGS admission. Qualifying Comorbidity Sets incorporate chronic and acute diagnoses, include concordant and discordant conditions, and consider function-related concepts (like home oxygen use and wheelchair/hospital bed use) when defining multimorbidity, thus representing a holistic and patient-centered approach to multimorbid patient identification, in line with the NIH aims of multimorbidity research (36). Furthermore, our focus on outcomes beyond mortality is an important extension of prior multimorbidity research.
After emergency abdominal surgery, older patients not only suffer higher rates of mortality but are also less likely than their younger counterparts to be discharged home (43–46). Patients care about more than just survival – they care about what their life looks like in recovery and they want honest preparation for what to expect (18,19). As such, it’s important for surgeons to consider and communicate outcomes regarding what patients want to know: those related to their independence and anticipated functional status. Our study’s findings of increased complications, increased use of durable medical equipment, decreased rates of discharge to home, and increased rates of discharge to nursing facilities or rehab among multimorbid, older patients provide valuable quality-of-life metrics. In 2015, Faurot et al. (47) analyzed the use of durable medical equipment as a predictor for dependency in activities of daily living and found charges for a home hospital bed or wheelchair to be strong predictors of activities of daily living dependency, but, overall, the use durable medical equipment information in health services research, especially in non-orthopedic surgery, is extremely limited. As such, the inclusion of durable medical equipment as an outcome metric in this analysis is a novel approach to using claims data to paint a picture of life quality that could be important to patients. This information, along with risk of readmission and likelihood of discharge to home or to another level of care, can help guide conversations that surgeons can have with multimorbid patients presenting with emergency general surgery conditions regarding post-operative expectations for recovery and subsequent independence/functional status.
It’s important to note that in this analysis, which only considered patients who received an operation, a substantial proportion of emergency general surgery diagnoses were those that could have been managed operatively or non-operatively: gallstones, diverticular disease, and appendicitis, for example (48–52). Furthermore, given that this investigation utilizes claims-based data, there are other important limitations. The first is that the accuracy of our results depends on the accuracy of coding, which can vary between institutions and individual coders. This was controlled for, in part, through clustering our analysis by hospital. Furthermore, as this study was aimed to understand the impact of multimorbidity as a whole, it lacks granular information for differences between Qualifying Comorbidity Sets which is beyond the scope of this study. Finally, this study only included Medicare beneficiaries aged 65 and older, which could limit the generalizability of our findings. Our research team is currently developing a mobile App to easily identify patients as multimorbid, based on the presence of a Qualifying Comorbidity Set, in order to prospectively study this population and improve generalizability and validity of these findings.
Conclusions
In this national, retrospective observational study of Medicare beneficiaries who underwent emergency general surgery, we found that the established poor short-term outcomes of multimorbid patients (5,17) extends through six months after the index hospitalization. These poor outcomes include higher mortality, higher rates of readmission, and higher cost of care. Placing value on and understanding quality-of-life metrics, such as discharge status and durable medical equipment use, gives patients the information that they want to know, especially regarding independence. Multimorbidity is a powerful prognostic indicator, and further work to provide granular details would improve shared decision-making and goal-concordant care.
Supplementary Material
Acknowledgement:
With instrumental support from, and appreciation for the Center for Outcomes Research at the Children’s Hospital of Philadelphia Research Institute, Philadelphia, PA, led by Jeffrey H Silber, MD, PhD for identification of comorbid conditions with International Classification of Disease (ICD), Current Procedural Terminology (CPT) and Healthcare Common Procedure Coding System (HCPCS) Codes and for identification of Qualifying Comorbidity Sets.
Support:
Research reported in this publication was supported by the National Institute On Aging of the National Institutes of Health under Award Number F32AG074614 and Award Number R01AG060612.
Abbreviations
- EGS
Emergency General Surgery
- QCS
Qualifying Comorbidity Set
- ICD-9/10 CM
International Classification of Disease, Ninth/Tenth Revision, Clinical Modification
- CMS
Centers for Medicare and Medicaid
- CPT
Current Procedural Terminology
- HCPCS
Healthcare Common Procedure Coding System
- HMO
Health Maintenance Organization
- MM
Multimorbid
- Non-MM
Non-Multimorbid
- NIH
National Institutes of Health
- HCC
Hierarchical Condition Category
Footnotes
Disclosure Information:
Disclaimer: The content is solely the responsibility of the authors and does not necessarily represent the official views of the National Institutes of Health.
Presented at the American College of Surgeons 108th Annual Clinical Congress, Scientific Forum, San Diego, CA, October 2022.
References
- 1.Becher RD, Davis KA, Rotondo MF, Coimbra R. Ongoing evolution of emergency general surgery as a surgical subspecialty. Journal of the American College of Surgeons 2018;226(2):194–200. [DOI] [PubMed] [Google Scholar]
- 2.Havens JM, Peetz AB, Do WS, et al. The excess morbidity and mortality of emergency general surgery. J Trauma Acute Care Surg 2015;78(2):306–311. [DOI] [PubMed] [Google Scholar]
- 3.Patel SS, Patel MS, Goldfarb M, et al. Elective vs emergency surgery for ulcerative colitis: A national surgical quality improvement program analysis. Am J Surg 2013;205(3):333–337. [DOI] [PubMed] [Google Scholar]
- 4.Lilley EJ, Kelley A, Bollens-Lund E, et al. Pre-existing illness burden is associated with emergency department visits and mortality after emergency laparotomy. Geriatric Surgery and Palliative Care 2017;225(4):S95–S96. [Google Scholar]
- 5.Silber JH, Reiter JG, Rosenbaum PR, et al. Defining multimorbidity in older surgical patients. Med Care 2018;56(8):701–710. [DOI] [PMC free article] [PubMed] [Google Scholar]
- 6.Chi M, Lee C, Wu S. Multiple morbidity combinations impact on medical expenditures among older adults. Arch Gerontol Geriatr 2011;52(3):210. [DOI] [PubMed] [Google Scholar]
- 7.Gross CP, Guo Z, McAvay GJ, et al. Multimorbidity and survival in older persons with colorectal cancer. J Am Geriatr Soc 2006;54(12):1898–1904. [DOI] [PubMed] [Google Scholar]
- 8.Shah AA, Haider AH, Zogg CK, et al. National estimates of predictors of outcomes for emergency general surgery. J Trauma Acute Care Surg 2015;78(3):482–491. [DOI] [PubMed] [Google Scholar]
- 9.Kassin MD, Owen RM, Perez SD, et al. Risk factors for 30-day hospital readmission among general surgery patients. J Am Coll Surg 2015;215(3):322–330. [DOI] [PMC free article] [PubMed] [Google Scholar]
- 10.Tooth L, Hockey R, Byles J, Dobson A. Weighted multimorbidity indexes predicted mortality, health service use, and health-related quality of life in older women. J Clin Epidemiol 2008;61(2):151–159. [DOI] [PubMed] [Google Scholar]
- 11.Condelius A, Edberg A, Jakobsson U, Hallberg IR. Hospital admissions among people 65+ related to multimorbidity, municipal and outpatient care. Arch Gerontol Geriatr 2008;46(1):41–55. [DOI] [PubMed] [Google Scholar]
- 12.Columbus AB, Morris MA, Lilley EJ, et al. Critical differences between elective and emergency surgery: Identifying domains for quality improvement in emergency general surgery. Surgery 2018;163(4):832–838. [DOI] [PubMed] [Google Scholar]
- 13.Lee TA, Shields AE, Vogeli C, et al. Mortality rate in veterans with multiple chronic conditions. J Gen Intern Med 2007;22(3):403–407. [DOI] [PMC free article] [PubMed] [Google Scholar]
- 14.Lee KC, Streid J, Sturgeon D, et al. The impact of frailty on long-term patient-oriented outcomes after emergency general surgery: A retrospective cohort study. J Am Geriatr Soc 2020;68(5):1037–1043. [DOI] [PMC free article] [PubMed] [Google Scholar]
- 15.Koroukian SM, Warner DF, Owusu C, Given CW. Multimorbidity redefined: Prospective health outcomes and the cumulative effect of co-occurring conditions. Prev Chronic Dis 2015;12:E55. [DOI] [PMC free article] [PubMed] [Google Scholar]
- 16.Nanna M, Alexander KP. A call to ACTION in caring for older patients with multimorbidity. American College of Cardiology. Available at: https://www.acc.org/latest-in-cardiology/articles/2019/07/03/08/22/a-call-to-action-in-caring-for-older-patients-with-multimorbidity. Accessed Nov 9, 2020. [Google Scholar]
- 17.Rosen CB, Wirtalla C, Keele LJ, et al. Multimorbidity confers greater risk for older patients in emergency general surgery than the presence of multiple comorbidities: A retrospective observational study Medical Care. In press 2022. [DOI] [PMC free article] [PubMed] [Google Scholar]
- 18.Doering LV, McGuire AW, Rourke D. Recovering from cardiac surgery: What patients want you to know. Am J Crit Care 2002;11(4):333–343. [PubMed] [Google Scholar]
- 19.McNair AGK, MacKichan F, Donovan JL, et al. What surgeons tell patients and what patients want to know before major cancer surgery: A qualitative study. BMC Cancer 2016;16. [DOI] [PMC free article] [PubMed] [Google Scholar]
- 20.Sharoky CE, Sellers MM, Keele LJ, et al. Does surgeon sex matter?: Practice patterns and outcomes of female and male surgeons. Annals of Surgery 2018;267(6):1069–1076. [DOI] [PubMed] [Google Scholar]
- 21.Shafi S, Aboutanos MB, Agarwal S, et al. Emergency general surgery: Definition and estimated burden of disease. J Trauma Acute Care Surg 2013;74(4):1092–1097. [DOI] [PubMed] [Google Scholar]
- 22.Kelz RR, Niknam BA, Sellers MM, et al. Duty hour reform and the outcomes of patients treated by new surgeons. Ann Surg 2020;271(4):599–605. [DOI] [PMC free article] [PubMed] [Google Scholar]
- 23.Pope GC, Kautter J, Ellis RP, et al. Risk adjustment of medicare capitation payments using the CMS-HCC model. Health Care Financ Rev 2004;25(4):119–141. [PMC free article] [PubMed] [Google Scholar]
- 24.Chronic Conditions Warehouse. Chronic condition warehouse user guide: medicare risk score files.version 1.1. Available at: https://www2.ccwdata.org/documents/10280/19002246/ccw-medicare-risk-score-user-guide.pdf. Accessed April 11, 2022.
- 25.Medicode (firm). ICD-9-CM: International classification of diseases, 9th revision, clinical modification. Salt Lake City, Utah: Medicode; 1996. [Google Scholar]
- 26.American Medical Association. ICD-10-CM 2017: The complete official code book. Chicago, IL: American Medical Association; 2016. [Google Scholar]
- 27.Health Alliance. RxHCC model. Available at: https://provider.healthalliance.org/coding-counts-post/rxhcc-model/. Accessed April 11, 2022.
- 28.Iwashyna TJ, Odden A, Rohde J, et al. Identifying patients with severe sepsis using administrative claims: Patient-level validation of the angus implementation of the international consensus conference definition of severe sepsis. Med Care 2014;52(6):39. [DOI] [PMC free article] [PubMed] [Google Scholar]
- 29.Kim DH, Schneeweiss S, Glynn RJ, et al. Measuring frailty in medicare data: Development and validation of a claims-based frailty index. J Gerontol A Biol Sci Med Sci 2018;73(7):980–987. [DOI] [PMC free article] [PubMed] [Google Scholar]
- 30.Vatcheva KP, Lee M, McCormick JB, Rahbar MH. Multicollinearity in regression analyses conducted in epidemiologic studies. Epidemiology (Sunnyvale) 2016;6(2). [DOI] [PMC free article] [PubMed] [Google Scholar]
- 31.Kutner M, Nachtsheim C, Neter J. Applied linear statistical models. 4th ed. Irwin: McGraw-Hill; 2004. [Google Scholar]
- 32.US Bureau of Labor Statistics. CPI for all urban consumers. Available at: https://data.bls.gov/timeseries/CUUR0000SAM?output_view=data. Accessed 4/21/22,.
- 33.Bland JM, Altman DG. Survival probabilities (the kaplan-meier method). BMJ. 1998;317(7172):1572–1580. https://www.ncbi.nlm.nih.gov/pmc/articles/PMC1114388/. Accessed April 11, 2022. [DOI] [PMC free article] [PubMed] [Google Scholar]
- 34.STROBE. Checklists – STROBE. Available at: https://www.strobe-statement.org/checklists/ Web site. https://www.strobe-statement.org/checklists/. Accessed Sep 8, 2021.
- 35.The Academy of Medical Sciences Working Group. Multimorbidity: A priority for global health research. The Academy of Medical Sciences 2018:1–127. [Google Scholar]
- 36.Salive ME, Suls J, Farhat T, Klabunde CN. National institutes of health advancing multimorbidity research. Medical Care 2021;59(7). [DOI] [PMC free article] [PubMed] [Google Scholar]
- 37.Muth C, Beyer M, Fortin M, et al. Multimorbidity’s research challenges and priorities from a clinical perspective: The case of ‘Mr curran’. Eur J Gen Pract 2014;20:139–147. [DOI] [PubMed] [Google Scholar]
- 38.Campbell-Scherer D Multimorbidity: A challenge for evidence-based medicine. BMJ Evidence-Based Medicine 2010;15:165–166. [DOI] [PubMed] [Google Scholar]
- 39.Suls J, Bayliss EA, Berry J, et al. Measuring multimorbidity selecting the right instrument for the purpose and the data source. Medical Care 2021;59:743–756. [DOI] [PMC free article] [PubMed] [Google Scholar]
- 40.Salive ME. Multimorbidity in older adults. Epidemiol Rev 2013;35:75–83. [DOI] [PubMed] [Google Scholar]
- 41.King DE, Xiang J, Pilkerton CS. Multimorbidity trends in united states adults, 1988–2014. The Journal of the American Board of Family Medicine 2018;31(4). [DOI] [PMC free article] [PubMed] [Google Scholar]
- 42.Ho VP, Bensken WP, Warner DF, et al. Association of complex multimorbidity and long-term survival after emergency general surgery in older patients with medicare. JAMA Surgery 2022;e220811. [DOI] [PMC free article] [PubMed] [Google Scholar]
- 43.Massarweh NN, Legner VJ, Symons RG, et al. Impact of advancing age on abdominal surgical outcomes. Archives of surgery (Chicago, Ill. : 1960). 2009;144(12):1108–14. [DOI] [PubMed] [Google Scholar]
- 44.Cooper Z, Mitchell SL, Gorges RJ, et al. Predictors of mortality up to 1 year after emergency major abdominal surgery in older adults. J Am Geriatr Soc 2015;63(12):2572–2579. [DOI] [PMC free article] [PubMed] [Google Scholar]
- 45.Duron J, Duron E, Dugue T, et al. Risk factors for mortality in major digestive surgery in the elderly: A multicenter prospective study. Ann Surg 2011;254(2):375–382. [DOI] [PubMed] [Google Scholar]
- 46.Turrentine FE, Wang H, Simpson VB, Jones RS. Surgical risk factors, morbidity, and mortality in elderly patients. J Am Coll Surg 2006;203(6):865–877. [DOI] [PubMed] [Google Scholar]
- 47.Faurot KR, Funk MJ, Pate V, et al. Using claims data to predict dependency in activities of daily living as a proxy for frailty. Pharmacoepidemiol Drug Saf 2015;24(1):59–66. [DOI] [PMC free article] [PubMed] [Google Scholar]
- 48.Salminen P, Paajanen H, Rautio T, et al. Antibiotic therapy vs appendectomy for treatment of uncomplicated acute appendicitis: The APPAC randomized clinical trial. JAMA 2015;313(23). [DOI] [PubMed] [Google Scholar]
- 49.Sceats LA, Trickey AW, Morris AM, et al. Nonoperative management of uncomplicated appendicitis among privately insured patients. JAMA Surgery 2019;154(2):141. [DOI] [PMC free article] [PubMed] [Google Scholar]
- 50.Garfinkle R, Almalki T, Pelsser V, et al. Conditional risk of diverticulitis after non-operative management. The British journal of surgery 2020;107(13). [DOI] [PubMed] [Google Scholar]
- 51.Long B, Robertson J, Koyfman A. Emergency medicine evaluation and management of small bowel obstruction: Evidence-based recommendations. The Journal of Emergency Medicine 2019;56(2). [DOI] [PubMed] [Google Scholar]
- 52.McGuillicuddy EA, Schuster KM, Barre K, et al. Non-operative management of acute cholecystitis in the elderly. The British Journal of Surgery 2012;99(9). [DOI] [PubMed] [Google Scholar]
Associated Data
This section collects any data citations, data availability statements, or supplementary materials included in this article.