Abstract
Coronary atherosclerosis results from the delicate interplay of genetic and exogenous risk factors, principally taking place in metabolic organs and the arterial wall. Here we show that 224 gene-regulatory coexpression networks (GRNs) identified by integrating genetic and clinical data from patients with (n = 600) and without (n = 250) coronary artery disease (CAD) with RNA-seq data from seven disease-relevant tissues in the Stockholm–Tartu Atherosclerosis Reverse Network Engineering Task (STARNET) study largely capture this delicate interplay, explaining >54% of CAD heritability. Within 89 cross-tissue GRNs associated with clinical severity of CAD, 374 endocrine factors facilitated inter-organ interactions, primarily along an axis from adipose tissue to the liver (n = 152). This axis was independently replicated in genetically diverse mouse strains and by injection of recombinant forms of adipose endocrine factors (EPDR1, FCN2, FSTL3 and LBP) that markedly altered blood lipid and glucose levels in mice. Altogether, the STARNET database and the associated GRN browser (http://starnet.mssm.edu) provide a multiorgan framework for exploration of the molecular interplay between cardiometabolic disorders and CAD.
Myocardial infarction and stroke, the leading causes of global morbidity and mortality, are caused by atherosclerosis, which originates from inflammatory, lipid, endocrine, metabolic and hemodynamic disturbances. Indeed, multiple and parallel malfunctions in metabolic organs are responsible for the complex molecular disease processes of cardiometabolic disorders (CMDs) leading to CAD1. For example, the liver plays a central role in determining plasma lipid levels by regulating lipoprotein synthesis and lipoprotein remnant uptake, whereas adipose tissues and skeletal muscle (SKLM) facilitate lipolysis. Similarly, blood glucose levels depend on a delicate interplay of hepatic glucose production, insulin production in pancreatic beta cells and insulin sensitivity in peripheral glycolytic tissues. Alterations in lipid or glucose metabolism may lead to obesity, which in turn may promote the development of type 2 diabetes mellitus, hypertension, systemic inflammation2,3 and, eventually, CAD.
Thus far, the role of these and other risk factors in causing the initiation and progression of CAD have typically only been considered in isolated pathways. A systemic view4–7 of the combined high-dimensional, multiorgan metabolic processes that perturb the biology of the arterial wall has, however, not been described. Systems studies based on integrative analyses of DNA and RNA sequencing (RNA-seq) data, unlike studies focusing on DNA alone, such as genome-wide association studies (GWAS), hold promise to go beyond studies of individual genetic risk loci and candidate genes in isolated pathways by capturing the combined impact of exogenous and genetic risk factors8–10. To achieve this, RNA-seq data are typically first used to infer gene coexpression modules5, which capture pathophysiological biological processes and molecular functions, and their associations with clinical phenotypes. Next, by using Bayesian probabilistic4 or other forms11 of network modeling methods that consider prior causal information inherent in coexpression modules such as gene expression-regulatory single-nucleotide polymorphisms (‘eSNPs’)12 and transcription factors, the directionality of gene–gene interactions in coexpression modules can be assessed13, effectively transforming them into GRNs. The directionality information of gene–gene interactions in these GRNs is essential, primarily because it allows identification of key driver genes14,15. These key driver genes, which tend to be located at the top of the GRN hierarchy, regulate many downstream genes in the GRN. Indeed, perturbation experiments of key driver genes using in vivo model systems has demonstrated their efficacy in modulating the gene activity of entire GRNs as well as downstream phenotypes16, including CAD15,17. This latter characteristic has prompted the term ‘key disease driver’14,15,18.
A prerequisite to obtain disease-relevant gene expression data for the subsequent inference of GRNs and their key drivers5 is high-quality RNA-seq data, ideally obtained under strictly standardized conditions from multiple metabolic tissues and the arterial wall in living humans. Here, by integrating DNA genotype data with transcriptomic profiles obtained from seven tissues isolated from 600 individuals with CAD and 250 CAD-free controls during open-heart surgery in the STARNET study19, we inferred 224 coexpression modules and, from each of these modules, GRNs and key drivers (Fig. 1). After validation using independent human and mouse RNA-seq datasets, GRNs and underlying modules were carefully characterized by gene ontology (GO), CMD and CAD phenotype associations and, after integrative analysis with GWAS data, contributions to CAD heritability. In this analysis, GRNs with gene nodes representing gene expression from different tissues (that is, ‘cross-tissue GRNs’) were found to be more relevant for CAD than GRNs with gene nodes representing gene expression within a single tissue (‘tissue-specific GRNs’). Further analysis suggested that an underlying mechanism for gene–gene interactions across tissue borders, represented by these cross-tissue GRNs, was at least in part explained by endocrine signaling between metabolic tissues and the arterial wall, particularly along an axis from adipose tissue to the liver. Experimental validation of this adipose–liver signaling axis was successfully performed by injection of recombinant forms of key endocrine factors in mice. Importantly, we also provide a web-based browser (http://starnet.mssm.edu/) in which SNPs, individual genes or groups of genes can be broadly queried by the research community to further understand their roles in CMDs and CAD from the perspective of GRNs.
Fig. 1 |. Schematic overview of study flow, including main data-analysis steps, result summary and conclusions.
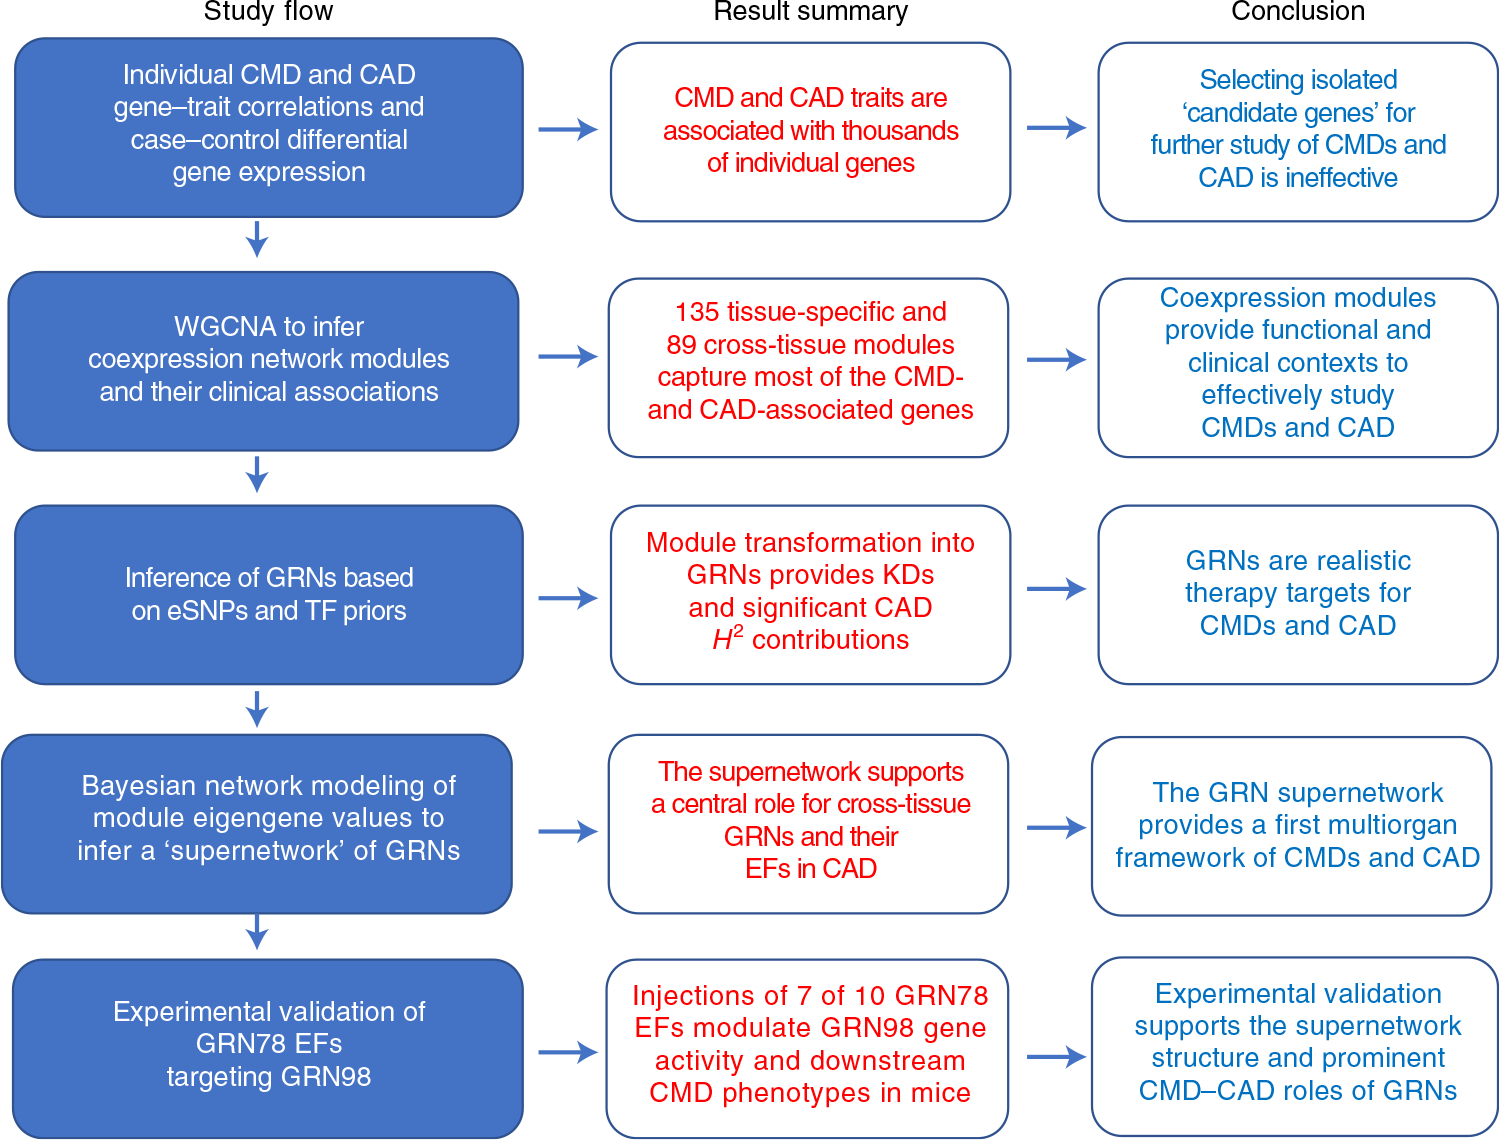
TFs, transcriptions factors; GRN78, cross-tissue GRN78 identified in the STARNET study; GRN98, liver-specific GRN98 identified in the STARNET study; EF, endocrine factor; KDs, key disease drivers; H2, broad-sense heritability contribution.
Results
Coexpression gene network modules provide functional contexts to CMD- and CAD-associated genes.
The STARNET study (Supplementary Table 1) is the largest transcriptomic study of blood, arterial wall and metabolic organs19, now also including unique CAD-free controls. Samples were obtained with informed consent during coronary artery bypass grafting (CABG) (individuals with CAD) or other forms of open-heart surgery (‘controls’ (mostly aortic valve replacement)) from well-characterized patients19 (Fig. 2a). To understand how STARNET data align with our current understanding of CMDs and CAD candidate genes, we first examined individual genes both within individuals with CAD for genome-wide significant correlations with CMD and CAD phenotypes (n = 500–600 samples per tissue) and for their differential expression between individuals with CAD and age-, sex- and body mass index (BMI)-matched, CAD-free controls (Methods). In individuals with CAD, the number of genes that correlated with CAD-severity scores (that is, SYNTAX (Synergy between Percutaneous Coronary Intervention with Taxus and Cardiac Surgery) and Duke scores) were few, whereas correlations with other CMD traits were numerous and in part previously described19 (false discovery rate (FDR) < 0.01; Fig. 2b). Strikingly, however, even when strictly defined (>30% change in expression levels and an FDR <1%), the number of tissue-specific genes that were differentially expressed between individuals with CAD and CAD-free controls was substantial (Fig. 2c and Extended Data Figs. 1–3). For instance, in RNA-seq data comparing the atherosclerotic aortic arterial wall (AOR) of individuals with CAD with the healthy aortic wall of controls, coding genes were equally upregulated and downregulated (n = 1,727 and 1,652, respectively), whereas noncoding genes were predominantly upregulated (n = 9,047 and 560). By contrast and unexpectedly, in the liver (LIV), both coding (n = 436 and 1,555) and noncoding (n = 111 and 4,480) genes were predominately downregulated in individuals with CAD. Similarly, noncoding genes were also markedly downregulated in individuals with CAD in visceral abdominal fat (VAF), subcutaneous fat (SF) and SKLM (Fig. 2c). Multivariable adjustments also including metabolic phenotypes, drug treatments and genotypes did not markedly change patterns of differentially expressed genes (DEGs) between individuals with CAD and CAD-free controls (Extended Data Fig. 2).
Fig. 2 |. Cross-tissue and tissue-specific coexpression network modules capture phenotypic variation associated with CMD and CAD traits.
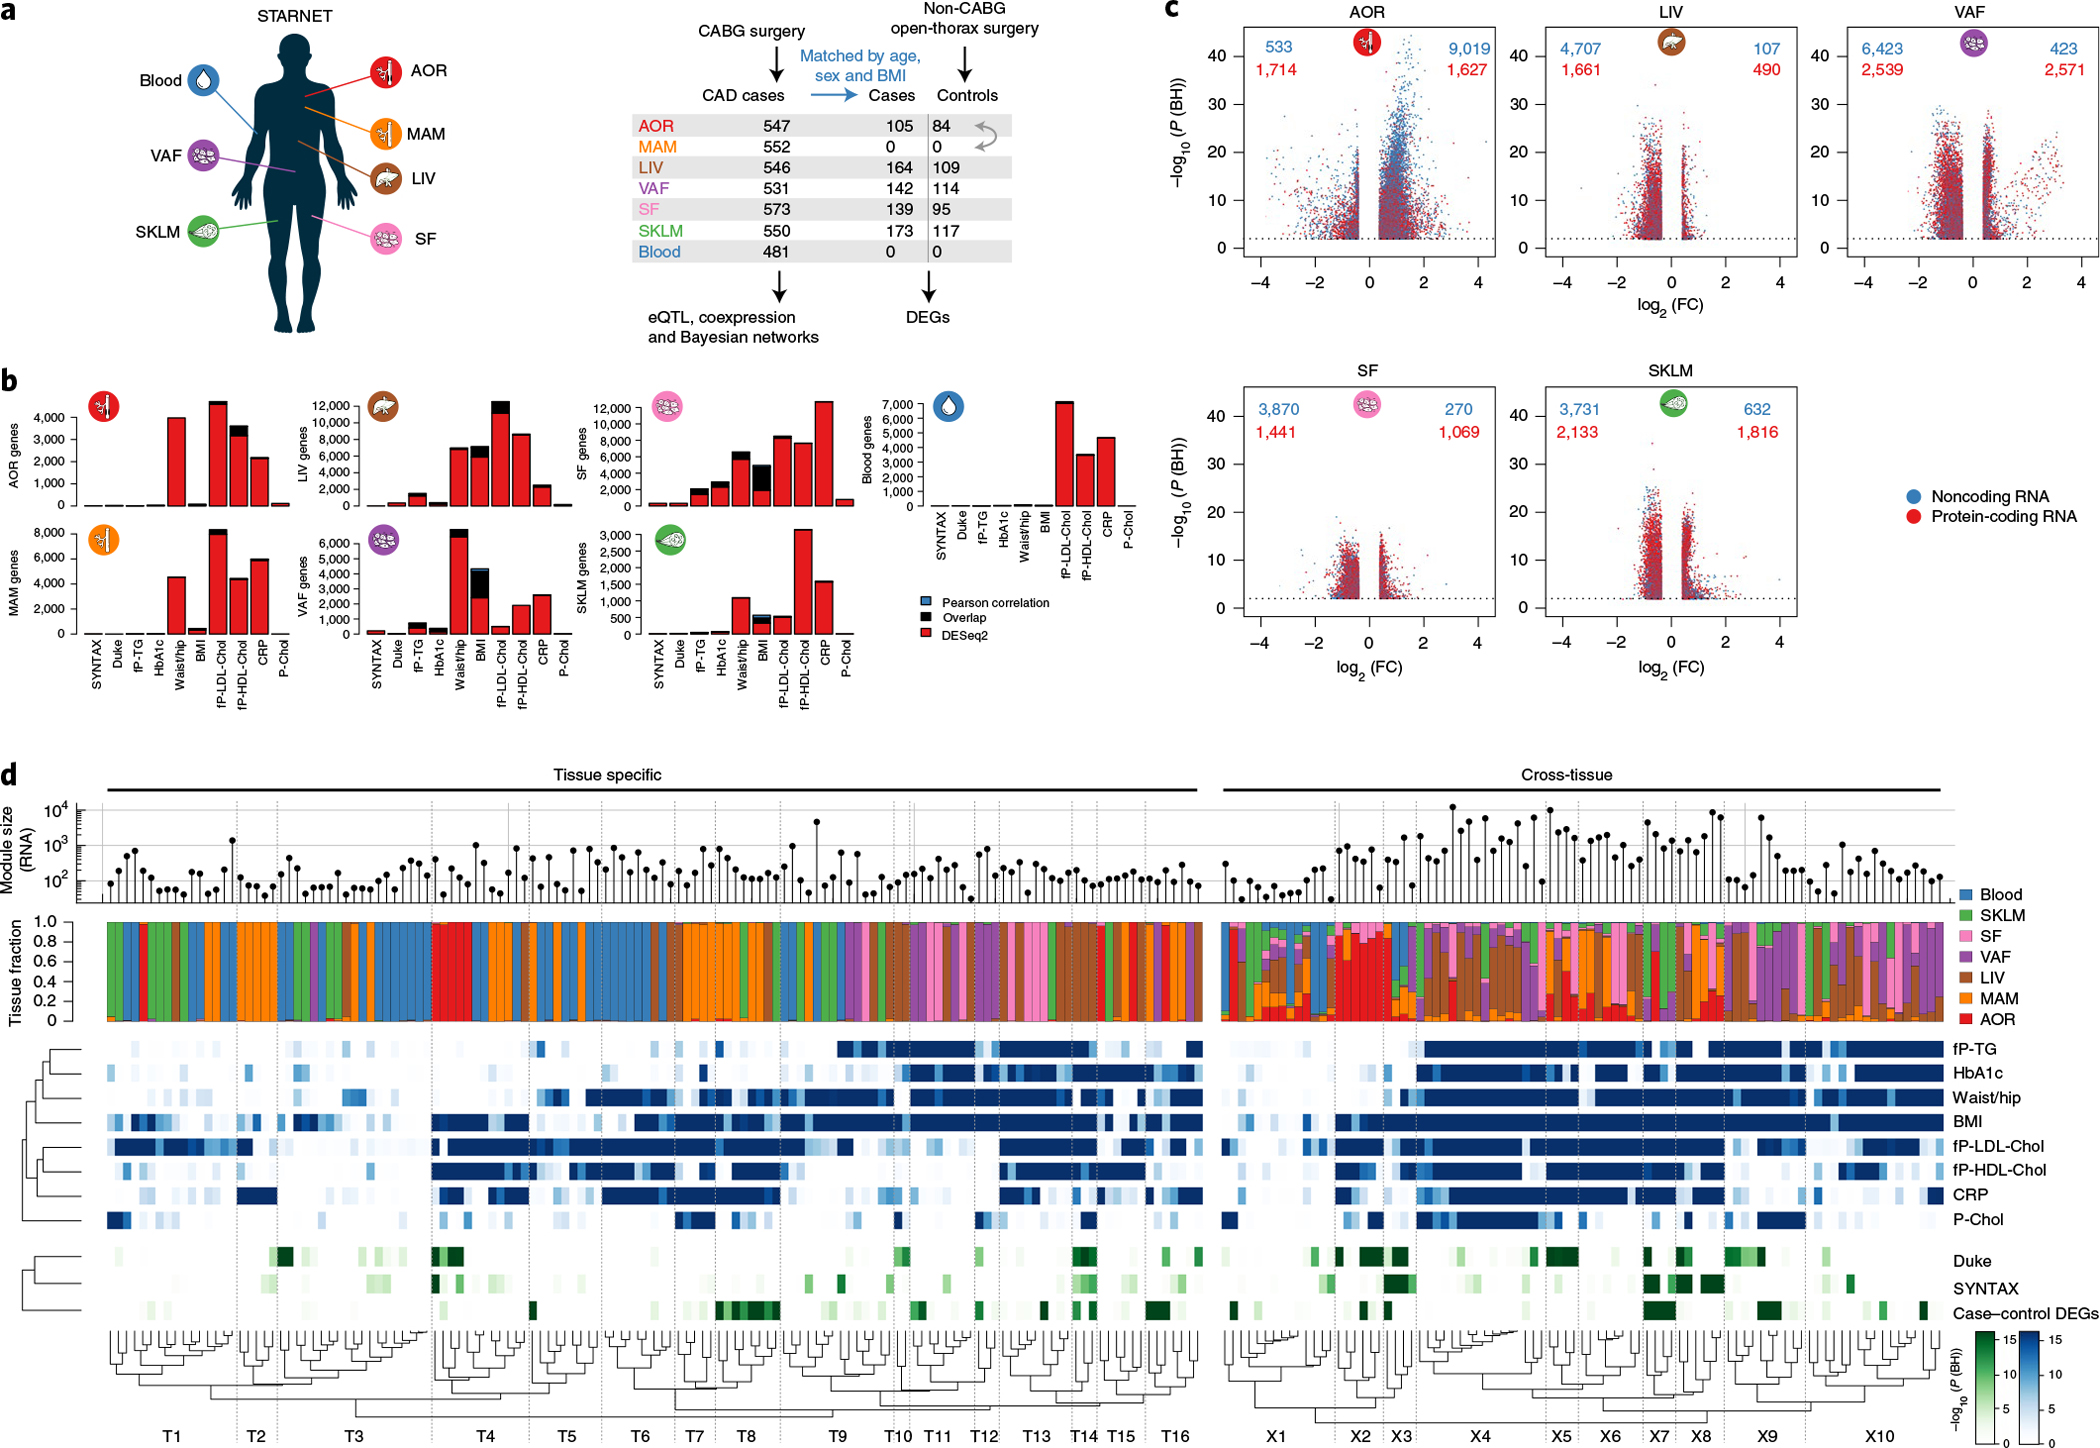
a, Left, multi-tissue sampling in the STARNET study. Right, sample sizes and study design for generation and analysis of RNA-seq data from individuals with obstructive CAD and controls without obstructive CAD, verified by pre-operative coronary angiographs. Numbers of DEGs in each tissue were calculated from resequenced and randomized RNA samples isolated from individuals with CAD matched to controls by age, sex and BMI. The extent or absence of CAD was determined from pre-operative coronary angiograms and assessed by SYNTAX59 and Duke60 scores. b, Bar plots showing the number of genes associated with CMD and/or CAD traits either assessed with DESeq2, adjusting for age and sex (FDR < 0.01), or Pearson correlation with normalized gene expression (|r| > 0.2), which corresponds to Bonferroni correction at FDR < 0.14 (two-sample Student’s test, n = 500 patients and 21,500 genes). CRP, C-reactive protein; fP-Chol, fasting plasma total cholesterol levels; fP-LDL-Chol, fasting plasma LDL cholesterol levels; fP-HDL-Chol, fasting plasma high-density lipoprotein (HDL) cholesterol levels; fP-TG, fasting plasma triglyceride levels; P-Chol, plasma cholesterol levels. c, Volcano plots showing coding (red) and noncoding (blue) DEGs, comparing tissue samples from individuals with CAD and CAD-free controls (FDR < 0.01 and ±30% fold change). DESeq2 two-tailed statistics adjusted for multiple hypotheses with the Benjamini–Hochberg (BH) method. FC, fold change. d, Hierarchical clustering of 135 tissue-specific (left) and 89 cross-tissue (right) coexpression network modules. Modules were inferred from gene expression across all tissues in up to 572 individuals with CAD in the STARNET study followed by blockwise, weighted WGCNA with distinct β values for cross-tissue and tissue-specific correlations to achieve scale-free networks38. Modules containing >5% of transcripts from more than one tissue were defined as cross-tissue. Modules were annotated and clustered by tissue composition (multicolor), module enrichment in genes associated with metabolic phenotypes (blue) and with three CAD measures (green): module enrichments of DEGs from case–control tissues (hypergeometric test) and module meta-analysis of genes associated with SYNTAX and Duke scores. Enrichment for SYNTAX and Duke scores, along with metabolic phenotypes, were assessed by aggregate gene-level P values (Fisher’s method) based on Pearson correlation two-tailed t-tests. Multiple hypotheses for the 224 modules tested were adjusted separately for each association type using the Benjamini–Hochberg method.
While the role of noncoding genes remains largely unexplored in CMD and CAD pathophysiology, results from GO enrichment analyses of coding genes differentially expressed in individuals with CAD were generally in accordance with our current understanding of the interplay between metabolic disturbances and CAD (Fisher’s exact test, FDR < 5%; Supplementary Table 2). For instance, coding genes upregulated in the AOR of individuals with CAD were enriched in ‘plasma lipoprotein particle remodeling’ (16 of 28 genes, 7.12 fold, FDR = 9.62 × 10⁻⁶) and ‘regulation of blood coagulation’ (29 of 78 genes, 4.63 fold, FDR = 2.46 × 10⁻⁷), whereas downregulated genes in AOR samples from individuals with CAD were enriched in ‘negative regulation of glucose transmembrane transport’ (eight of 20 genes, 5.07 fold, FDR = 0.0229) and, less expectedly, ‘SRP-dependent co-translational protein targeting to membrane’ (33 of 99 genes, 7.34 fold, FDR = 2.41 × 10⁻⁸). In the liver, upregulated genes in individuals with CAD were enriched in ‘cholesterol biosynthesis’ (19 of 42 genes, 21.4 fold, FDR = 1.14 × 10⁻¹⁴) and ‘steroid metabolism’ (39 of 255 genes, 7.25 fold, FDR = 1.05 × 10⁻¹⁶), while downregulated genes were enriched in ‘cell–cell adhesion’ (75 of 448 genes, 2.33 fold, FDR = 8.01 × 10⁻⁷). Of note, upregulated genes in VAF of individuals with CAD were significantly enriched in ‘leukocyte activation’ (174 of 882 genes, 1.61 fold, FDR = 5.47 × 10⁻⁶) and downregulated genes in VAF were enriched in ‘regulation of secretory pathways’ (32 of 123 genes, 2.29 fold, FDR = 0.0161). In SF and SKLM, upregulated genes were enriched in, respectively, ‘presentation of exogenous antigen’ (34 of 181 genes, 4.1 fold, FDR = 9.83 × 10⁻⁸) and ‘assembly of the mitochondrial respiratory chain complex’ (26 of 106 genes, 3.09 fold, FDR = 7.12 × 10⁻⁴).
The large number of genes that exhibited CMD associations in individuals with CAD and were differentially expressed between individuals with CAD and CAD-free controls in the STARNET study clearly demonstrate that selecting genes individually or in pre-assembled groups to study CMDs and CAD is inadequate to capture the complexity of biological variation inherent in these disorders (Figs. 1 and 2). Instead, we argued, these genes can only be fully appreciated if studied in broader functional contexts, such as in gene network structures5. To further test this hypothesis, we first applied blockwise, weighted gene coexpression network analysis (WGCNA, Methods) to STARNET RNA-seq data (Extended Data Fig. 4). Across the seven tissues, we identified 135 coexpression network modules active within a single tissue (‘tissue-specific modules’) and 89 modules also linking gene activity across tissue borders (‘cross-tissue modules’) (Fig. 2d and Extended Data Figs. 5 and 6)20. To assess the reproducibility of these coexpression modules in independent data from corresponding tissues, we queried Gene–Tissue Expression (GTEx) datasets14, excluding from this replication the 33 STARNET modules obtained from the mammary artery (MAM), as this tissue is absent in the GTEx database. By comparing the concordance of pairwise gene correlations in each STARNET network module with corresponding gene pairs in the GTEx database, we replicated 103 of 106 tissue-specific (97%) and 63 of 88 cross-tissue (72%) STARNET network coexpression modules (Extended Data Fig. 7a,b). These results were also largely reconfirmed with four nonlinear permutation tests of network preservation (NetRep21; Extended Data Fig. 7c,d).
By applying gene enrichment analysis (Methods), the 224 coexpression modules were found to be strongly associated with CMD phenotypes (Fig. 2d, blue), CAD-severity scores and differentially expressed genes in CAD (Fig. 2d, green, and Extended Data Fig. 7e,f). Thus, coherent and reproducible coexpression modules active within and across metabolic tissues and the arterial wall in the STARNET database provide functional and pathophysiological contexts to study the numerous individual genes associated with CMDs and CAD.
GRN inference reveals significant contributions to CAD heritability.
Gene–gene interactions representing the core of coexpression modules lack information about directions (for example, in pairwise comparison (that is, gene A–gene B), it is unknown whether gene A regulates gene B or whether gene B regulates gene A). Therefore, we added a ‘gene-regulatory aspect’ to the 224 coexpression network modules. To achieve this, we applied the established random forest-based regression software GENIE3 (refs. 22,23), which takes into account the overall module gene–gene interaction structure and treats transcription factors and genes regulated by SNPs (that is, eSNPs) as likely regulators of other module genes lacking these characteristics (so-called regulatory priors9). In essence, in this fashion, the 224 coexpression modules were transformed into 224 GRNs.
By incorporating regulatory eSNPs, contributions of GRNs to broad-sense heritability (H2) are assessable by integrative analysis with GWAS. Recently, using the restricted maximum-likelihood (REML) method in a meta-analysis with nine GWAS studies24, we showed that eSNPs from GRNs inferred from the pilot study of STARNET, the STAGE study9,25, contribute substantially (~11%) to CAD H2 beyond the ~22% contribution of lead SNPs identified previously by GWAS26,24. Applying the same strategy, the CAD H2 contribution of eSNPs in individual as well as in combined sets of the 224 STARNET GRNs identified in the current study were determined. For the combined genetic regulation of all 224 GRNs, represented by 41,586 independent eSNPs (Supplementary Table 3), the total contribution to CAD H2 was 59.8% (Fig. 3a). Applying an alternative method (mediated expression score regression)27 to assess the combined CAD heritability contribution of the 224 GRNs resulted in a slightly lower H2 contribution of 54.3% (Supplementary Table 3). While the size (that is, the number of network genes and, thus, eSNPs) of a GRN was the main determinant of its H2 contribution (Fig. 3b), H2 contributions of individual eSNPs and GRNs varied substantially (Fig. 3c,d). Furthermore, although lead SNPs from CAD GWAS hits were excluded from the REML analysis, 932 of 1,037 proposed target genes for CMD and CAD GWAS hits28 were still present at least once in 206 of the 224 GRNs (Supplementary Table 4), and many of the GRNs were significantly enriched in several of these GWAS target genes (Fig. 3e). Furthermore, according to a GWAS24, the average H2 contribution of 302 CAD lead SNPs ranges from 0.03% to 0.07% per SNP, while, in our study, H2 contributions of individual GRNs were frequently observed to be above 1% (Fig. 3c and Supplementary Table 3). Thus, GRNs with multiple interacting genes (and their eSNPs) implicate broader functional aspects relevant to the heritability of CAD beyond GWAS hits. Notably, for each of these REML H2 estimates, individual (e)SNPs were considered only once, although the same SNP may regulate several genes and thus appear in more than one GRN (Methods).
Fig. 3 |. Major heritability contributions of GRNs.
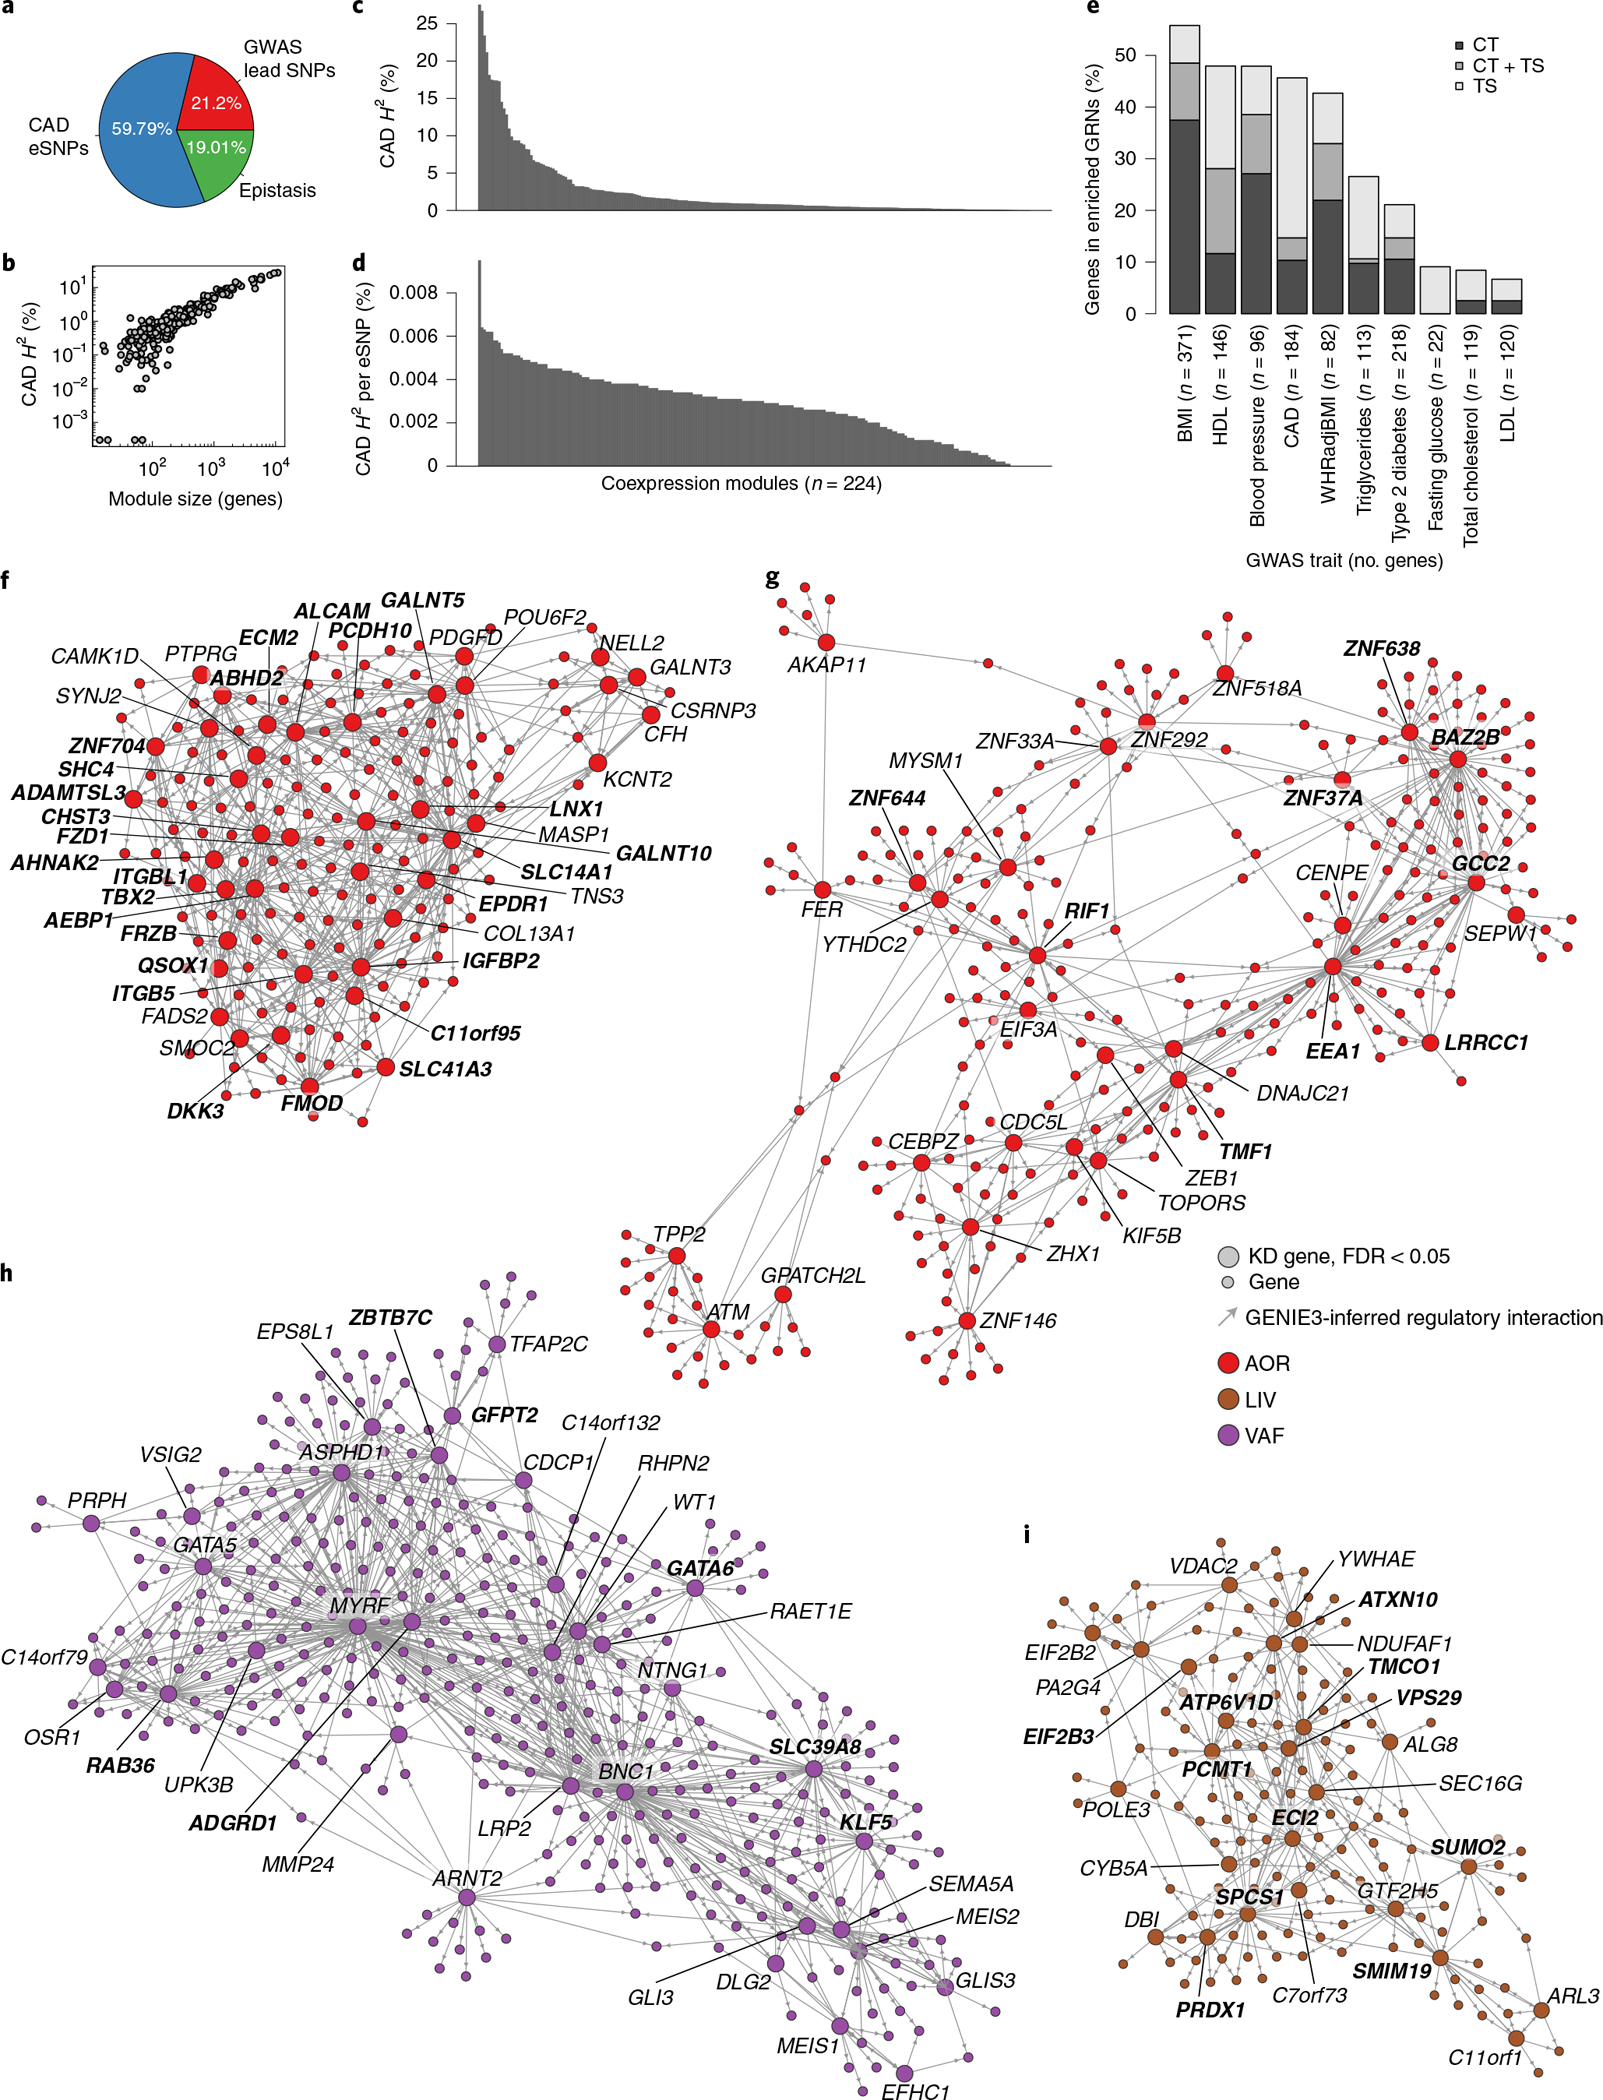
a, Pie chart showing portions of broad-sense heritability (H2) of CAD explained by lead SNPs identified in a GWAS24, by eSNPs in GRNs identified in the current study and the missing part, postulated to comprise epistasis61. b, Scatterplot of average H2 contributions in relation to coexpression module size (number of genes in each GRN). c, Bar plot showing CAD heritability contributions (H2) of each of the 224 modules. Each module represents one GRN; H2 contributions of SNPs affecting gene expression (eSNPs) in each GRN were calculated by using the REML method after excluding all SNPs in linkage disequilibrium (r2 > 0.2) with known CAD lead SNPs identified by GWAS (Supplementary Table 3). d, Bar plot showing the average CAD H2 contribution per eSNP of each of the 224 modules. Each module represents one GRN (Supplementary Table 3). e, Bar plot showing the fraction (percent) of CMD and CAD GWAS genes27 found in significantly enriched tissue-specific (TS) and cross-tissue (CT) GRNs (hypergeometric test, FDR < 0.1, 71 networks in total). WHRadjBMI, waist/hip ratio-adjusted BMI. f, The arterial wall-specific GRN39 (http://starnet.mssm.edu/module/39, see also tutorial in Extended Data Fig. 8, n = 182 genes) contributes to 1.79% of CAD H2, contains seven eQTL of six lead SNPs identified by GWAS of CAD24 (rs7500448,CDH13; rs2839812, PDGFD; rs421329, PPP1R3G; rs2083460, ABHD2; rs11257613, CAMK1D; rs2083460, MFGE8; rs28596486, HTRA1) and 26 top key drivers (in bold). GRN39 was found enriched in genes associated with the extent of coronary lesions according to SYNTAX score (P = 10−7), plasma levels of HbA1c (P = 10−27), plasma levels of HDL (P = 10−32) and LDL (P = 10−34) and cholesterol levels and BMI (P < 10−100) and, according to GO analysis, is involved in ‘extracellular matrix organization’ (GO:0030198, FDR = 1.04 × 10⁻³³). The official NCBI Gene symbol for C11orf95 is ZFTA. g, The cross-tissue (AOR, 84%; SF, 15%) GRN165 (http://starnet.mssm.edu/module/165, n = 709 genes) contributes to 4.1% of CAD H2 and contains nine top key drivers (in bold). GRN165 is enriched in genes associated with plasma levels of high-sensitivity CRP (hCRP) (P = 10−25), the extent of coronary lesions according to the angiographic Duke score (P = 10−56), BMI (P = 10−64) and plasma levels of LDL and HDL cholesterol (P < 10−100) and, according to GO analysis, is involved in ‘RNA processing’ (GO:0006396, FDR = 2.03 × 10−55). The official NCBI Gene symbol for SEPW1 is SELENOW. h, The visceral fat-specific GRN27 (http://starnet.mssm.edu/module/27, 553 genes) contributes to 3.24% of CAD H2 and contains seven top key drivers (in bold). GRN27 is enriched in genes associated with plasma levels of HbA1c (P = 10−5) and triglycerides (P = 10−8), the extent of coronary lesions according to the angiographic Duke score (P = 10−9), DEG CAD genes (P = 10−14), the total level of plasma cholesterol (P = 10−19), the waist/hip ratio (P = 10−42) and BMI (P < 10−100) and, according to GO analysis, is involved in ‘epithelium development’ (GO:0060429, FDR = 4.8901 × 10−36). The official NCBI Gene symbol for C14orf79 is CLBA1. i, The liver-specific GRN214 (http://starnet.mssm.edu/module/214, n = 229 genes) contributes to 2.25% of CAD H2 and contains 11 top-ranked key drivers (in bold). GRN214 is enriched in genes associated with the number of coronary lesions (P = 10−6), the total level of plasma cholesterol (P = 10−8), HbA1c levels (P = 10−9), the waist/hip ratio (P = 10−23), plasma triglyceride levels (P = 10−32), BMI (P = 10−94) and plasma levels of hCRP and HDL and LDL cholesterol (P < 10−100) and, according to GO, is involved in ‘mitochondrion organization’ (GO:0007005, FDR = 3.66 × 10−39). The official NCBI Gene symbol for C7orf73 is STMP1. In f–i, visualizations of GRNs are restricted to nodes (‘genes’) that are immediately downstream of key drivers. Top key drivers with equal rank are highlighted in bold. GO gene set enrichment was assessed by hypergeometric tests with Bonferroni adjustment. DEG CAD enrichment was assessed by hypergeometric test. Clinical phenotype enrichment was assessed by aggregate gene-level P values (Fisher’s method).
To highlight the usefulness of GRNs in offering a mechanistic framework to study CMDs and CAD more effectively, we developed software, the STARNET browser (http://starnet.mssm.edu), which is publicly available to the research community. To provide a tutorial example on how to use this browser, we queried the recently identified 302 lead SNPs identified by a recent GWAS of CAD24 (Extended Data Fig. 8). In response to this query, the STARNET browser first returns GRNs enriched by these lead SNPs. Among enriched GRNs, the arterial wall-specific GRN39 (http://starnet.mssm.edu/module/39, n = 182 genes) harboring seven CAD lead SNPs as expression quantitative trait loci (eQTL) (CDH3, PDGFD, PPP1R3G, ABHD2, CAMK1D, MFGE8 and HTRA1) is a prominent example (Fig. 3f). GRN39, with its top key driver IGFBP2, is associated with plasma low-density lipoprotein (LDL) cholesterol levels, the biological process of extracellular matrix organization (GO:0030198, P = 1.04 × 10⁻³³) and coronary lesion severity (that is, SYNTAX score). Although clinical associations lack directions, as GRN39 is active in the atherosclerotic arterial wall, a reasonable hypothesis is that the activity of this network is governed by levels of plasma LDL cholesterol, which in turn affect arterial wall organization of the extracellular matrix in a fashion that drives atherosclerosis (that is, SYNTAX score). Thus, instead of focusing on these lead SNPs and their target genes individually without biological contexts, GRN39 provides a mechanistic framework to study them jointly.
Another prominent GRN example with substantial CAD heritability contribution in relation to its size is GRN165, which offers original mechanisms affecting CAD and metabolic phenotypes (http://starnet.mssm.edu/module/165): GRN165 is a cross-tissue GRN with 709 genes and 30 key drivers active across the atherosclerotic arterial wall (86%) and SF (14%), explaining the significant fraction of 4.1% CAD heritability (Fig. 3g). The transcriptional regulator bromodomain adjacent to zinc finger domain 2B (BAZ2B) is the top driver of this GRN, and GO analysis revealed involvement in ‘RNA processing’ (GO:0006396, P = 2.03 × 10−55). Similar to GRN39, GRN165 was also found to be highly associated with levels of plasma LDL cholesterol as well as severity of CAD, in the form of Duke score.
The liver-specific GRN214 (http://starnet.mssm.edu/module/214) that contributes to 2.25% of CAD heritability and contains 26 key drivers with signal peptidase complex subunit 1 (SPCS1) as its top key driver (FDR = 2.5689 × 10−113) is another interesting example (Fig. 3h). Clinical associations of GRN214 suggest that it is important in regulating levels of plasma LDL and/or HDL cholesterol through mechanisms involving mitochondria. A prominent visceral fat example is GRN27 (http://starnet.mssm.edu/module/27) that contributes to 3.24% of CAD H2 and contains 553 genes, of which 35 were key drivers, with aspartate β-hydroxylase domain containing 1 (ASPHD1) as its top key driver (FDR = 3.9348 × 10−303) (Fig. 3i). Clinical associations with GRN27 suggest that it is implicated in type 2 diabetes mellitus, including traits such as BMI, waist/hip ratio and plasma levels of hemoglobin (Hb)A1c and triglycerides and interestingly also provides a link to the extent of coronary lesions according to Duke score (Fig. 3i).
GRNs are deemed causal in Mendelian randomization analyses.
To characterize GRNs further in terms of their CMD and/or CAD causality, Mendelian randomization (MR) analyses (Methods) were applied to the STARNET data (Supplementary Table 5). In brief, we examined the overlap of key drivers in tissue-specific GRNs with those of causal networks inferred in the MR analysis in each tissue. We found that ~50% of MAM and blood GRNs and ~67% of the AOR, LIV, SKLM, SF and VAF GRNs were enriched with causal key drivers (Extended Data Fig. 9). Next, by applying one-sample (using STARNET data only) and two-sample MR analyses (integrating STARNET data with GWAS; Methods), key drivers in 218 GRNs were identified as causal for cardiometabolic traits or CAD (P ≤ 0.001; Supplementary Table 6). In addition, 28 GRNs were enriched with several CMD- and/or CAD-causal key drivers according to MR (FDR < 10%, Benjamini–Hochberg test; Supplementary Table 6).
Cross-tissue GRNs play a critical role in the development of CAD.
By organizing the 224 GRNs according to their intra-organ and inter-organ interactions, an overall structure to the biological processes and molecular functions driving CMDs and CAD can be provided that may shed light on key GRNs for the development of CAD. To achieve this, we took advantage of the fact that the underlying gene content and architecture of the GRNs in our study is based on coexpression modules inferred by WGCNA. Like nodes (that is, genes) within individual coexpression modules are connected based on their coexpression (building edges) to form network modules (Fig. 2); modules have ‘eigengene values’ that are surrogate principal-component-like measures reflecting the overall module gene activity that can be used to link modules to each other or clinical phenotypes13,29. By applying Bayesian network modeling to the eigengene values of each of the 135 tissue-specific and 89 cross-tissue modules using a fast greedy equivalence search30, a ‘supernetwork’ representing the intra-organ and inter-organ organization of the 224 STARNET modules (and thus the 224 GRNs) was revealed (Fig. 4a and Extended Data Fig. 10a, http://starnet.mssm.edu). To assess the reliance of individual module–module connections in this supernetwork, ‘bootstrapping’ was applied, in which individual STARNET samples were randomly redrawn to create 1,000 eigengene datasets from which connections in the supernetwork were recalculated (Methods and Extended Data Fig. 10b,c). Of the 1,021 module–module interactions in this supernetwork deemed reliable in the bootstrapping analysis, 113 (11%) were inter-organ interactions that crossed tissue borders. Of these, 101 interactions were represented by the 89 cross-tissue modules; only 12 inter-organ interactions in the supernetwork were between two tissue-specific modules active in separate tissues (Extended Data Fig. 10d). This observation suggests that cross-tissue modules (and thus their corresponding cross-tissue GRNs) are important mediators of molecular interactions between metabolic tissues and the arterial wall in CMDs and CAD.
Fig. 4 |. A high-hierarchy network organization of GRNs reveals that topologically central cross-tissue networks are important for CAD development.
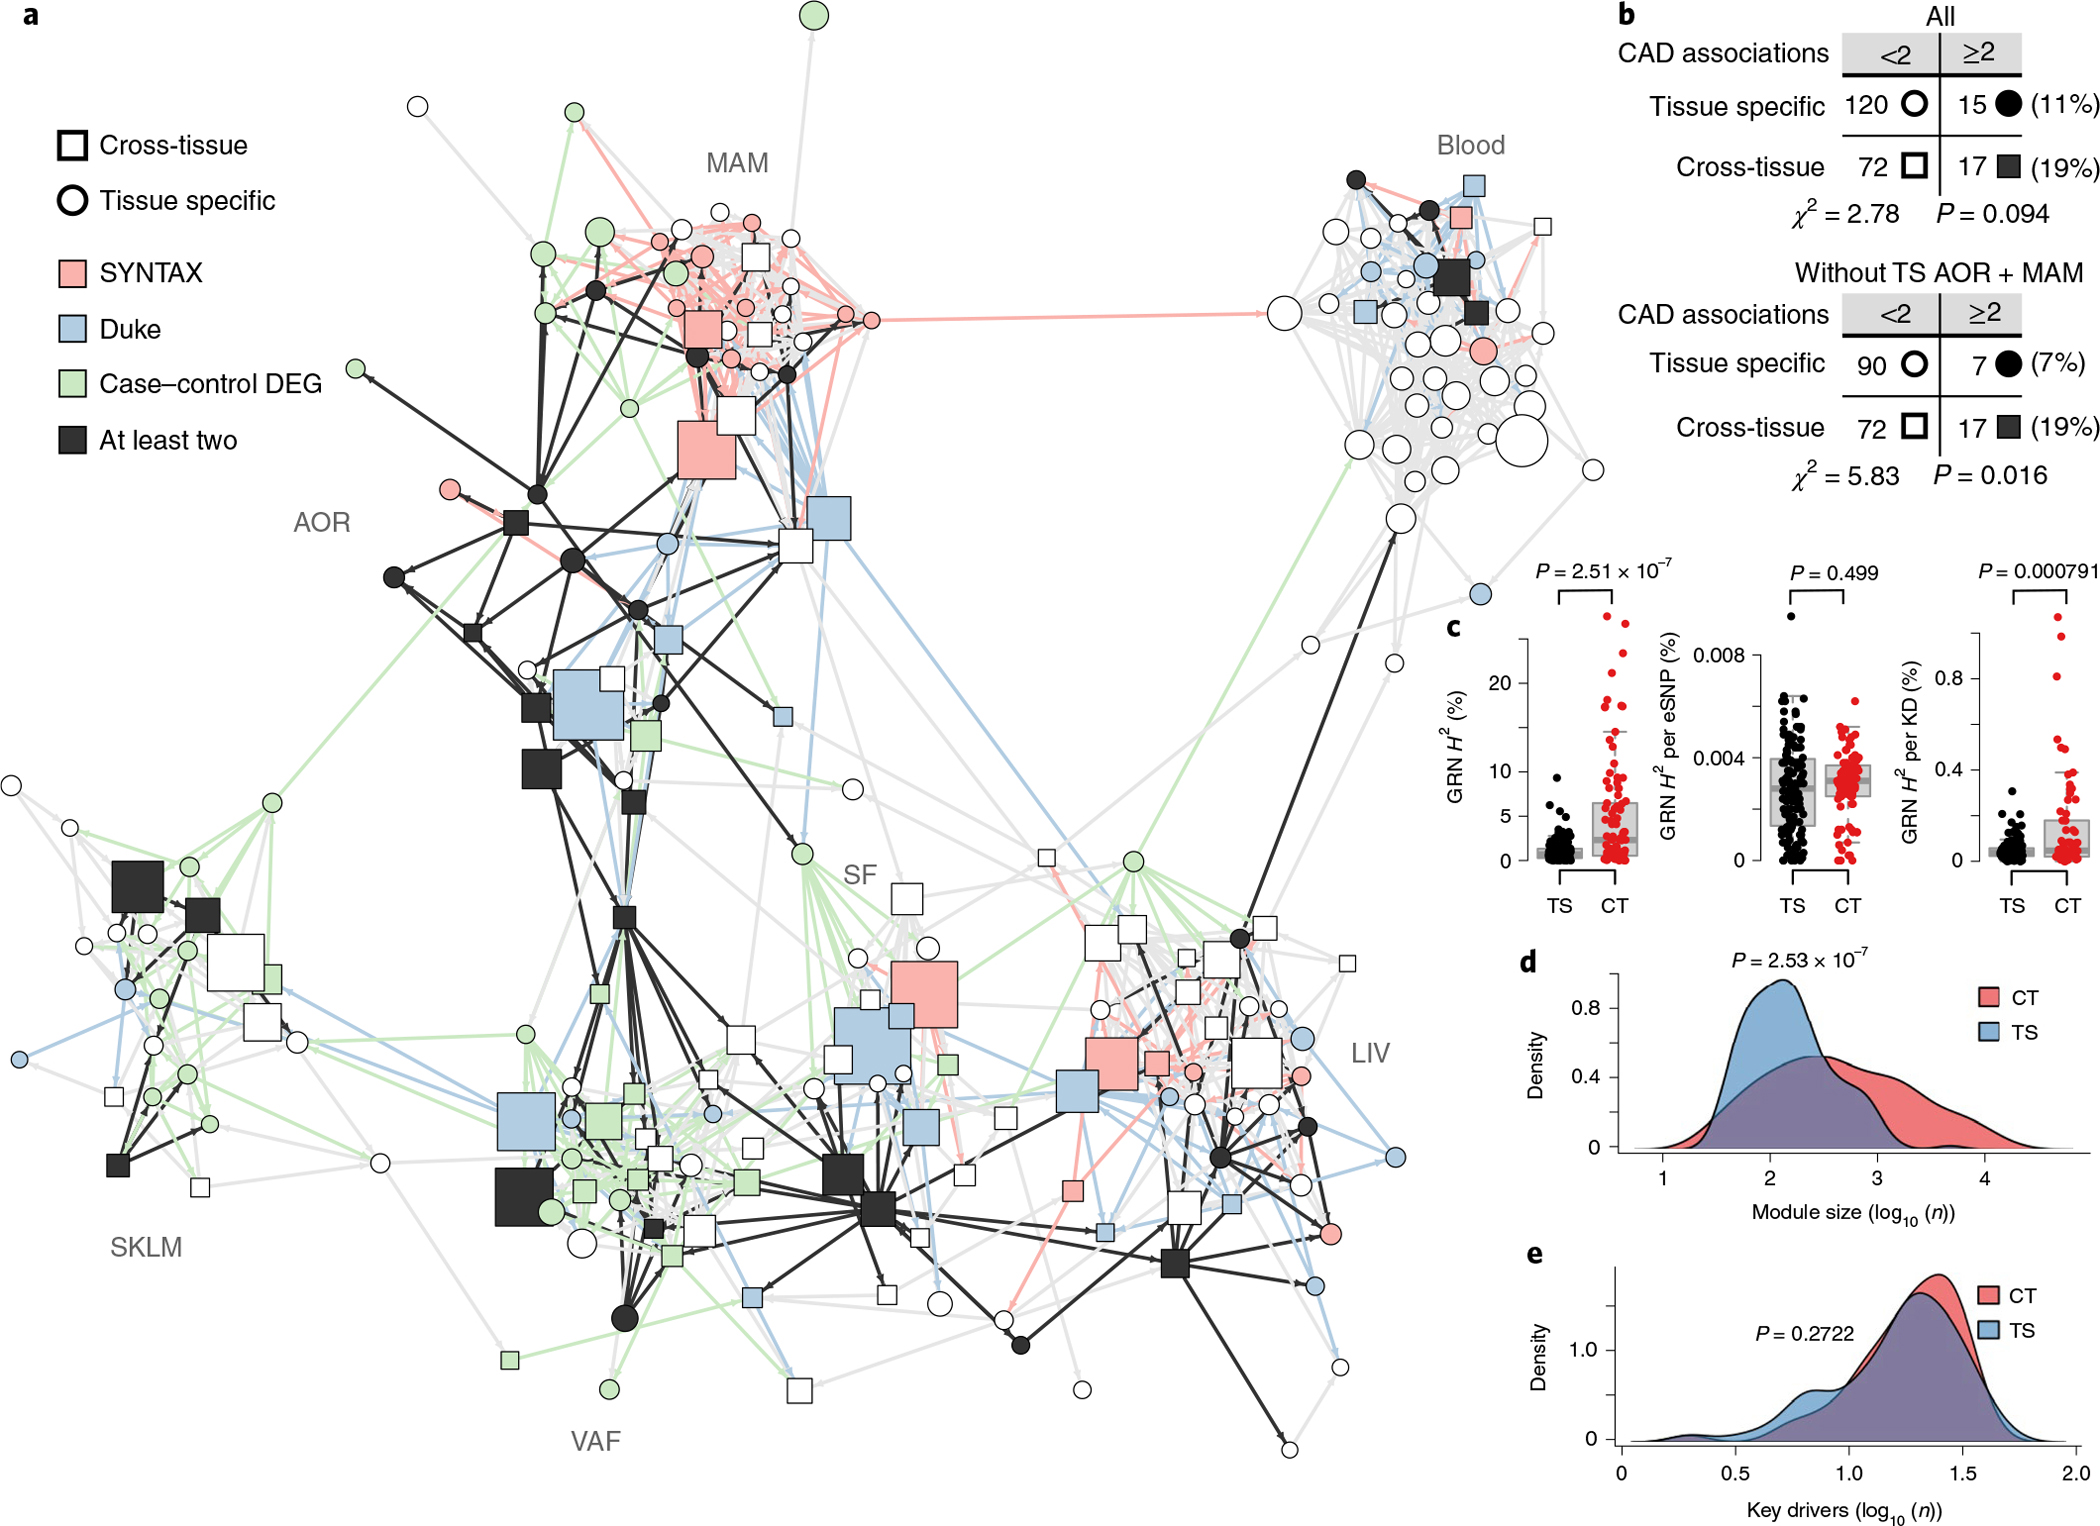
a, Diagram of a Bayesian directed high-hierarchy network (‘supernetwork’) inferred from eigengenes of the 224 GRNs over blood, metabolic and vascular tissues. The supernetwork layout was computed with the Fruchterman–Reingold algorithm, which largely clustered each GRN by its primary tissue (http://starnet.mssm.edu). Color coding of supernetwork nodes and outgoing edges indicates association with CAD measures (DEG enrichment and aggregate P values for SYNTAX and Duke scores, FDR < 0.01), showing the central location of cross-tissue GRNs. b, Contingency tables showing that cross-tissue GRNs more frequently have two or more CAD associations than tissue-specific GRNs. The upper table includes all tissue-specific networks, whereas the lower table excludes AOR and MAM tissues, which are the principal sites of CAD development. c, Box plots showing average CAD H2 contributions of cross-tissue (CT) GRNs (n = 89) versus tissue-specific (TS) GRNs (n = 135) (left), per-GRN eSNPs (middle) and per-GRN key drivers (KDs) (right). Median, center; lower and upper quartiles, box; 1.5 × interquartile range, whiskers. d,e, Density plots of size (d) and number of key drivers (e) of cross-tissue GRNs. Significance was determined by χ2 tests (b), two-sample t-tests (c) and two-sample Wilcoxon rank-sum tests (d,e).
In addition, among 32 GRNs with the strongest enrichment of differentially expressed CAD genes and associations with clinical severity of CAD, cross-tissue networks were over-represented (Fig. 4a,b and Extended Data Fig. 10e–g). Furthermore, cross-tissue GRNs were found to contribute to nearly threefold more CAD H2 than tissue-specific GRNs (Fig. 4c, left, and Supplementary Table 3). This difference was not attributed to higher per-eSNP CAD H2 contributions (Fig. 4c, middle) but possibly to the CAD H2 contribution per key driver that was significantly higher in cross-tissue GRNs than that in tissue-specific GRNs (Fig. 4c, right). Cross-tissue GRNs were also larger on average, containing more genes than issue-specific GRNs (Fig. 4d) and had a tendency to have fewer key drivers (Fig. 4e) Cross-tissue GRNs were also relatively enriched with genes that have been associated with CMDs and CAD by GWAS (Fig. 3e). Thus, as underscored by their contributions to CAD heritability, associations with clinical CAD scores, enrichment in differentially expressed genes in CAD and GWAS hits as well as by their inter-organ role in the supernetwork, cross-tissue GRNs appear to be critical to capture interactions between metabolic organs and the arterial wall and, thus, for the development of CAD.
Cross-tissue GRNs communicate via endocrine signaling.
Although cross-tissue networks have previously been described16, the underlying biology of gene–gene interactions across tissue borders is unclear. Such interactions may be explained by signaling between tissues but could also reflect noncommunicational latent responses (for example, systemic inflammation) or parallel biological processes (for example, cell cycle) (Fig. 5a). To explore these possibilities, we performed GO enrichment analyses, comparing enrichment of cross-tissue GRNs with tissue-specific GRNs. Within all GO categories (biological processes, molecular functions and cellular components), cross-tissue GRNs were enriched in communicative features compared to tissue-specific GRNs, including the biological processes of ‘response to stimuli’ and ‘secretion’ (Fig. 5b). Notably, CAD-linked cross-tissue GRNs were particularly enriched in genes involved in stimulus responses and secretion processes (Fig. 5c). Thus, according to GO analyses, inter-organ gene–gene interactions represented by cross-tissue GRNs seem to involve true organ-to-organ signaling.
Fig. 5 |. Endocrine factors in cross-tissue networks mediate signaling between GRNs in metabolic tissues and the arterial wall.
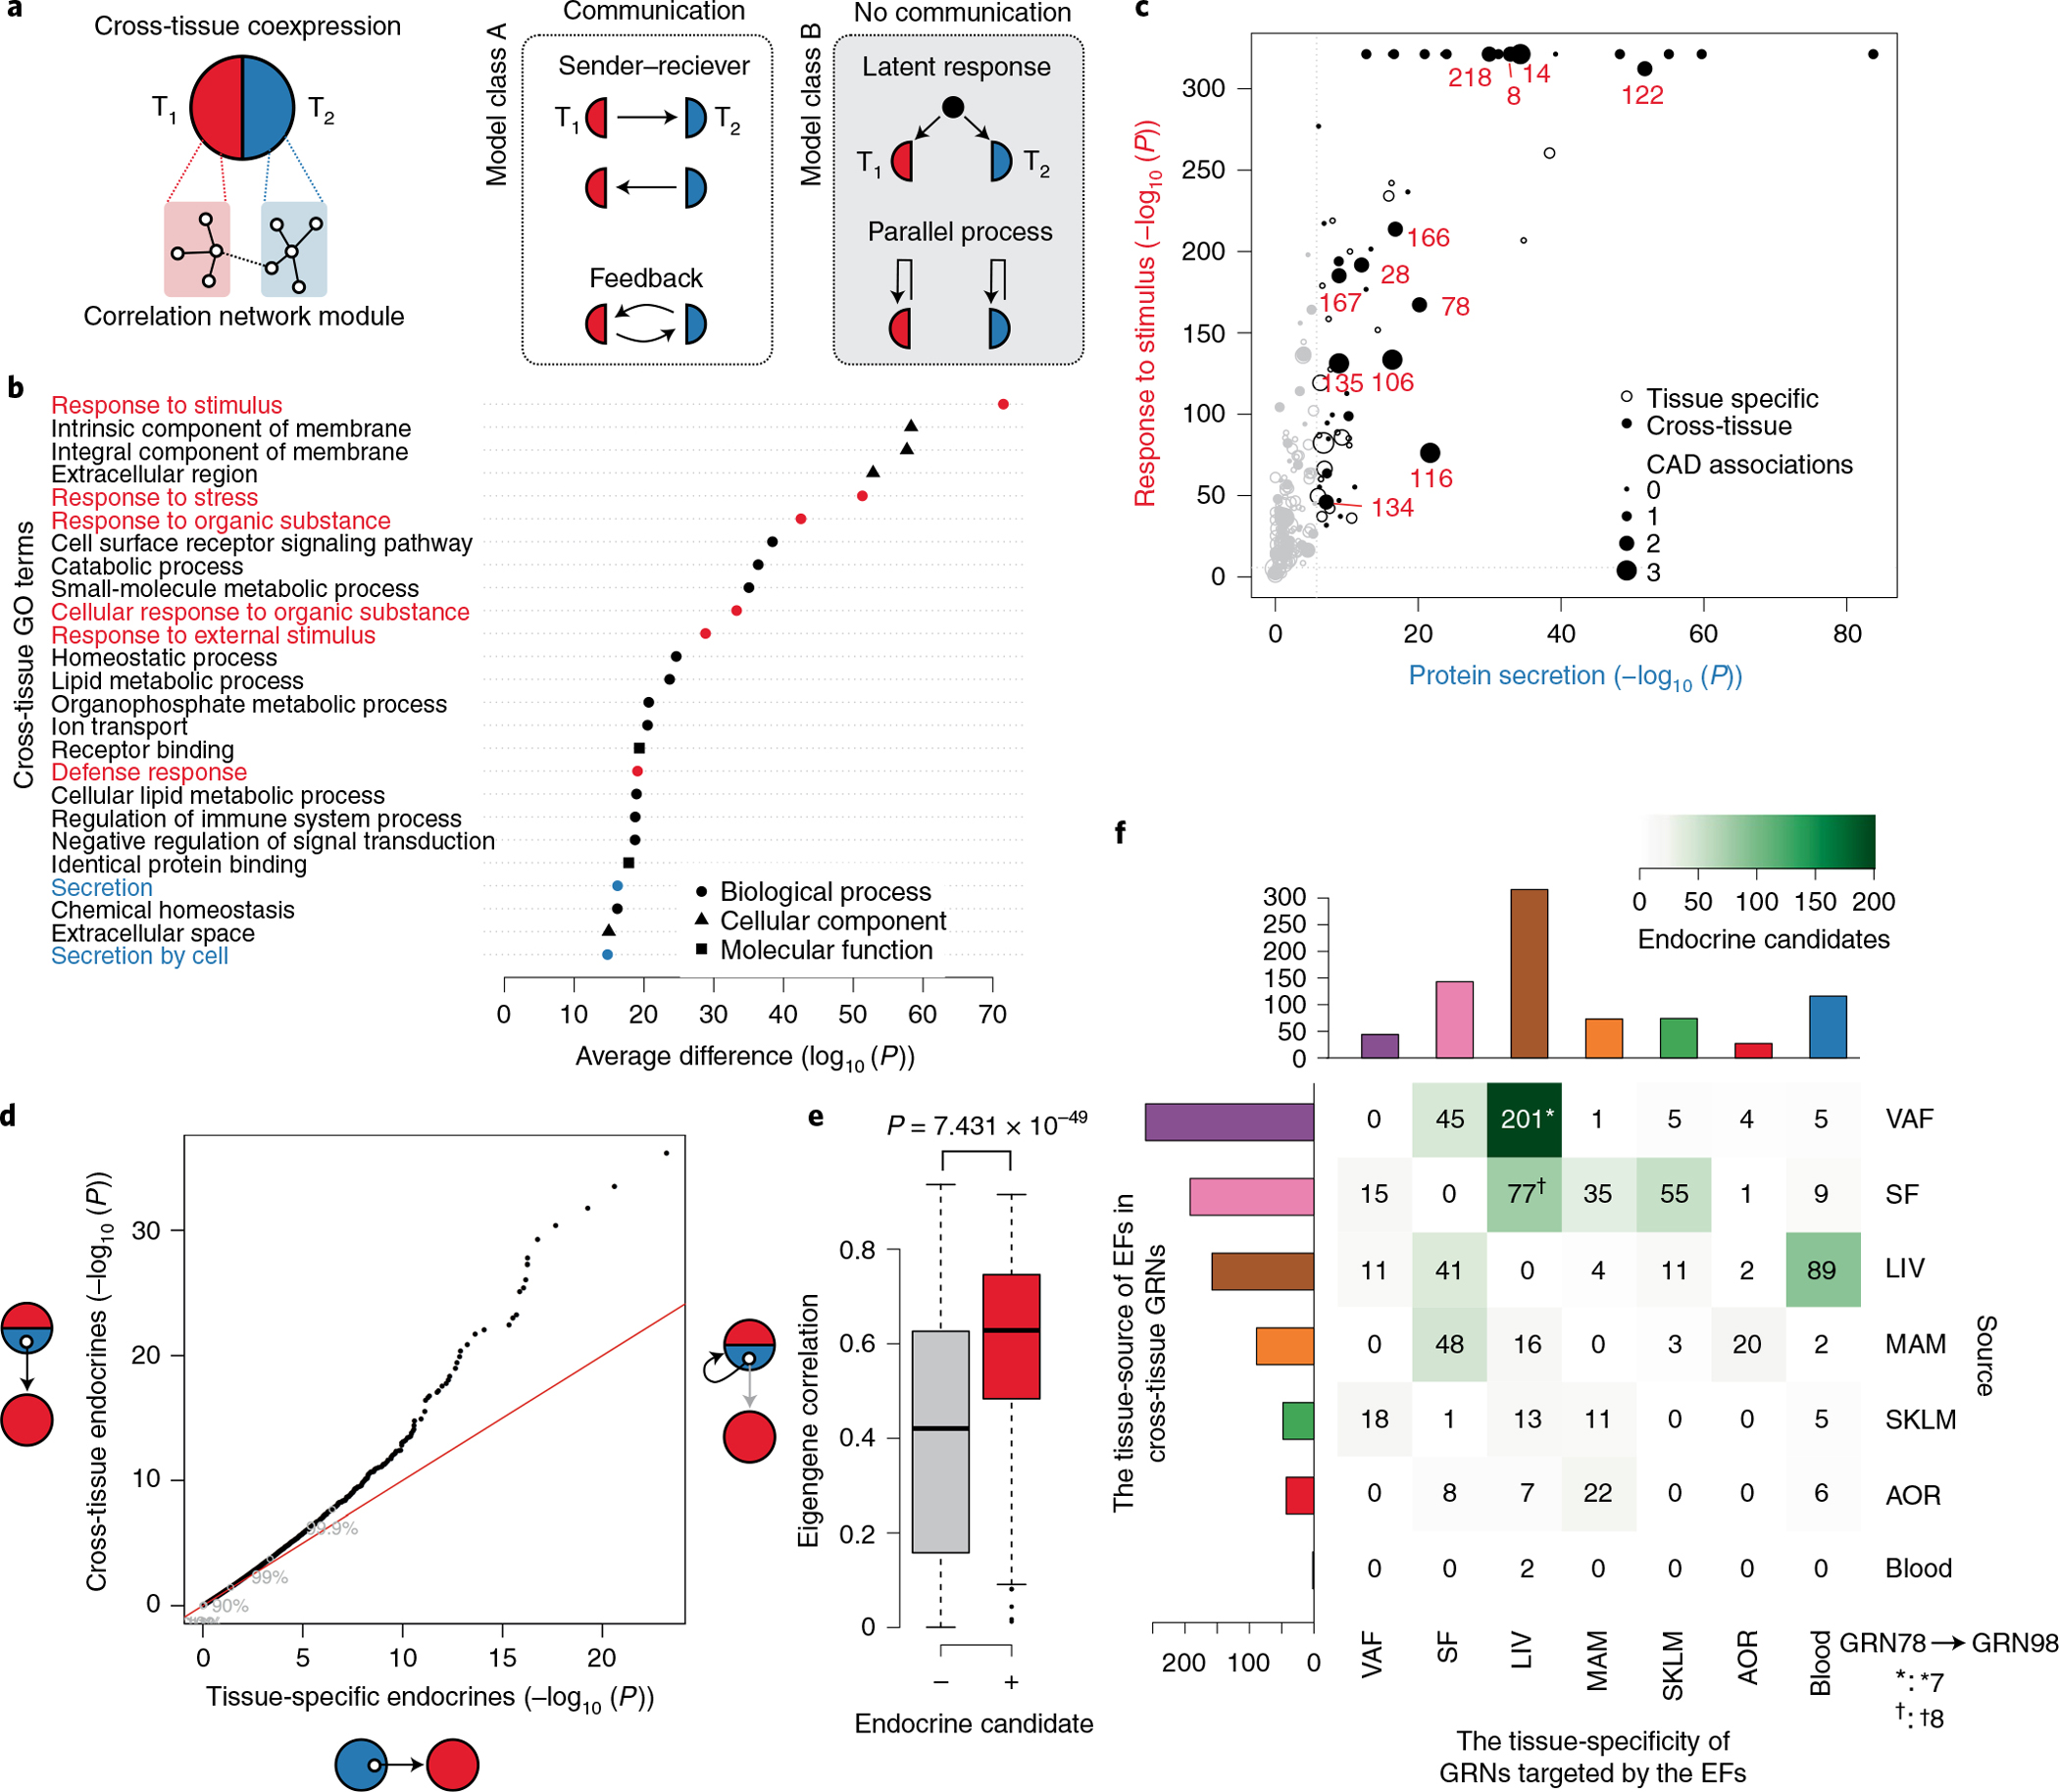
a, Two biological models that may explain cross-tissue GRNs. Left, communicative models, such as sender–receiver or feedback signaling. Right, noncommunicative models, such as parallel coincidental responses to latent external factors (for example, circulating or neuronal factors) or parallel but independent intra-tissue processes such as cell mitosis. T1, tissue 1; T2, tissue 2. b, Difference in GO enrichment between cross-tissue and tissue-specific GRNs (Fisher’s exact test, one-sided Mann–Whitney test of enrichment log (P values), FDR < 0.01). Enrichments of GO terms related to cellular signal reception and transmission are marked in red and blue, respectively. c, GO enrichments of cross-tissue and tissue-specific GRNs for the sender term ‘protein secretion’ (x axis) and the receiver term ‘response to stimuli’ (y axis). CAD-associated GRNs are marked in red. Gene set enrichment was performed by Fisher’s exact test. d, Quantile–quantile plot of correlations between genes (mRNA) encoding secreted proteins (UniProt annotation) in cross-tissue (y axis) and tissue-specific (x axis) GRNs and eigengene values of tissue-specific GRNs separate from the origin of the mRNA of the secreted protein (Pearson correlations, two-tailed t-test). e, Box plot showing average mRNA correlations of genes encoding secreted proteins with the eigengene of their host cross-tissue GRNs, comparing secreted proteins defined as ‘endocrine candidates’ (+, n = 467) and those that were not (−, n = 2,959). ‘Endocrine candidates’ were defined as secreted proteins in cross-tissue GRNs with correlations with tissue-specific GRNs at FDR < 0.2 in d. Median, center; lower and upper quartiles, box; 1.5 × interquartile range, whiskers. Two-sample Wilcoxon test. f, Heatmap of a tissue source–target matrix of 793 significant associations between pairs of endocrine candidate mRNA expression values and eigengene values of tissue-specific GRN targets. In total, 374 unique endocrine candidate genes were identified. 13 of these endocrine candidates identified in VAF (n = 7†) or SF (n = 8*) as part of the cross-tissue (liver-SF-VAF) GRN78 targeted the liver-specific GRN98 representing the most reliable edge in the supernetwork according to the bootstrapping analysis (Extended Data Fig. 10h).
Next, to assess possible roles of secretory proteins as underlying mediators of organ-to-organ gene interactions and signaling represented by cross-tissue GRNs, extending on our previous study31, we examined associations between gene expression of secreted proteins and eigengene values of tissue-specific GRNs in neighboring tissues. We found that such endocrine factor candidates, when present in cross-tissue GRNs, were more likely to correlate with eigengene values of these neighboring tissue-specific GRNs than endocrine factors present in tissue-specific GRNs (Fig. 5d). Moreover, cross-tissue GRNs with endocrine candidates associated with eigengene values of neighboring tissue-specific GRNs (Fig. 5d) were also more strongly associated with eigengene values of their host cross-tissue GRN (Fig. 5e). Thus, endocrine factors in cross-tissue networks appear, at least in part, to underlie their inter-organ gene interactions and, thus, their connections with tissue-specific networks in neighboring tissues, whereas endocrine factors in tissue-specific GRNs were unrelated to their connections with neighboring tissue-specific networks, consistent with their intra-organ functions.
In the 89 cross-tissue GRNs, we identified 374 endocrine candidates (Supplementary Table 7), defined as having at least one significant association with an eigengene value of a neighboring tissue-specific GRN (Fig. 5f). Among these candidates, 152 (>40%) operated along an axis represented by cross-tissue GRNs in VAF and SF that targeted liver-specific GRNs (Fig. 5f). To validate this adipose-to-liver axis, we queried associations of the identified adipose endocrine candidates with eigengene values of liver-specific network modules in independent global adipose and liver gene expression data from three cohorts of over 106 clinically well-characterized but diverse inbred strains of mice (n = 3–7 mice per strain) termed the hybrid mouse diversity panel (HMDP)25 (Methods). Forty-two of the 152 factors identified in the STARNET study were also significantly associated with liver-specific network modules (that is, eigengene values) in the HMDP (Supplementary Table 7). Among these, the most reliable interaction according to bootstrapping analysis of the supernetwork (from GRN78 to GRN98 (Extended Data Fig. 10h)) was represented by 13 adipose endocrine candidates (Fig. 5f).
Adipose endocrine factors alter liver-specific GRN98, plasma lipids and blood glucose.
Recently, we identified a liver-specific network as a potential gene-regulatory hub for control of plasma lipid and blood glucose levels10, corresponding to GRN98 in the current study. To assess possible metabolic associations of cross-tissue GRN78 and liver-specific GRN98, we first queried their eigengene–phenotype correlations in STARNET. Eigengene values of GRN78 and GRN98 correlated with BMI, plasma leptin levels and HbA1c levels (suggesting that greater network activity increases phenotype severity) but were particularly strong (r = 0.3–0.6, P < 10−14) in GRN78 (Fig. 6a). By contrast, plasma cholesterol levels correlated only with eigengene values of GRN98 (r = 0.26, P < 6.53 × 10⁻¹²) (Fig. 6a). These phenotype associations of GRN78 and GRN98 were paralleled by their respective GO enrichment results. Overall, GRN78 chiefly harbors genes involved in ‘carboxylic/fatty acid processing’, and GRN98 harbors genes involved in ‘sterol/cholesterol metabolism’ (Fig. 6b).
Fig. 6 |. Adipose endocrine factors in the cross-tissue GRN78 targeting liver-specific GRN98 are associated with liver and plasma lipid and glucose levels.
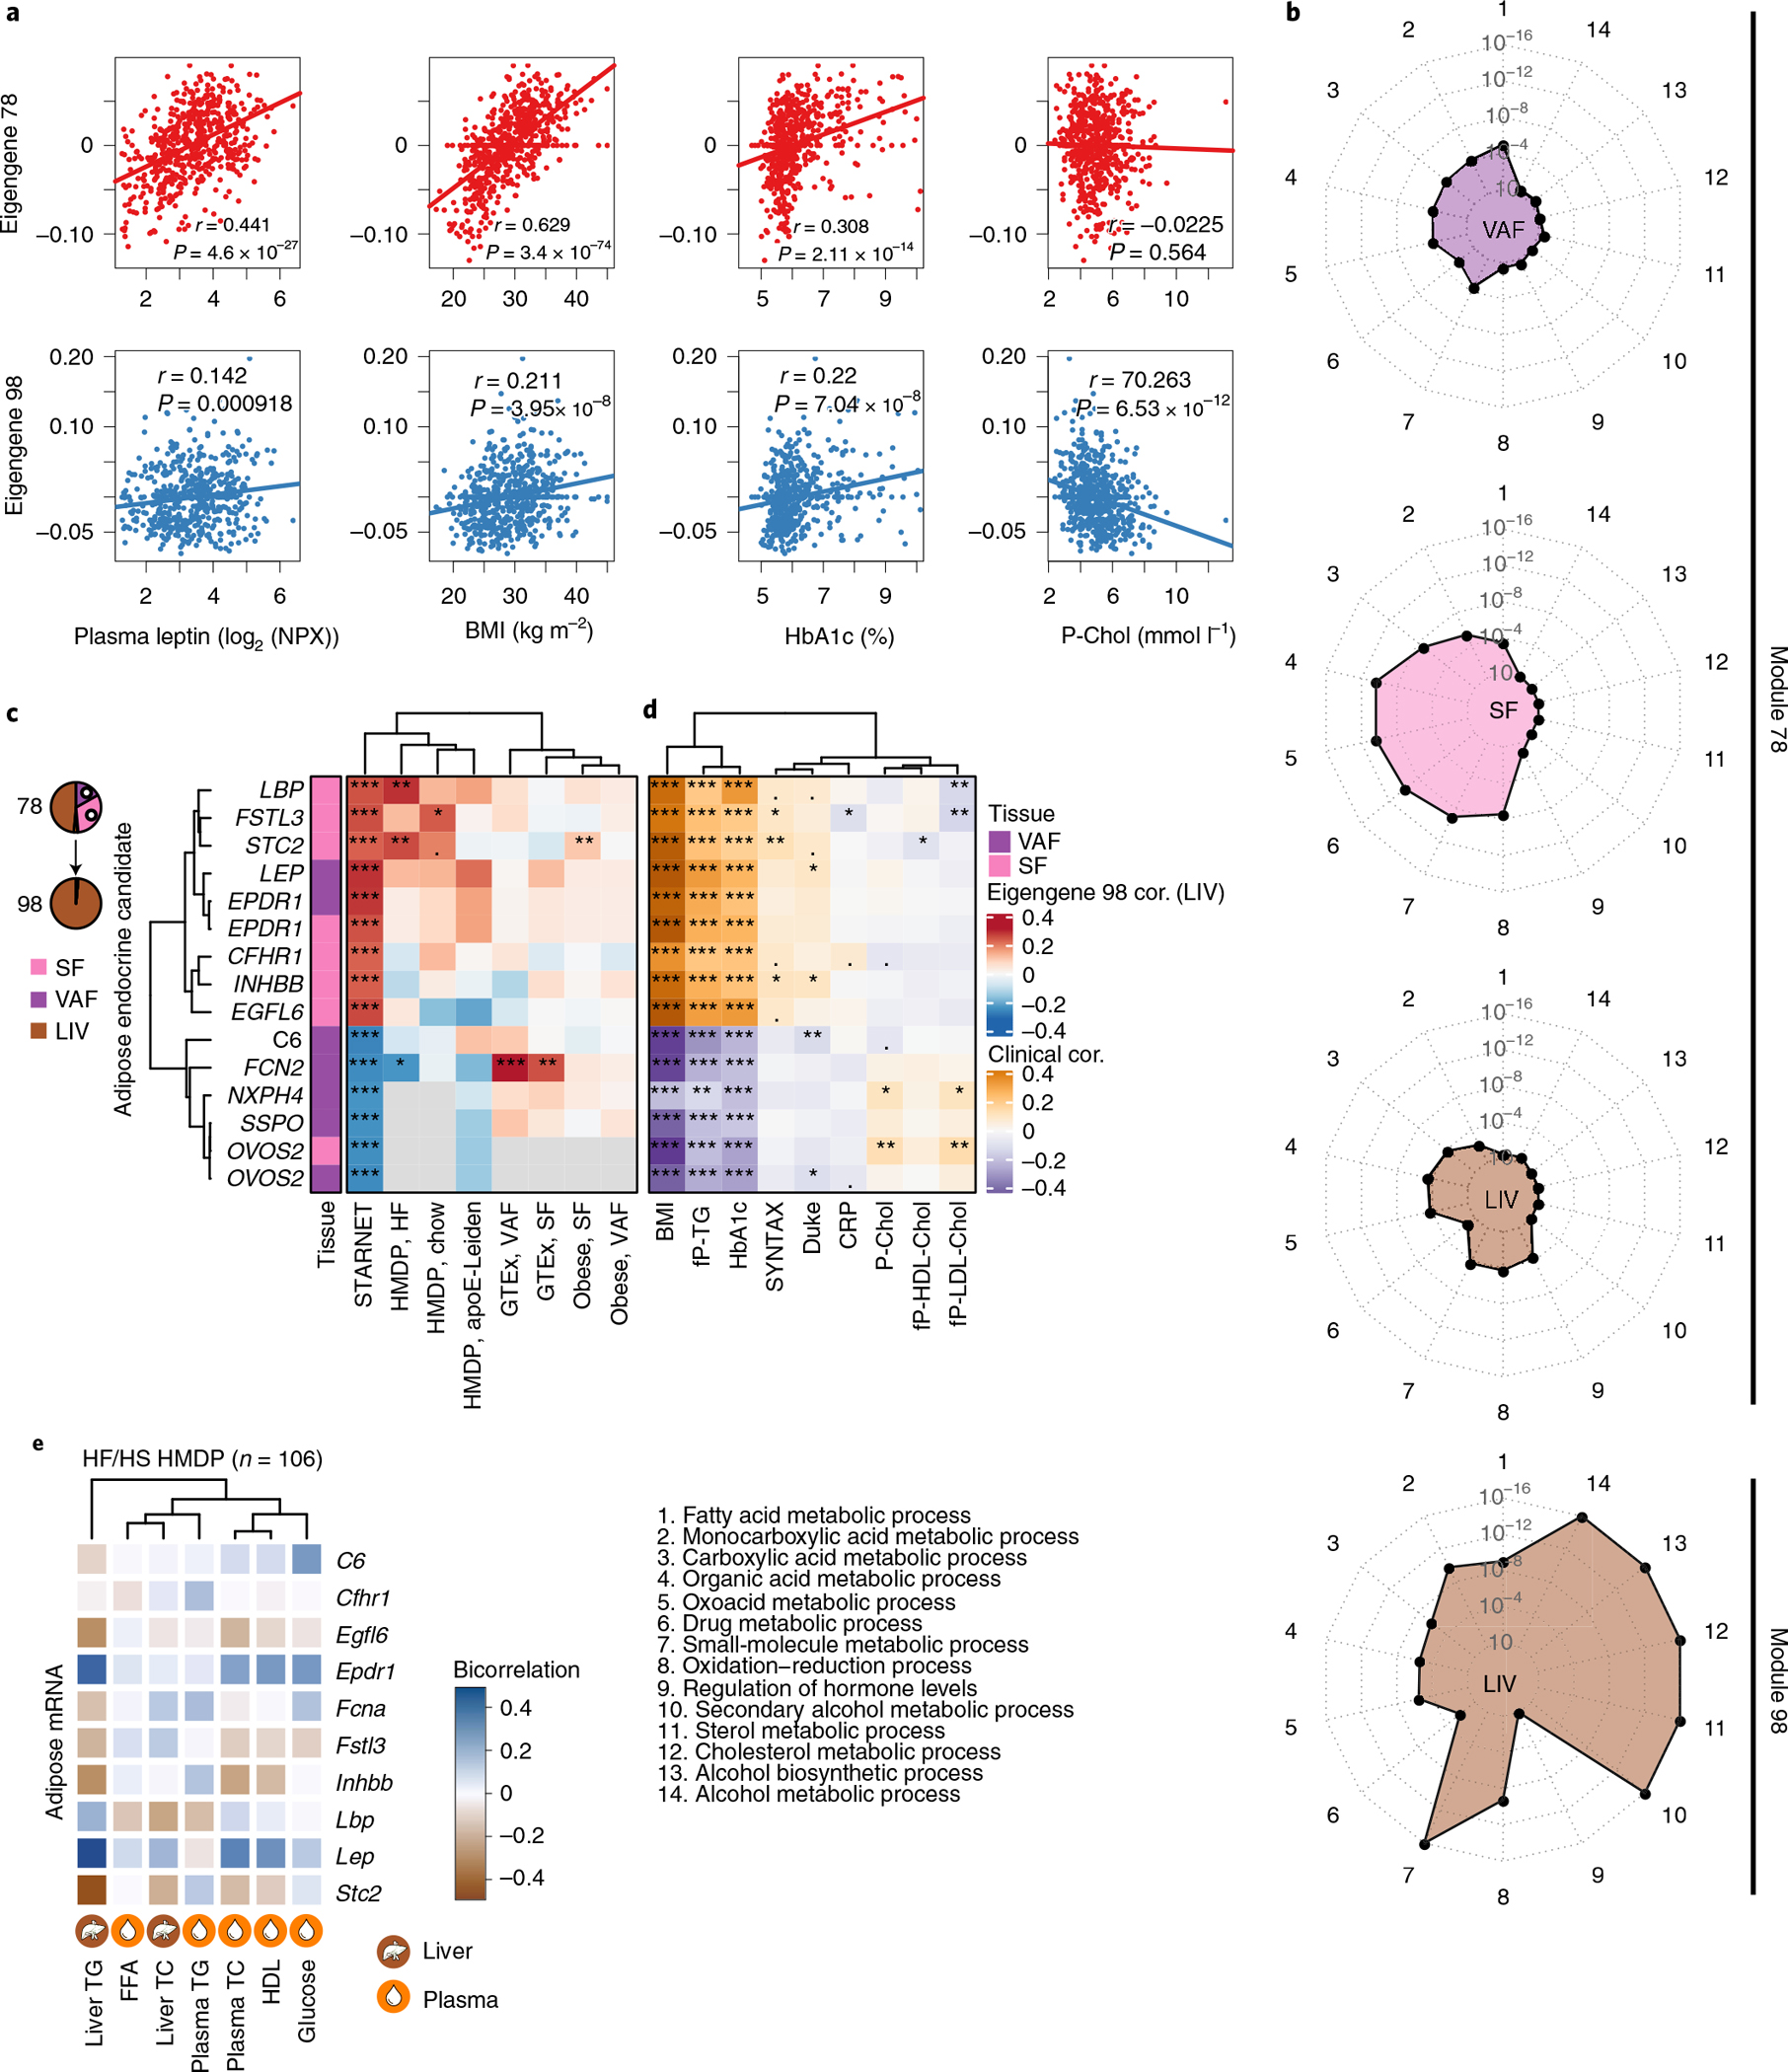
a, Scatterplots showing linear correlations of eigengene values of GRN78 and GRN98 with BMI and plasma leptin, HbA1c and total cholesterol levels. Pearson correlation, two-sample t-tests. b, Radar plots comparing the top five GO enrichments for tissue-stratified genes in GRN78 and GRN98. c, Heatmap showing Pearson correlations of GRN78 endocrine candidates (13 unique genes) with eigengene values of GRN98 in the STARNET study and in independent SF, VAF and liver microarray and RNA-seq data from HMDP mice fed a chow or high-fat (HF) diet25, GTEx32 and a morbid obesity cohort33. The official NCBI Gene symbol for SSPO is SSPOP. d,e, Associations of the 13 endocrine candidates with; CMD and CAD clinical phenotypes in the STARNET study (d) and, CMD phenotypes in high-fat/high-sucrose (HF/HS) fed mice in the HMDP, including plasma free fatty acid (FFA) levels and liver triglyceride (TG) and total cholesterol (TC) levels (e). Cor., correlation; NPX, Normalized Protein eXpression (Olink Inc.).
Next, we examined whether the 13 adipose endocrine candidates identified in cross-tissue GRN78 may underlie its interaction with GRN98 and the associations of both GRN78 and GRN98 with CMD traits. Consistent with our previous observations (Fig. 5d,e), the 13 adipose endocrine factors of cross-tissue GRN78 correlated both with eigengene values of GRN98 (Fig. 6c) and with those of their host (GRN78, Pearson correlation, r = 0.368, P = 5.11 × 10⁻²³; Extended Data Fig. 10h). They also correlated with GRN98 in independent adipose and liver data from the HMDP25, GTEx32 and a morbid obesity33 cohort (Fig. 6c) as well as with BMI, scores of clinically significant CAD and plasma lipid and blood glucose levels in the STARNET study (Fig. 6d) and similar phenotypic characteristics in the HMDP, including hepatic and plasma levels of triglycerides and cholesterol (Fig. 6e). In sum, these results are consistent with a scenario in which GRN78 activity modulates the expression and secretion levels of these 13 endocrine factors from adipose tissue, which, upon reaching the liver, affect hepatic lipid and blood glucose levels in part by modifying activity of GRN98.
To experimentally validate endocrine effects of GRN78, we successfully generated recombinant forms of ten of the 13 adipose endocrine factors, intraperitoneally injected them alongside a control (secreted green fluorescent protein (GFP) purified in the same manner) into C57BL/6N mice31 and measured hepatic and plasma lipid and blood glucose levels (Fig. 7a). Remarkably, three administrations over the relatively short time period of 72 h showed that seven of the injected proteins had at least one significant effect on levels of hepatic or plasma lipids or blood glucose (Fig. 7b).
Fig. 7 |. Injection of mice with GRN78 endocrine factors affects GRN98 and levels of liver and plasma lipids and blood glucose.
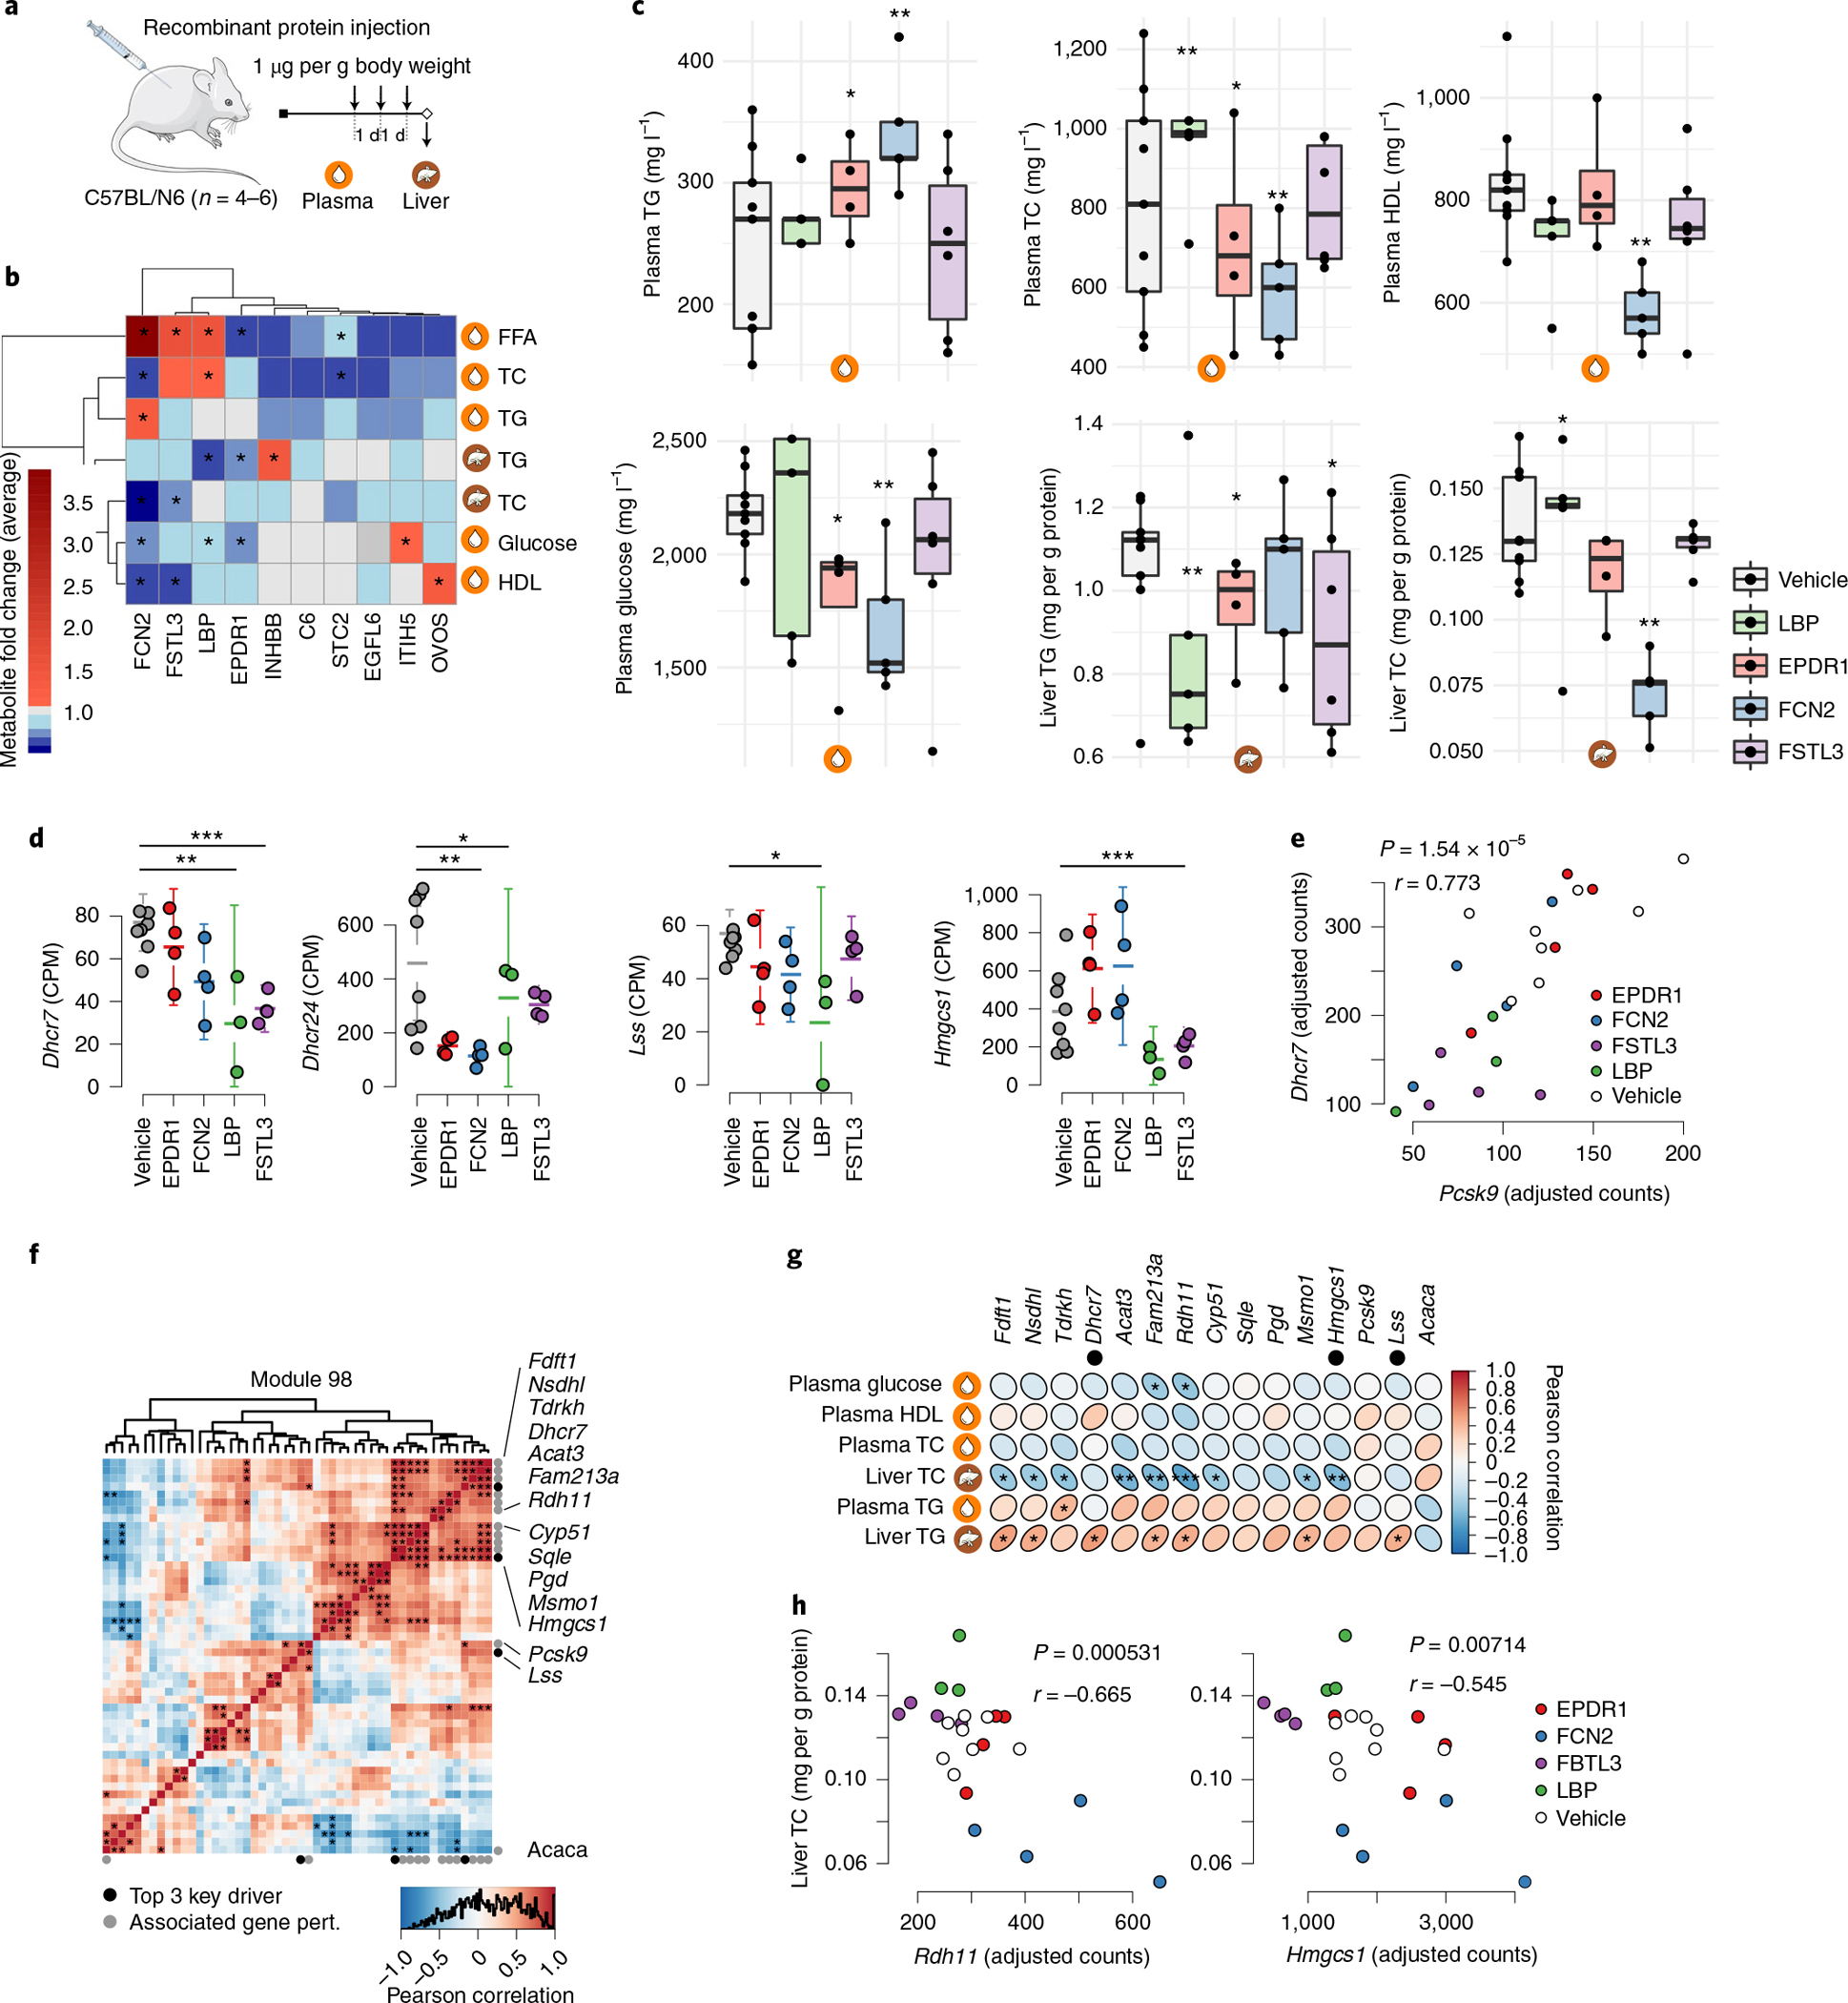
a, Chow-fed C57BL6N mice were injected with purified recombinant proteins of the indicated endocrine factors or the vehicle control (secreted GFP) once daily for 3 d (1 μg per g body weight). Twenty-four hours after the final injection, mice were killed, and the liver and plasma were collected for RNA isolation and metabolite screening. b, Heatmap showing changes in liver and plasma lipid and glucose levels in response to injection of recombinant forms of ten adipose endocrine candidates in GRN78 compared to those of control mice injected with GFP. *P < 0.01 by two-tailed t-test. c, Box plots comparing concentrations of plasma and liver lipid and blood glucose levels (y axis) after injecting recombinant endocrine factors (x axis). n = 3–8 independent animals per treatment group. Median, center; lower and upper quartiles, box; 1.5 × interquartile range, whiskers. Two-tailed t-tests. *P < 0.05, **P < 0.005, ***P < 0.001 versus vehicle (GFP). d, Mean plots showing mRNA expression of top key drivers in GRN98 (Dhcr7, Dhcr24, Lss and Hmgsc1) after injection of recombinant endocrine factors. Batch-adjusted DESeq2 negative binomial two-tailed tests, corrected for multiple hypotheses genome-wide with the Benjamini–Hochberg method. For visualization, expression values were normalized by counts per million (CPM). n = 4–6 independent animals per treatment group. Error bars are s.e.m. *FDR < 0.05, **FDR < 0.01, ***FDR < 0.001 versus vehicle. Tests are batch-adjusted DESeq2, corrected for multiple hypotheses genome-wide. e, Scatterplot showing correlation of Dhcr7 and Pcsk9 expression levels after injections (Pearson correlation, two-tailed t-test). f, Heatmap showing GRN98 gene correlations in liver RNA-seq data after injecting recombinant endocrine factors. Black dots indicate the top three key drivers previously identified10, and gray dots indicate significantly associated genes. *FDR < 0.05, adjusted by the Benjamini–Hochberg method. Pert., perturbation. The official NCBI Gene symbol for Fam213a is PRXL2A. g, Heatmap showing Pearson correlations between GRN98-associated genes (d) and hepatic and plasma lipid and blood glucose levels after injecting recombinant endocrine factors. Two-tailed correlation t-tests. *P < 0.05, **P < 0.01, ***P < 0.001. The top three key drivers are indicated by black dots. h, Scatterplot showing liver cholesterol levels (y axis) and expression levels of Rdh11 and Hmgsc1 (x axis) after injecting recombinant endocrine factors. Pearson correlation, two-tailed t-tests.
Ependymin-related 1 (EPDR1), ficolin 2 (FCN2), follistatin-like 3 (FSTL3) and lipopolysaccharide-binding protein (LBP) had the broadest effects on these phenotypes (Fig. 7c), consistent with results in human and HMDP data (Fig. 6a–e). Therefore, we sequenced RNA isolated from livers of C57BL/6N mice after intraperitoneal injections of these four endocrine factors. All four factors markedly affected the expression of four key drivers in GRN98 (Fig. 7d). Moreover, after injections, expression of the top key driver of GRN98, Dhcr7, correlated strongly and positively with that of a well-characterized GRN98 gene, Pcsk9 (Fig. 7e). Alongside statins, inhibitors of proprotein convertase subtilisin–kexin type 9 (PCSK9) are the main treatment to lower plasma LDL cholesterol levels34. Injection of EPDR1, FCN2, FSTL3 and LBP also significantly affected expression levels of several other genes in GRN98 (Fig. 7f), of which many correlated individually with hepatic and plasma lipid and blood glucose levels (Fig. 7g). As an example, hepatic cholesterol levels were negatively associated with expression of the key driver Hmgcs1 in GRN98 and the GRN98 gene Rdh11 (Fig. 7h). Notably, perturbations of CMD traits following genetic ablation of three (complement component 6 (C6), LBP and leptin (LEP)) of these factors have previously been demonstrated in mice35.
While the effect size for individual endocrine candidate–trait correlations varied (Fig. 7b,c), their expression (upregulated versus downregulated) was, in many instances, informative and in accordance with described mechanisms of actions. For example, 4 d of EPDR1 administration led to reduced levels of plasma glucose and free fatty acids as well as liver triglyceride levels (Fig. 7c). This could, in part, be attributed to recently described effects of EPDR1 as a circulating enhancer of thermogenic activity36. Given that plasma glucose is a key substrate for thermogenesis in mice and that this process is heavily reliant on hepatic breakdown of triglycerides to replenish circulating free fatty acid levels, our observations fit this physiological function. In other cases, changes in concentrations of plasma metabolites following injections for 4 d (Fig. 7c) were harder to interpret and sometimes even seemingly inconsistent. This could have many explanations, including feedback loops, persistent genetic control of endocrine signaling unaffected by acute injections or, simply, insufficient prior knowledge. Generally, however, experimental validation by administering recombinant proteins to mice provides strong support for the relevance of the identified GRNs in CMD and CAD and, particularly, for a largely uncharacterized adipose-to-liver endocrine signaling axis with strong implications for liver and plasma lipid and blood glucose levels.
Discussion
For complex diseases, a systems view is needed to provide a framework for our increasingly detailed understanding of individual disease pathways and genes6,7. In this study, by integrating genotype, high-quality RNA-seq and clinical data from the STARNET study, we identified and independently validated 224 GRNs interacting in a CMD–CAD supernetwork, acting within and across metabolic organs, blood and the arterial wall to promote CAD development. By further integration with GWAS24 datasets, we found that genetic regulation of these GRNs explains 54–60% of CAD H2 beyond the 22% previously identified. Moreover in MR analysis, key drivers in 218 of the 224 GRNs were deemed causal for CMDs and CAD. Thus, the identified GRNs, including their master regulatory key driver genes and endocrine factors, which facilitate cross-tissue communication, constitute the most comprehensive account of CAD and CMD to date. To enable researchers to take advantage of this new resource by modeling their candidate pathways, genes and genetic variants into broader mechanistic CMD–CAD contexts37, we also developed the STARNET browser (http://starnet.mssm.edu).
Cross-tissue GRNs in the supernetwork emerged as particularly relevant for the development of CAD. We found that interactions across tissue borders mediated by these networks are explained, at least in part, by endocrine signaling and defined the specific source and target tissues of 374 mostly uncharacterized endocrine factors31. By facilitating communication between metabolic tissues and the arterial wall, these factors are likely key contributors to CMD and CAD development and may constitute potential targets for future therapies. Indeed, injections of recombinant forms of several of these factors operating along an axis from VAF and SF to the liver (Fig. 7) markedly altered hepatic gene activity and plasma lipid and blood glucose levels in mice. Proteomic studies of blood from the portal vein, which drains blood from subcutaneous and abdominal fat and delivers it specifically to the liver in a first passage, are merited to further explore this axis of endocrine signaling.
It is important to note that the term ‘gene-regulatory network’ is used differently in different contexts and by different research communities. The traditional definition is most often used and most useful in the study of developmental processes38 and in abstract Boolean gene-regulatory network models39. In the field of genomics during the last decades, however, a broader definition has been employed, in which a gene-regulatory network is defined as a ‘directional coexpression network’ (ref.12) (the ‘GRN’ definition used in the current study). This broader correlation-based definition of GRNs has become widely accepted, because (1) it helps to answer concrete biological questions, and (2) it addresses limitations that are inherent in the traditional definition of gene-regulatory networks. A fundamental question in complex disease genetics is how genetic variation affects disease traits. ‘Directional coexpression networks’ anchored in cis eQTL associations answer this precise question: they incorporate cascading and integrative effects of genetic variants at multiple loci and how they affect gene expression levels. These effects are functional, not physical, but, nevertheless, they provide clear starting points for dissecting underlying physical regulatory interactions8–10,15. Because GRNs are functional, it makes sense to define multiple tissue-dependent GRNs aside from GRNs that are specific to one tissue (‘tissue-specific GRNS’). Cross-tissue GRNs are built from gene–gene interactions across tissue borders where alterations in expression of genes in one tissue causes a signal that transits to another tissue. For instance, such signaling can occur due to underlying secretion of endocrine factors, which causes alterations in gene expression in a target tissue. In sum, tissue-specific and cross-tissue GRNs represent functional units that are largely responsible for pathophysiological processes underlying CMDs and CAD. To understand how these GRNs interact, we calculated their eigengene values, which allowed us to link the 224 GRNs in a supernetwork structure. Bootstrapping40 was then used to validate supernetwork interactions, showing that the GRN78 → GRN98 interaction was the most reliable edge in this supernetwork, an observation that was confirmed by experimental validation. Thus, the supernetwork of multiorgan GRNs provides a mechanistic framework of molecular interactions taking place in CMDs and CAD in which candidate genes of individual pathways can be further studied to understand their roles in a broader molecular context.
Inevitably, systems studies raise more biological questions than they answer. For example, the marked upregulation of noncoding genes in the atherosclerotic arterial wall and the reciprocal downregulation of noncoding genes in metabolic tissues of patients with CAD were unexpected (Fig. 2c). In these tissues, altered noncoding genes substantially outnumbered the corresponding upregulated and downregulated coding genes. These findings highlight that noncoding genes are a crucial but unexplored aspect of CMD–CAD pathobiology. Another unexpected finding was the general suppression of hepatic transcription, suggesting suboptimal hepatic function in CAD. Finally, tissue sampling was performed on individuals on medication, with potential implications for gene expression, while undergoing surgery for severe CAD. Although we adjusted for this and other potential confounders, additional molecular, anatomical and functional data from a spectrum of human ethnicities with temporal resolution at the tissue, cell type and single-cell levels in a range of CMD–CAD model systems and ethnicities will be needed to refine identified GRNs.
To the best of our knowledge, our study provides the largest context of gene-regulatory interplay based on transcriptional changes taking place across multiple tissues in CMDs and CAD and offers potential for understanding the full complexity of these disorders. This qualitatively and quantitatively new pathophysiological information should be broadly useful for the research community and will facilitate interpretation of GWAS findings, in which the majority of lead SNPs and associated candidate genes lack the broader, multiorgan mechanistic framework that they in fact operate in. Eventually, as resolution improves, the provided framework should be useful to model efficacy and potential side effects of new treatment targets. Thus, our analyses of STARNET data substantially expand the current level of understanding of CMD and CAD and should serve to accelerate development of early and individualized diagnostics and therapeutics in the coming era of precision medicine.
Methods
The STARNET cohort.
Informed consent was obtained from all 600 individuals with CAD in the STARNET study (average age, 66 years; 30% female) and all 250 controls (average age, 64 years; 45% female; Supplementary Table 1)19. Inclusion criteria for individuals with CAD were eligible for CABG and, for controls, eligible for open-heart surgery for reasons other than CABG (primarily valve replacement following aortic stenosis) and a pre-operative angiogram ruling out obstructive CAD (and, thus, the need for CABG). For both individuals with CAD and controls, the absence of other severe systemic disease such as active cancer or inflammatory disease was also required (Ethics Review Committee on Human Research of the University of Tartu, approvals 2771T,17 and 188/M-12). During open-breast surgery, AOR, (MAM, only in individuals with CAD), VAF, SF, LIV and SKLM biopsies were obtained and immediately isolated in RNAlater (Thermo Fisher) and frozen at −80 °C. RNA isolation was performed using the RNeasy Mini kit (Qiagen). RNA-seq data were generated mainly using the polyA and Ribo-Zero Library Preparation protocols and then single-end sequenced at a length of 50–100 bp to a depth of 20–30 million reads using an Illumina HiSeq sequencer (Illumina)19. Tissue RNA samples for RNA-seq from the 600 individuals with CAD were selected to match control RNA based on univariate distributions of age, sex and BMI (Extended Data Fig. 1). To find an optimal set of matching patients (Extended Data Figs. 1–3), we used the Kolmogorov–Smirnoff statistic, measuring distribution similarity summed over all variables as an objective function, which was optimized using a genetic algorithm implemented in the GA R library with maxiter 2,000 and optim set to ‘TRUE’. The objective function also included a penalty term for the number of selected cases deviating from 250 with a penalty coefficient of 0.0005. Only individuals with CAD and controls with ≥3 available tissues were included in the study. The order of the resulting 1,496 RNA samples was randomized across individuals with CAD, controls and tissues; samples were prepared using the Ribo-Zero Library Preparation kit and then single-end sequenced at a length of 100 bp to a depth of 20–30 million reads using an Illumina HiSeq 4000 sequencer (Illumina). In the subsequent analysis, only samples with >1 million aligned reads were included.
Normalization of STARNET RNA-seq data and inference of eSNPs.
Previously published STARNET case RNA-seq alignments were used19, consisting of samples from AOR (n = 539), blood (n = 560), LIV (n = 546), MAM (n = 553), SKLM (n = 534), SF (n = 534) and VAF (n = 534). Thus, for the current study, no statistical methods were used to predetermine sample sizes, but sample sizes of n > 100 are sufficient for network analysis, such as WGCNA13. Gene counts were included if detected at ≥6 counts per tissue in 10% or more of samples. Gene expression data were pseudo-log transformed and normalized using L2 penalized regression with a penalty term of 1.0, adjusting for the following known covariates: sequencing laboratory, read length, RNA extraction protocol (polyA and Ribo-Zero), age and sex. In addition, we adjusted for the first four surrogate variables detected by surrogate variable analysis (SVA)41 and flow cell information after singular value decomposition, retaining components with eigenvalues >4. In the SVA, to maintain clinically relevant information, all available STARNET phenotype data were used as a model matrix, excluding age, sex and IDs. For this purpose, missing phenotype data were imputed with the mice package42. After regressing out these factors, adjusted gene expression counts were pseudo-log transformed. Matrix eQTL were used on genotype and RNA-seq data from individuals with CAD in the STARNET study19 to infer cis eQTL within ranges of 1 Mbp surrounding transcription start sites genome-wide using the modelLINEAR function (cisDist option <1 × 10⁻⁶). FDR was estimated using the qvalue R package. STARNET case and control genotype and RNA-seq data are deposited in dbGAP (study accession phs001203.v1.p1). Computer code used for analysis is available at https://github.com/skoplev/starnet.
Phenotype associations.
To associate gene expression with phenotypes of patients with CAD, we calculated Pearson’s correlation coefficients and Student’s P values per transcript and performed DESeq2 analysis43, adjusting for age and sex (FDR < 0.01) with numerical clinical measurements: SYNTAX score, Duke score, number of diseased vessels, number of lesions, BMI, CRP, HbA1c, waist/hip ratio, plasma cholesterol levels (total, LDL and HDL) and free plasma triglyceride levels. Next, we carried out a coexpression module meta-analysis, aggregating transcript P values per coexpression module using Fisher’s method (sum of log (P values)) implemented in the metap R package. When determining coexpression modules associated with measurements of CAD (SYNTAX score, Duke score and case–control DEG enrichment), we corrected P values for multiple hypotheses using Benjamini–Hochberg correction, considering both the number of modules (224) and the number of features (three). Based on the phenotype association −log (P values) clamped at a minimum of 10−16, we clustered tissue-specific and cross-tissue coexpression modules using complete linkage hierarchical clustering with a Euclidean distance metric. This clustering analysis also included module tissue fractions scaled by a factor of −log (10−16 × 7−1), effectively weighting tissue fractions equally to a single clinical measurement association.
Multi-tissue RNA-seq differential expression.
RNA sequences were aligned to the human genome GRCh38 version 89 using STAR 2.5.0 (ref. 44). Principal-component analysis was carried out on gene expression values with median counts ≥5, and data were normalized for DESeq size factors and standardized. Differential expression for each tissue was estimated using DESeq2 (ref. 43), adjusting for sex and age, correcting for multiple hypotheses using the Benjamini–Hochberg method, and genes were considered significantly differentially expressed if FDR < 0.01 and fold changes were more than ±30%. To test for covariates explaining differential expression, P values were compared before and after adjusting for key CMD traits (for example, BMI, plasma lipid levels and glucose levels), medical therapies and genotypes captured by multidimensional scaling components (Extended Data Fig. 2). For all subsequent analyses, we used differential expression statistics adjusted for sex, age and BMI.
Coexpression network modules.
We used normalized STARNET gene expression data across seven tissues per patient, for 151,774 tissue-specific transcripts at a missing data fraction of 0.194. To infer coexpression modules with scale-free properties across tissues, we evaluated the scale-free distribution fit R2 for connectivity (k) versus log (pk), for WGCNA45 β-value coefficients ranging from 1.0 to 10 at intervals of 0.5. We performed this analysis for transcript correlations within each tissue and between all pairwise combinations of tissues. For each tissue combination, we used the lowest β value with R2 > 0.85. If no such β value was identified, we considered β values with R2 within 95% of the optimal value and selected the β value closest to three for cross-tissue correlations and closest to six for tissue-specific correlations, effectively defaulting to the values used for previous cross-tissue coexpression network analysis based on microarray data9. In addition, the rational for the preference for cross-tissue correlations is that cross-tissue correlations tend to be weaker than tissue-specific correlations. Having estimated 27 (seven choose two) β values for each tissue combination, we compared three correlation-adjustment schemes: a single average β value for any tissue combination (‘single’), all specific β values per combination (‘complete’) and average tissue-specific and cross-tissue β values (‘dual’). All reported modules are based on the dual lower β-value approach with β = 5.2 for tissue-specific correlations and β = 2.7 for cross-tissue correlations, which were checked for topology overlap matrix-adjusted scale-free properties (Extended Data Fig. 5a). To estimate coexpression network modules, we used blockwise WGCNA, first segmenting the 151,744 transcripts into five blocks using projective k means with arguments ‘preferredSize 40,000’ and ‘sizePenaltyPower 5’. Within each transcript block, we calculated absolute Pearson’s correlation coefficients and detected network modules from the resulting topological overlap matrix with unweighted pair group method with arithmetic mean (UPGMA) hierarchical clustering and dynamic tree cut with arguments ‘deepSplit 2’, ‘pamRespectsDendro FALSE’ and ‘minClusterSize 30’. Proximal modules were merged at cutHeight 0.2. The resulting coexpression modules was considered to be ‘cross-tissue’ if >5% of module transcripts were from tissue other than the primary (most prevalent) tissue. If not, the coexpression module was classified as ‘tissue specific’. The expression of a given gene in each tissue was only accounted for once in one coexpression module. Thus, if robustly expressed across all seven tissues, a specific gene may occur in seven modules.
Coexpression module replication.
To assess the reproducibility of STARNET coexpression networks (and to assess whether STARNET data met assumptions for WGCNA regarding sample sizes and RNA-seq data distribution), we used an independent multi-tissue gene expression dataset in the form of TPM-normalized RNA-seq data from GTEx version 7 for six tissues also sampled in the STARNET study (except MAM). For each STARNET coexpression module not primarily consisting of MAM transcripts, we tested the significance of the concordance of correlation coefficients from STARNET data with GTEx using a t-statistic with n − 2 degrees of freedom. We adjusted for multiple hypotheses (224 coexpression modules) using Benjamini–Hochberg correction. In addition, we calculated R2 values from STARNET versus GTEx correlations to indicate the magnitude of network concordance. To avoid assumptions of normal distributions of network correlation coefficients and weights, we also used permutation tests implemented in the NetRep R package21 (Extended Data Fig. 7a–d).
Gene set enrichment analyses.
All enrichment analyses were calculated using Fisher’s exact test with gene set overlap statistics following a hypergeometric distribution. To annotate coexpression modules, we carried out Fisher’s exact test for GO biological processes, cellular components and molecular functions using the WGCNA R package. Presented on the website are the top 100 terms in each category, including only terms specifically found enriched among these in <50 coexpression modules. To identify terms associated with cross-tissue modules, we compared log enrichment P values for cross-tissue modules with tissue-specific modules for 16,581 GO terms using two-sample one-sided Mann–Whitney tests. P values were adjusted using Benjamini–Hochberg correction and considered significant if FDR < 0.01. We used PANTHER enrichment analysis46 for GO enrichment in GRN78 stratified by tissue and for pathway enrichment of differential gene expression in the liver after injecting mice with endocrine proteins. Enrichment for case–control differential expression signatures between coexpression modules was also estimated using Fisher’s exact test, with tissue–gene combinations considered unique set elements. We separately tested upregulated and downregulated gene sets per tissue at FDR < 0.05 with ±30% expression change and furthermore required mean-adjusted read counts >50, retaining only highly expressed genes.
Gene-regulatory coexpression network and key driver inference.
Similar to a previously published method9, we inferred GRNs among genes in each coexpression module. We used GENIE3 (refs. 22,23), constrained by edges from eQTL genes and transcription factors47. Adjusted gene expression data were standardized, and missing values were imputed to the mean. Due to limitations of GENIE3, only networks from modules with fewer than 3,000 transcripts were inferred. To prioritize influential genes in each subnetwork, we carried out key driver analysis from the Mergeomics R package48. Notably, there are alternative strategies to define the directionality of gene–gene interactions within modules, such as those based on global causal structures within entire tissues, that, if applied to our study, would have defined key drivers based on the hierarchy of genes within each of the seven tissues rather than within each of the coexpression modules that are active within and across individual tissues. Thus, outside each coexpression module, the combined set of inferred key drivers were not globally ranked or prioritized. Within each module, however, the hierarchical order of key drivers was ranked according to their statistical significance available at http://starnet.mssm.edu/ in the key driver table.
GWAS gene enrichment.
To define genes associated with cardiometabolic traits, we used the NHGRI-EBI GWAS version 1 Catalog (e88_r2017–05-29)28. CAD GWAS genes were manually retrieved from multiple studies24,49,50. The reported genes for a given trait were used to test for enrichment in coexpression modules using Fisher’s exact test. For visualization on the high-confidence supernetwork, traits were grouped into classes: blood lipids (HDL, LDL, total cholesterol and triglycerides), glucose metabolism (T2D and fasting glucose) and obesity (BMI and waist/hip ratio-adjusted BMI).
Network heritability.
We used individual-level genotype data from a pool of nine CAD GWAS datasets to calculate heritability contributions of eSNPs in STARNET GRNs as recently described26. In brief, genome relationship matrices for each eSNP list were calculated with LDAK51 and adjusted for LD and minor allele frequency of 5%. To eliminate potential population stratification or study batch biases, we made further adjustments based on the top 20 multiple dimensions derived from individual-level genotype data. With a CAD population prevalence set at 5% and the portion of CAD heritability at 40% (H2), CAD variance explained in a liability model was calculated with the REML method with GCTA52. Unlike traditional multifactorial liability threshold models typically used for heritability assessments of independent lead SNPs in GWAS, REML enables assessment of heritability from groups of multiple SNPs. Before analyses, lead SNPs of CAD and SNPs in their linkage disequilibrium (LD > 0.2) were removed. For the combined H2 contribution of the 224 GRNs, we also applied the mediated expression score regression method27.
Website architecture.
The website http://starnet.mssm.edu was developed with a Python Flask backend and a sqlite3 database, with an application programming interface for fetching data. Interactive visualizations were developed in JavaScript using D3 and Plotly.
Mendelian randomization.
To infer the causal network in each tissue, we used MR of pairwise causal interactions between key driver genes with cis eQTL and downstream targets using the Findr53 Python package. Interactions were estimated by testing whether a candidate target had a trans eQTL association with the key driver cis eQTL instrument (Findr secondary linkage test) and whether the key driver and target gene were not independently associated with the cis eQTL to exclude horizontal pleiotropy (Findr controlled test). Posterior probabilities of each test being true were combined to obtain the local FDR for each key driver–target combination. For any significance threshold α, the global FDR of all interactions with local FDR scores below α can be estimated by calculating the mean of local FDR scores for the retained interactions54. Thresholds were determined for each tissue separately to obtain an estimated FDR of 10%. Because causal networks are tissue specific, the analysis was limited to tissue-specific GRN modules (95% nodes from one tissue, <500 genes). Of the 224 GRN modules, 119 met this criterion, harboring a total of 3,601 unique key drivers divided into LIV (928), SKLM (729), AOR (445), MAM (604), VAF (866), SF (429) and blood (528) groups (Supplementary Table 5).
For the GRN key driver–CMD–CAD trait MR analysis, cis eQTL in AOR, MAM, BLOOD, LIV, SKM, SF and VAF samples were tested for causal associations with 11 STARNET traits: eight for CMDs (BMI, waist/hip ratio, CRP, total cholesterol, LDL and HDL cholesterol, triglycerides and HbA1c) and three for CAD (number of lesions and SYNTAX and Duke scores). In the one-sample MR analysis, the effective allele dosage of cis eQTL was used as the instrumental variable in linear regression analysis of participants in the STARNET study for whom gene expression, genotype and phenotype were simultaneously available using the ‘ivreg’ function from the AER R package (version 1.2–9). For the two-sample MR analysis, lead cis eQTL with mRNA association P value ≤ 1 × 10⁻³ and available GWAS phenotype association statistics were selected (Supplementary Table 6). Phenotype (outcome) and mRNA (exposure) association statistics were then combined using the inverse-variance weighted method as implemented in the MendelianRandomization R package (version 0.4.3)55.
Eigengene supernetwork inference.
Directed supernetwork interactions between eigengenes of coexpression GRN modules13 were inferred using a Bayesian network approach based on fast greedy equivalence search30. The likelihood of network structures was evaluated using Bayesian information criteria. The node out degree was constrained to a maximum of 100 edges. We used the rcausal R package, which is a wrapper for a tetrad suite of causal network search algorithm, and is developed by the Center for Causal Discovery56. All other parameters were set at their default values. The supernetwork layout was determined using the Fruchterman–Reingold algorithm implemented in the igraph R package and run for 20,000 iterations. To assess statistical reproducibility of supernetwork edges, we carried out bootstrap sampling, drawing eigengene datasets from 1,000 random sets of patients with replacement40. For each bootstrap sample, we inferred supernetworks, estimating P values using edge frequencies (P = 1 − frequency). We carried out this analysis both globally and for the 32 CAD-associated coexpression modules. To assess the network influence of eigengenes, we computed the network centrality measure betweenness, which is defined as the number of shortest paths going through a node, based on the matrix of 224 × 224 bootstrap P values.
Endocrine factor identification.
We have previously shown that cross-tissue correlation from multi-tissue gene expression data can be used to predict endocrine signaling between tissues31 in cross-bred mouse strains25. To identify endocrine candidates from STARNET multi-tissue gene expression data, we assessed 2,444 genes with secreted protein annotation in UniProt. UniProt is a collection of genes that (1) in published literature are annotated as ‘secreted’, (2) are detectable in plasma or (3) have been filtered in silico for the presence of signal peptides for secretion. Several of the UniProt-classified genes have also been described to exist as membrane-bound isoforms or to signal between organs by non-classical means of secretion, such as shedding57. Furthermore, we employed criteria that (1) the secreted protein is found in a cross-tissue coexpression network module and (2) mRNA of the endocrine candidate is significantly correlated with a tissue-specific module from tissue other than the origin of the endocrine candidate. Specifically, we calculated Pearson’s correlation coefficients and Student’s P values between endocrine mRNA expression and eigengenes of tissue-specific coexpression modules. Only genes for secreted proteins from coexpression modules with fewer than 5,000 transcripts were considered. After correcting for multiple hypotheses for all possible pairs of endocrine factors and tissue-specific target modules, using the Benjamini–Hochberg method at FDR < 0.2, the remaining genes comprised the identified endocrine candidates. Altogether, we hypothesize that this model integrates cross-tissue coexpression, supernetwork interactions and endocrine signaling, facilitating interpretability of the molecular effects of identified endocrine factors.
To validate adipose-to-liver endocrine associations in independent data, we first computed eigengenes based on STARNET coexpression modules and then estimated Pearson’s correlations between mRNA of endocrine candidates and the hypothesized target liver module. For HMDP mice (gene expression data from chow diet, high-fat diet and apoE-Leiden groups), human gene symbols were mapped to mouse homologs according to the Mouse Genome Informatics resource58. For HMDP adipose and liver samples58, we used previously published microarray gene expression data from both sexes (n = 96–108 strains with two to five mice per strain), except for apoE-Leiden adipose tissue samples (n = 63), which were profiled with RNA-seq and aligned to GRCm38 version 95 using STAR 2.6.0c44. In contrast to adipose tissue samples from HMDP mice, for the human GTEx and morbid obesity datasets, subcutaneous and VAF tissues were distinct.
Mouse recombinant protein injection.
Proteins were synthesized in mammalian HEK293 cells, which were transfected to express a CMV-overexpressed protein attached to a TEV-cleavage site and a 9× His-tag as previously described31. Culture medium was run through a nickel–cobalt column, where bound protein was cleaved and dialyzed three times. We verified protein purity by >80% band intensity at the predicted molecular weight on a Coomassie gel. All mice included in this study were eight-week-old male C57BL/6J mice purchased from Jackson Laboratory and kept at 23 °C. Mice were fed a standard chow diet (Research Diets, D11112201) ad libitum and housed under 12-h day–night cycle lighting conditions. The use of animals and all experimental procedures were reviewed and approved by the UCLA Institutional Animal Care and Use Committee under protocol 92–169 and the UCLA Chancellor’s Animal Research Committee and conducted in accordance with the animal care guideline set by the UCLA. This study was carried out in compliance with ARRIVE guidelines (https://arriveguidelines.org). For each recombinant protein, four to six mice were injected intraperitoneally for 4 d (once per day) at a dose of 0.1 μg protein per g body weight. Individuals performing experiments were blinded to the contents of injection throughout the entire study and unblinded when analyzing metabolite data. Before killing, mice were fasted for 3 h and euthanized with isoflurane. Tissues were snap frozen in liquid nitrogen and processed accordingly. In total, we injected ten different proteins (STC2, LBP, FSTL3, EPDR1, FCN2, ITIH5, OVOS, EGFL6, C6 and INHBB) at n = 4–6, measuring the effect on levels of plasma cholesterol, plasma triglycerides, plasma free fatty acids, plasma glucose, liver cholesterol and liver triglycerides compared to those of the vehicle control. Metabolites were measured using enzymatic assays to quantify abundance based on a calorimetric assay. All protocols were followed according to manufacturers’ specifications, and final concentrations were calculated based on fit with a standard curve of known inputs. Kits used were for glucose (Fujifilm, Wako, 997–03001), cholesterol (Sigma, MAK043), triglycerides (Sigma, MAK266) and free fatty acids (Sigma, MAK044). The same assays were used to measure metabolites in the liver and plasma.
Following the injection protocol, liver samples were prepared for RNA-seq. Livers were first pulverized in liquid nitrogen using a cell crusher, and then RNA was extracted using an RNeasy Mini kit (Qiagen, 74106) and resuspended in nuclease-free water. The quality of extracted RNA was assessed using a TapeStation, and samples achieving RIN > 6.8 were used for library preparation. Five animals were excluded from RNA-seq due to insufficient liver RNA quality according to the RIN score. Libraries were prepared from 800 ng total RNA per sample and processed using a KAPA HyperPrep kit (Roche, KR1352). Sample quality was then confirmed using a TapeStation (D1000), and samples were sequenced on two lanes (PE, 50-bp reads) of a HiSeq 4000 instrument. RNA sequences were aligned to GRCm38 version 95 with STAR 2.6.0c44. Differential expression between livers from mice injected with test proteins and vehicle controls was assessed using DESeq2 (ref. 43). For several proteins eliciting significant effects, experiments were also cross-validated using purchased proteins (FCN2, OriGene, TP318750; LBP, Abcam, ab119721; FSTL3, OriGene, ab119721; EPDR1, OriGene, ab162830).
Reporting Summary.
Further information on research design is available in the Nature Research Reporting Summary linked to this article.
Data availability
Case and control STARNET data are available at the dbGAP site (dbGaP study accession phs001203.v1.p1). Validation data are provided by the HMDP25, GTEx32 and morbid obesity33 studies. Liver RNA-seq data generated in response to injecting mice with recombinant endocrine factors are available under GEO entry GSE189001. Source data are provided with this paper.
Code availability
Computer code used for data analysis in this study is available at https://github.com/skoplev/starnet.
Extended Data
Extended Data Fig. 1 |. Overview of matching STARNET CAD cases to controls without obstructive CAD according to age, gender and BMI.
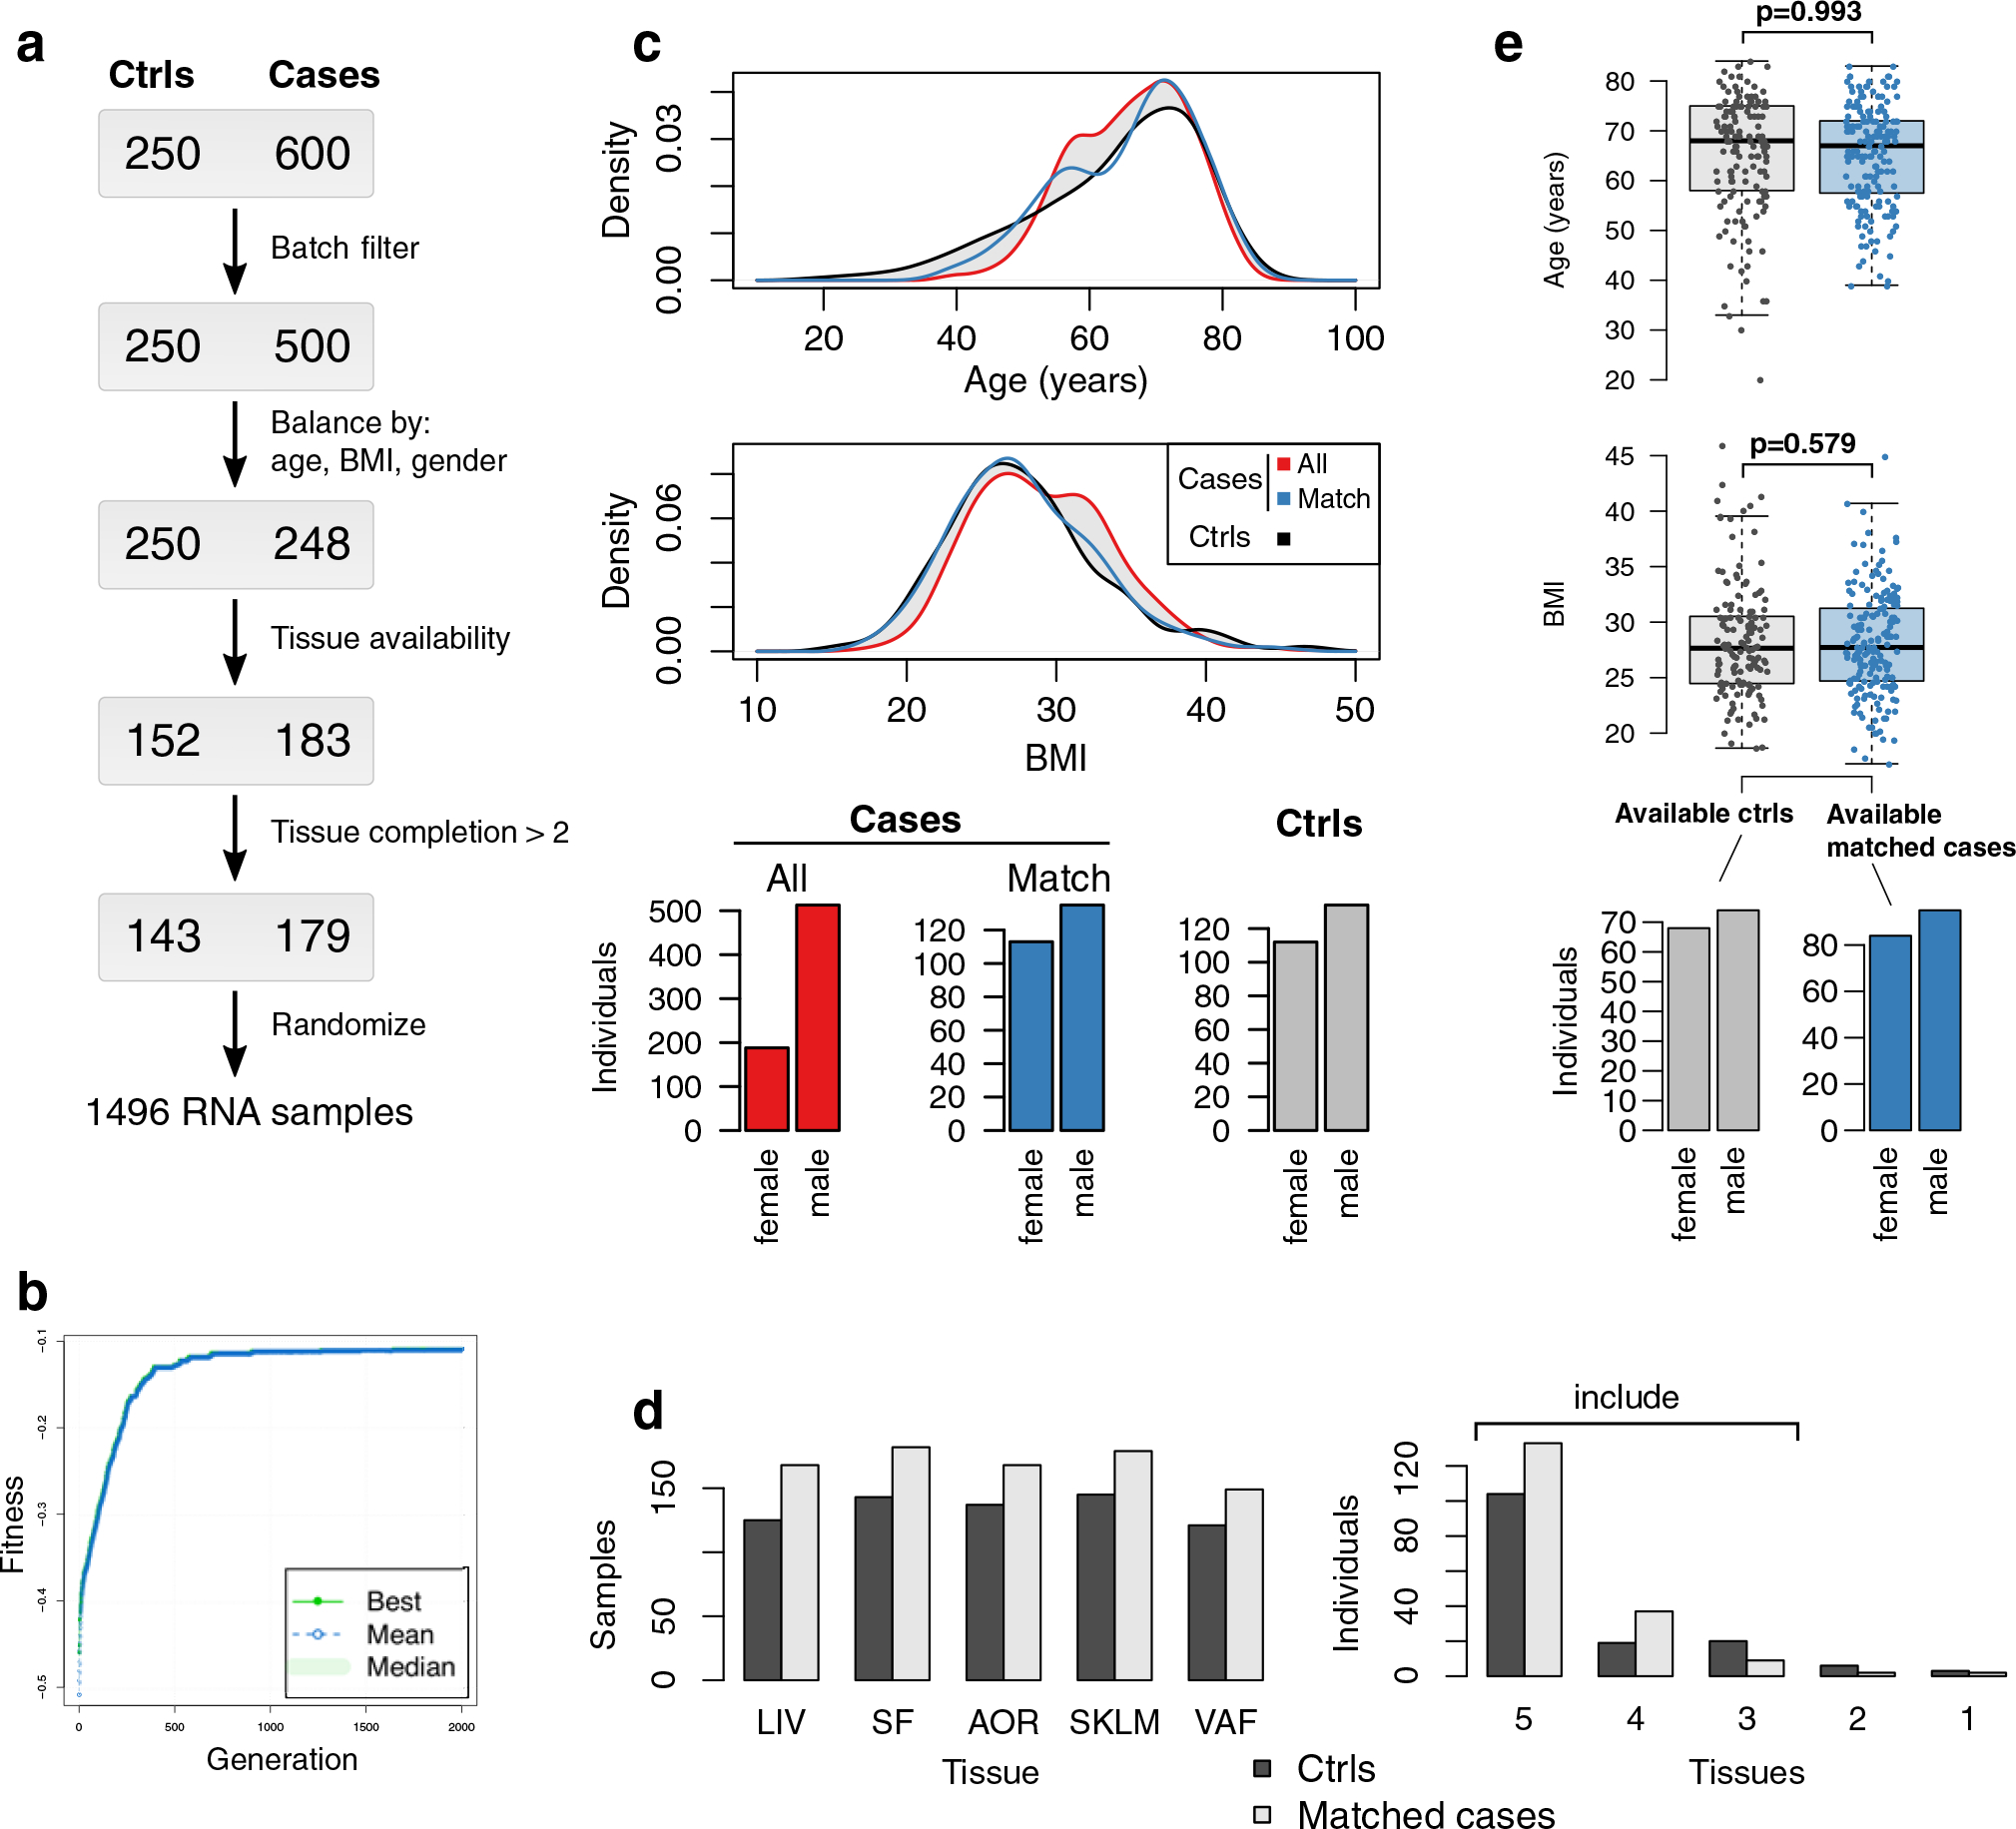
The 600 CAD cases underwent coronary artery by-pass grafting (CABG) surgery due to obstructive CAD. The 250 controls were patients eligible to open heart surgery other than CABG (mainly valve replacements) who had no signs of obstructive CAD in pre-operative angiograms (SYNTAX score =0). a, Overview of steps used to select RNA samples from the 600 CAD cases for sequencing by matching them to RNA samples available from the 250 controls according to age, gender and body mass index (BMI). b, Evolutionary algorithm optimizing an objective function quantifying the discrepancy of univariate distribution of age, BMI, and gender between selected cases and controls. c, Distribution of age and BMI (kernel probability density estimates, upper panel) and bar plots of gender for all cases, matched cases and controls (lower panel). d, Bar plots showing per-tissue sample sizes based on tissue sample availability (left panel). Only STARNET subjects in whom at least 3 tissues were sampled were included (right panel). e, Two box plots and one bar plot showing the final balances in age (upper panel) and BMI (middle panel), and gender (lower panel), respectively, between the selected CAD cases and the CAD-negative controls. Median center, lower and upper quartile box, and 1.5 interquartile range whiskers. Two-tailed t-tests.
Extended Data Fig. 2 |. Case-control differential gene expression statistics adjusted for metabolic phenotypes, drug treatments and genotype using DESeq2.
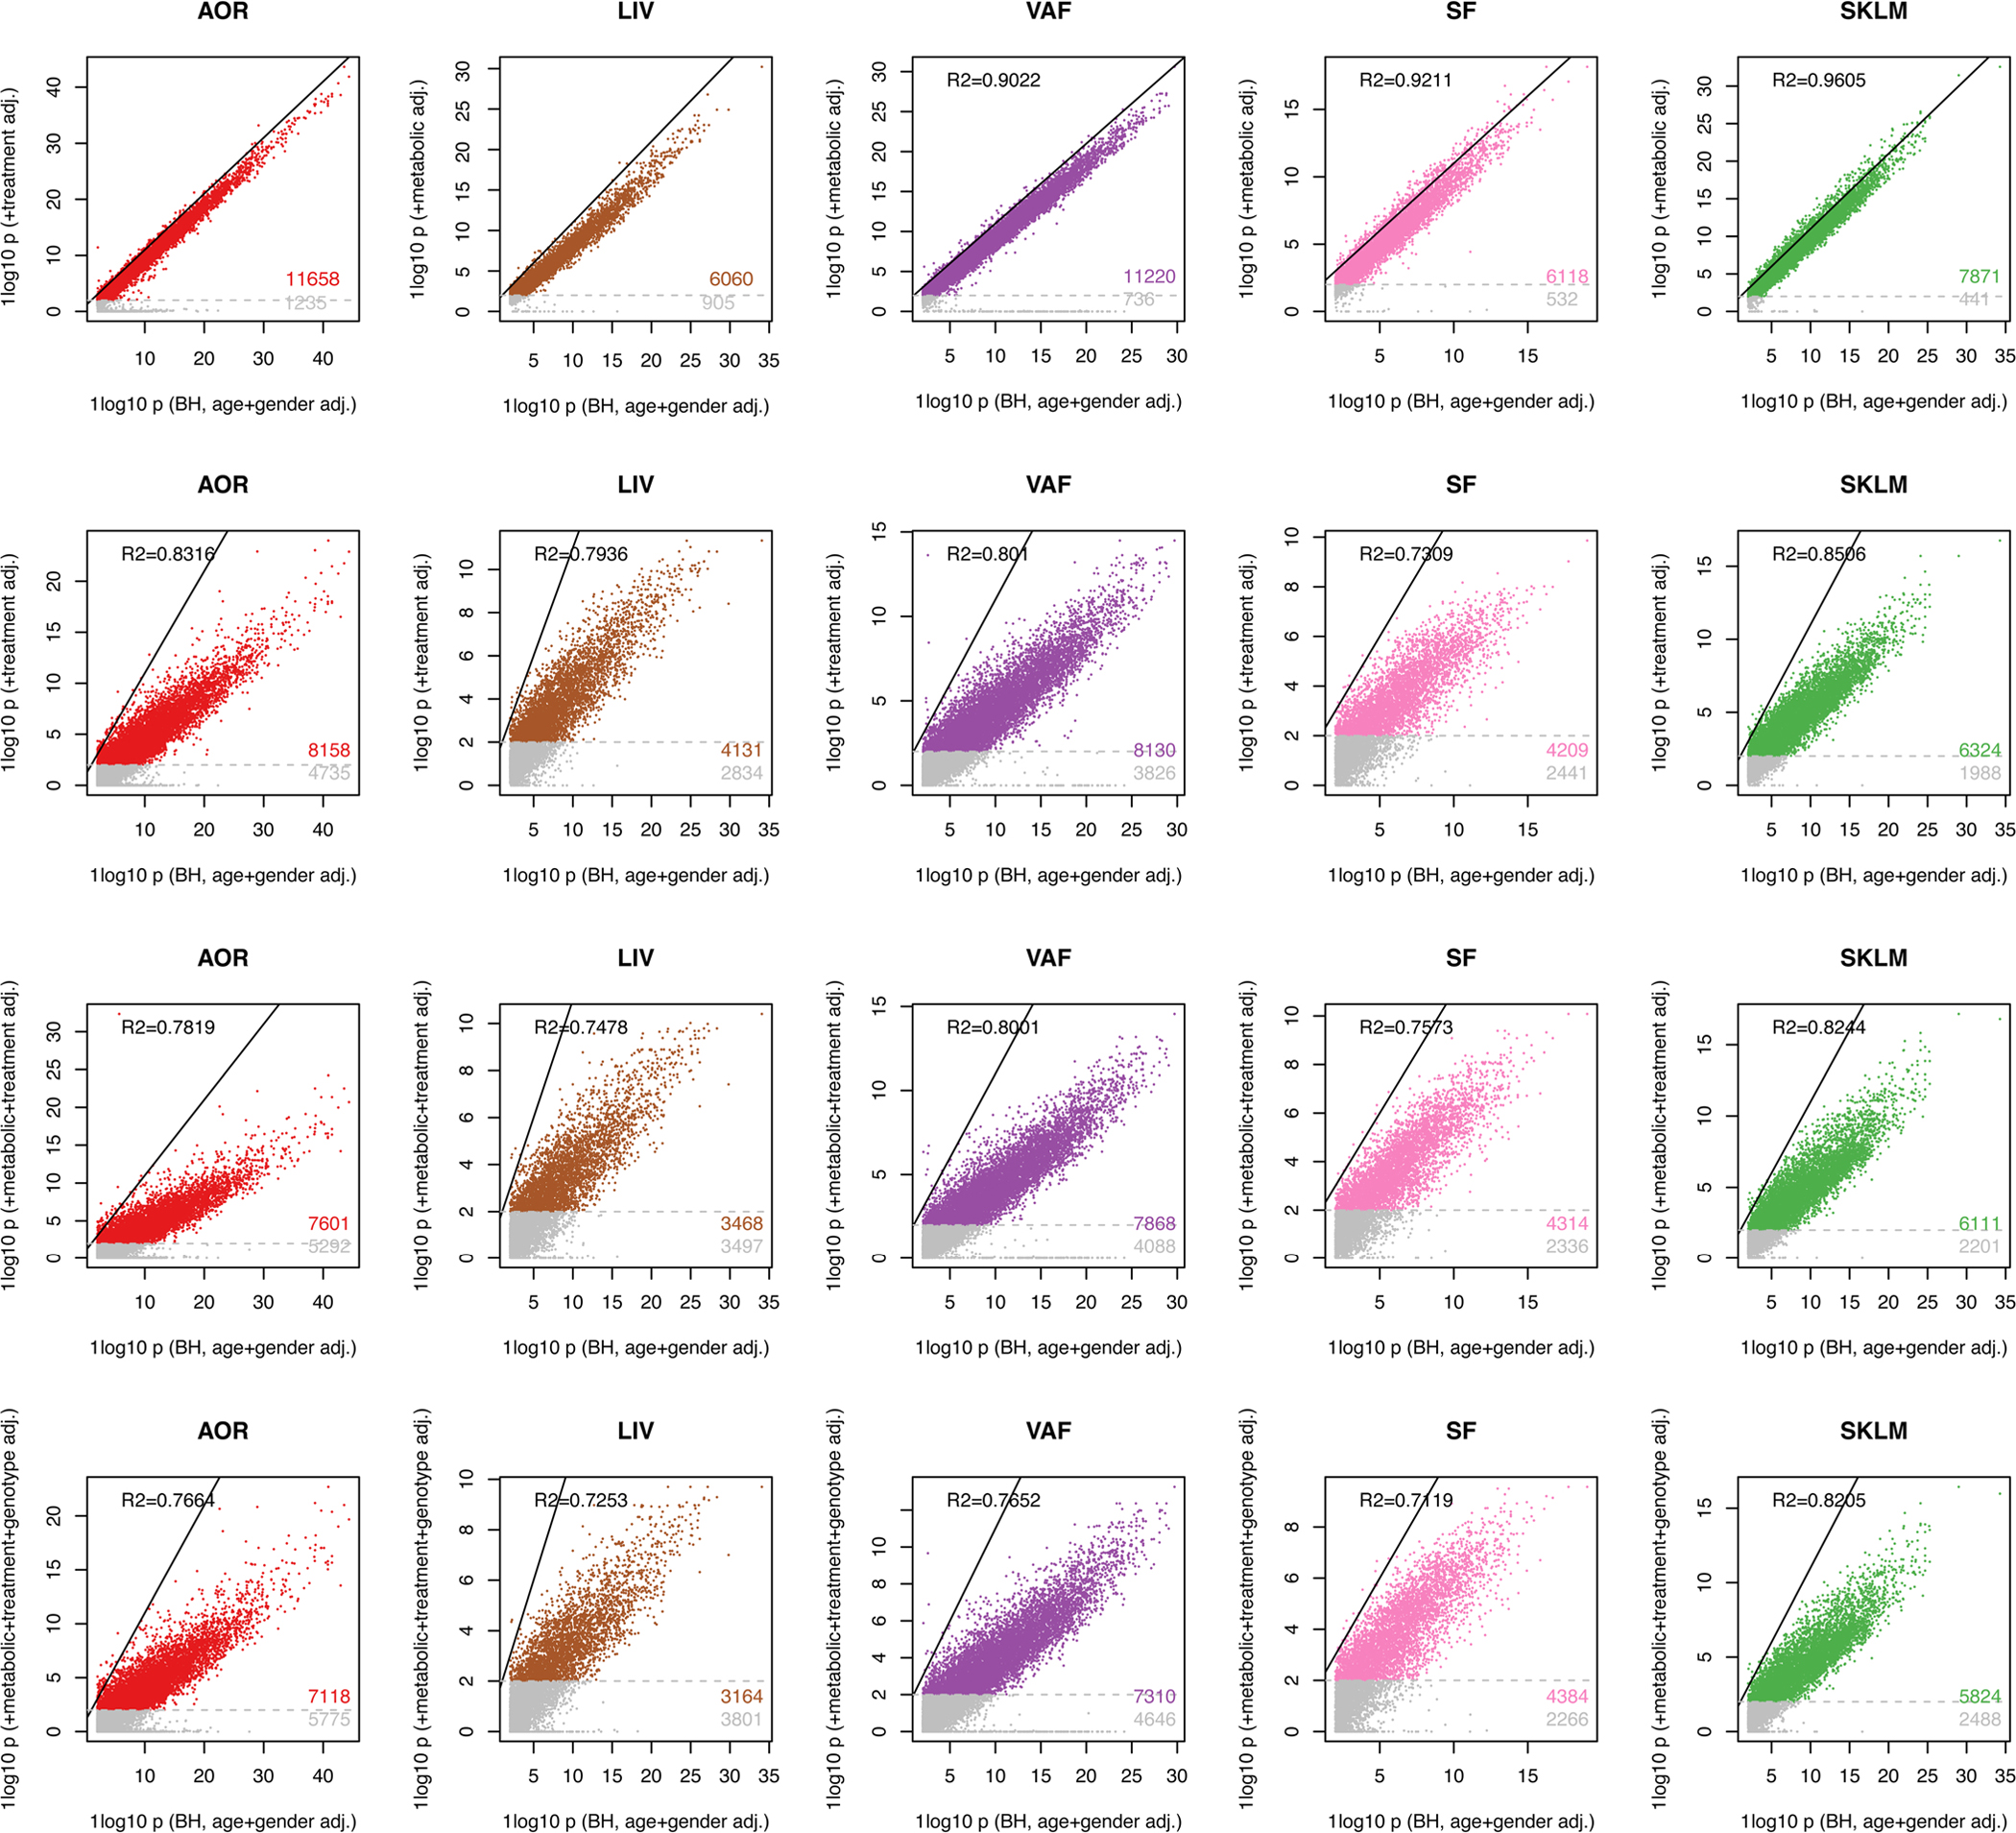
The metabolic featured adjusted for comprised: plasma triglycerides, HbA1c, Waist/Hip ratio, plasma low-density lipoprotein (LDL) cholesterol, plasma high-density lipoprotein (HDL) cholesterol, total cholesterol, and C-reactive protein (CRP). The drug treatments adjusted for comprised as discrete categories: β-blocker, Thrombin inhibitors, Long-acting nitrate, Short-acting nitrates, ACE inhibitors or ARB, Loop diuretic, Thiazide diuretic, Lipid lowerer, Ca-channel blocker, Carvedilol, Anticoagulant, Oral antidiabetics, and Insulin. Representing population genotype, we used the first 4 components from MDS analysis of the SNP array data.
Extended Data Fig. 3 |. PCA plots of STARNET case and control RNA-seq samples.
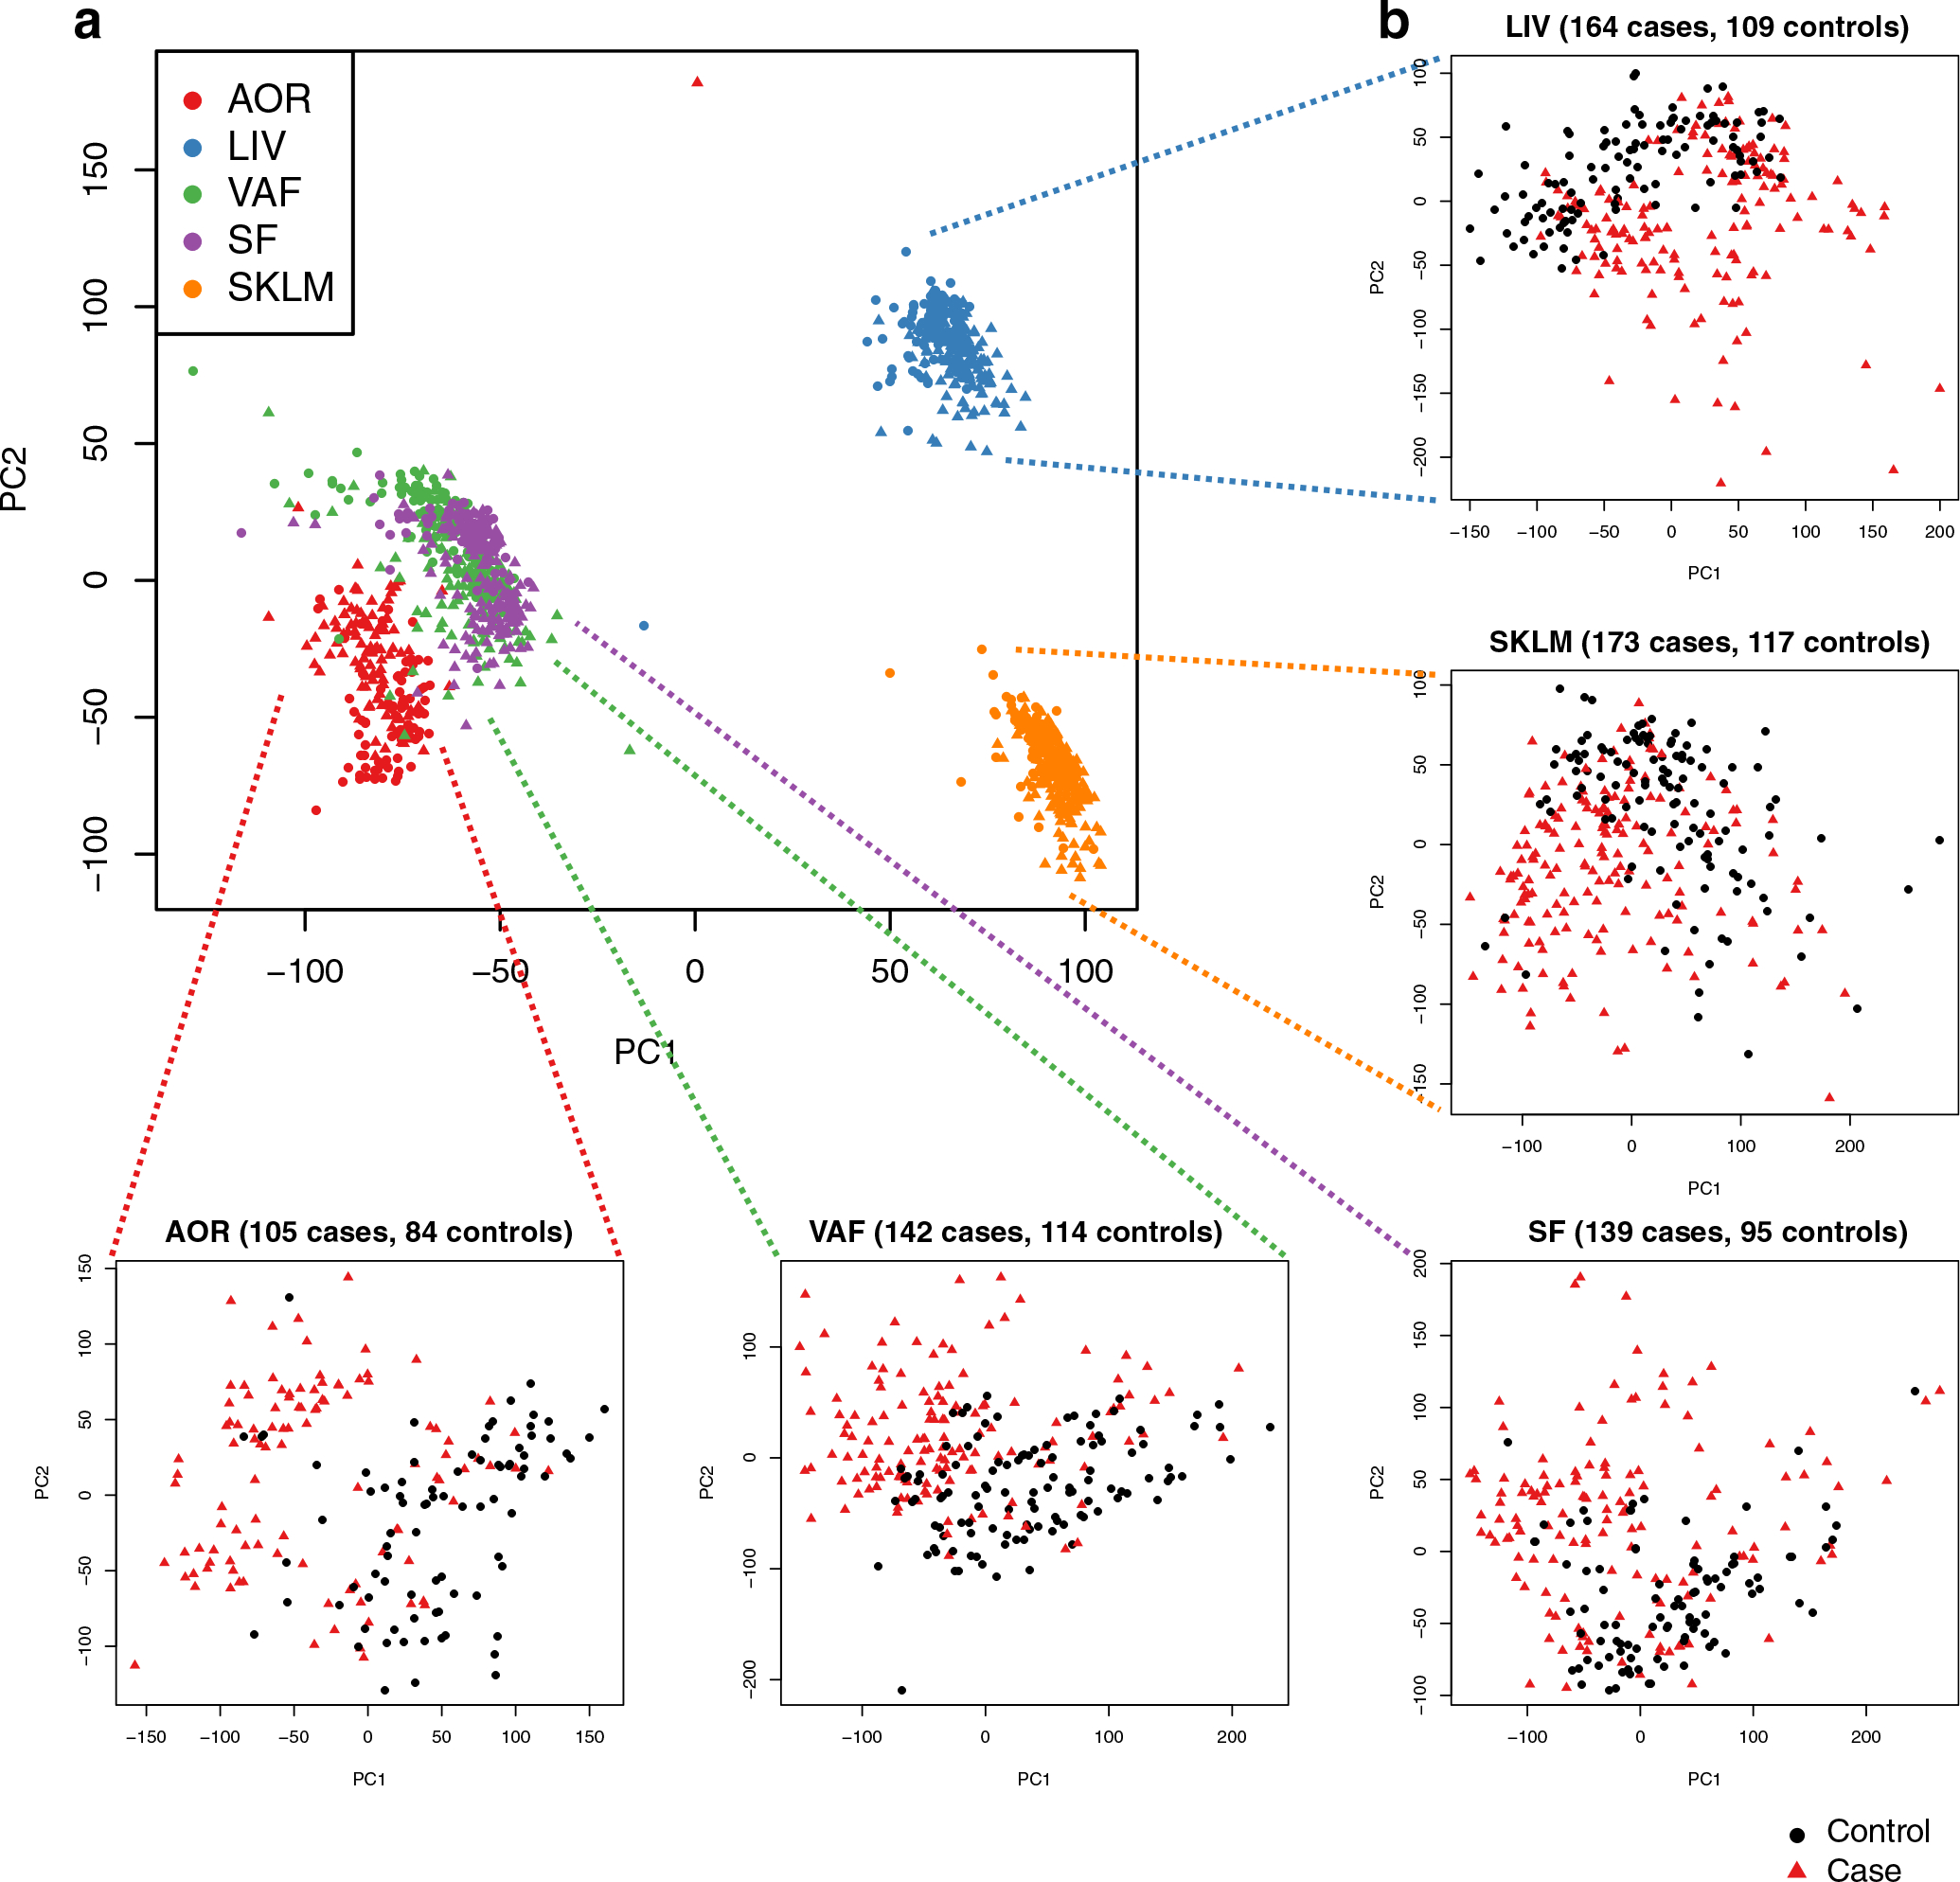
a, PCA plot of RNA sequence data from five tissues sampled in both CAD cases and controls. Cases are represented by circles and controls by triangles. Read counts were normalized by DESeq size factors. b, Zoom in of PCA plots for individual tissues.
Extended Data Fig. 4 |. Schematics of the multiscale network modeling and normalization of RNA-seq data from the STARNET cases.
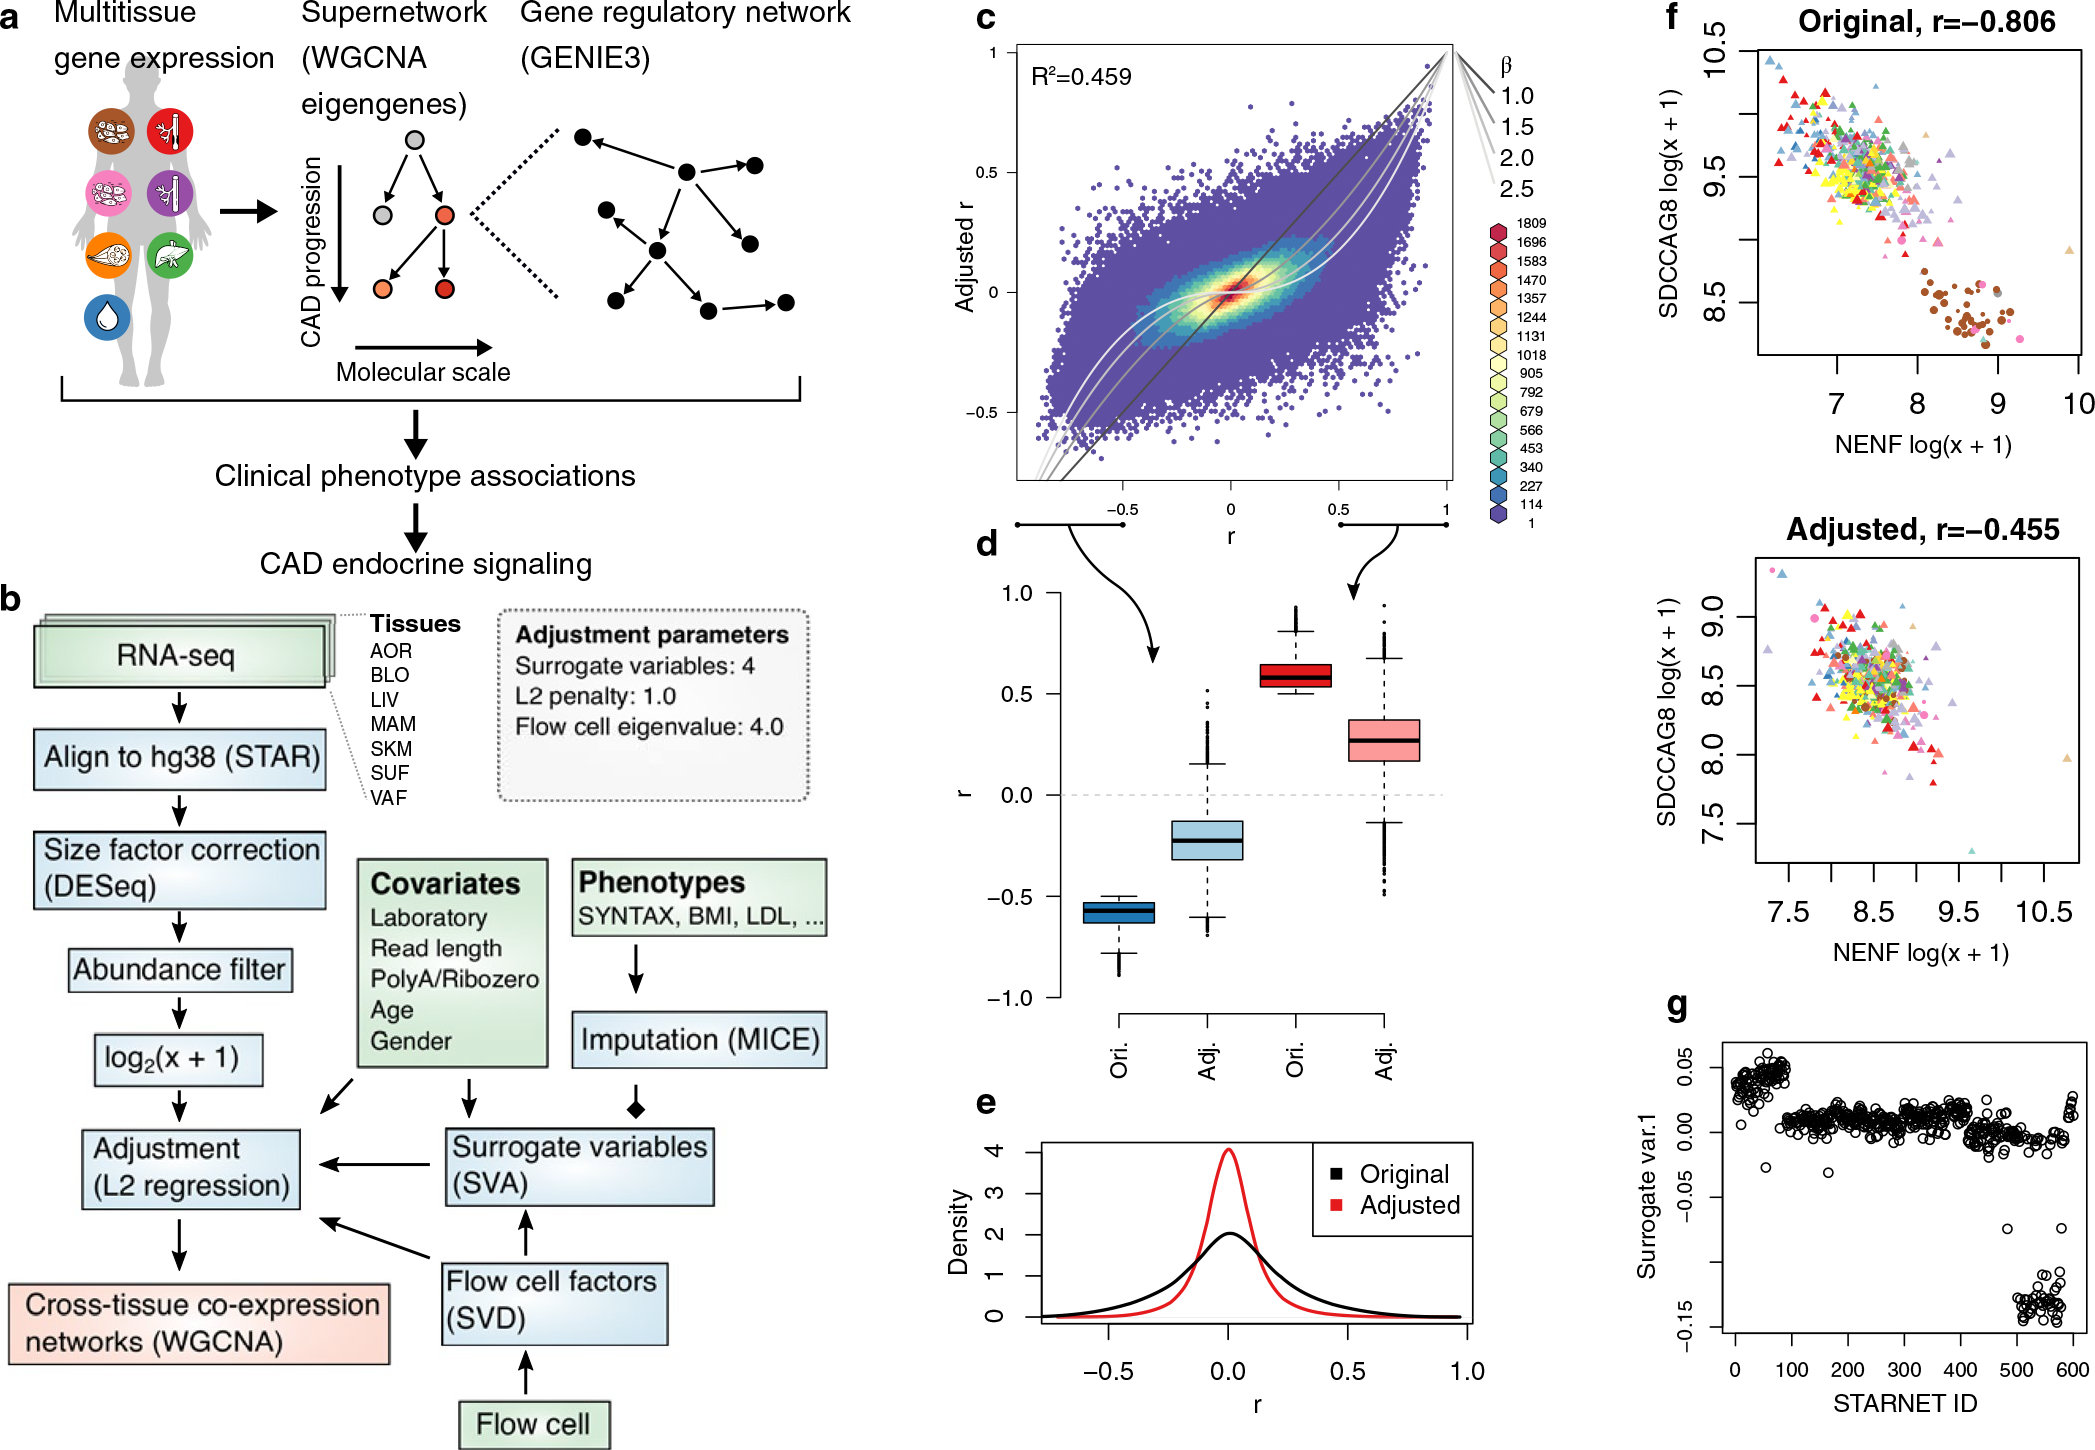
a, Schematic illustration of multiscale network modeling based on RNA-seq from multiple patient tissue samples. b, Analytic flow chart of the RNA-seq analysis. Green, blue and red boxes represent input data, steps of data normalization and network inferences, respectively (see also Methods). c, Typical effects of normalization on Pearson’s correlations between 1,000 randomly selected AOR transcripts. The grey lines indicate equivalence with different β-values used in WGCNA. d, Boxplots of n = 499,500 pairwise correlation coefficients among randomly selected genes. Median center, lower and upper quartile box, and 1.5 interquartile range whiskers. e, Density plots demonstrating the quenching effect on AOR transcript correlations following normalization. f, Representative example of the resolution of a partly spurious correlation most likely due to batch effects from different laboratory. The point shape corresponds to laboratory, colors to RNA-seq flow cell, and size to patient age. g, Surrogate variable used for adjustment that correlated to patient ID and not to other known covariates.
Extended Data Fig. 5 |. Optimization of scale-free properties of co-expression networks across tissues.
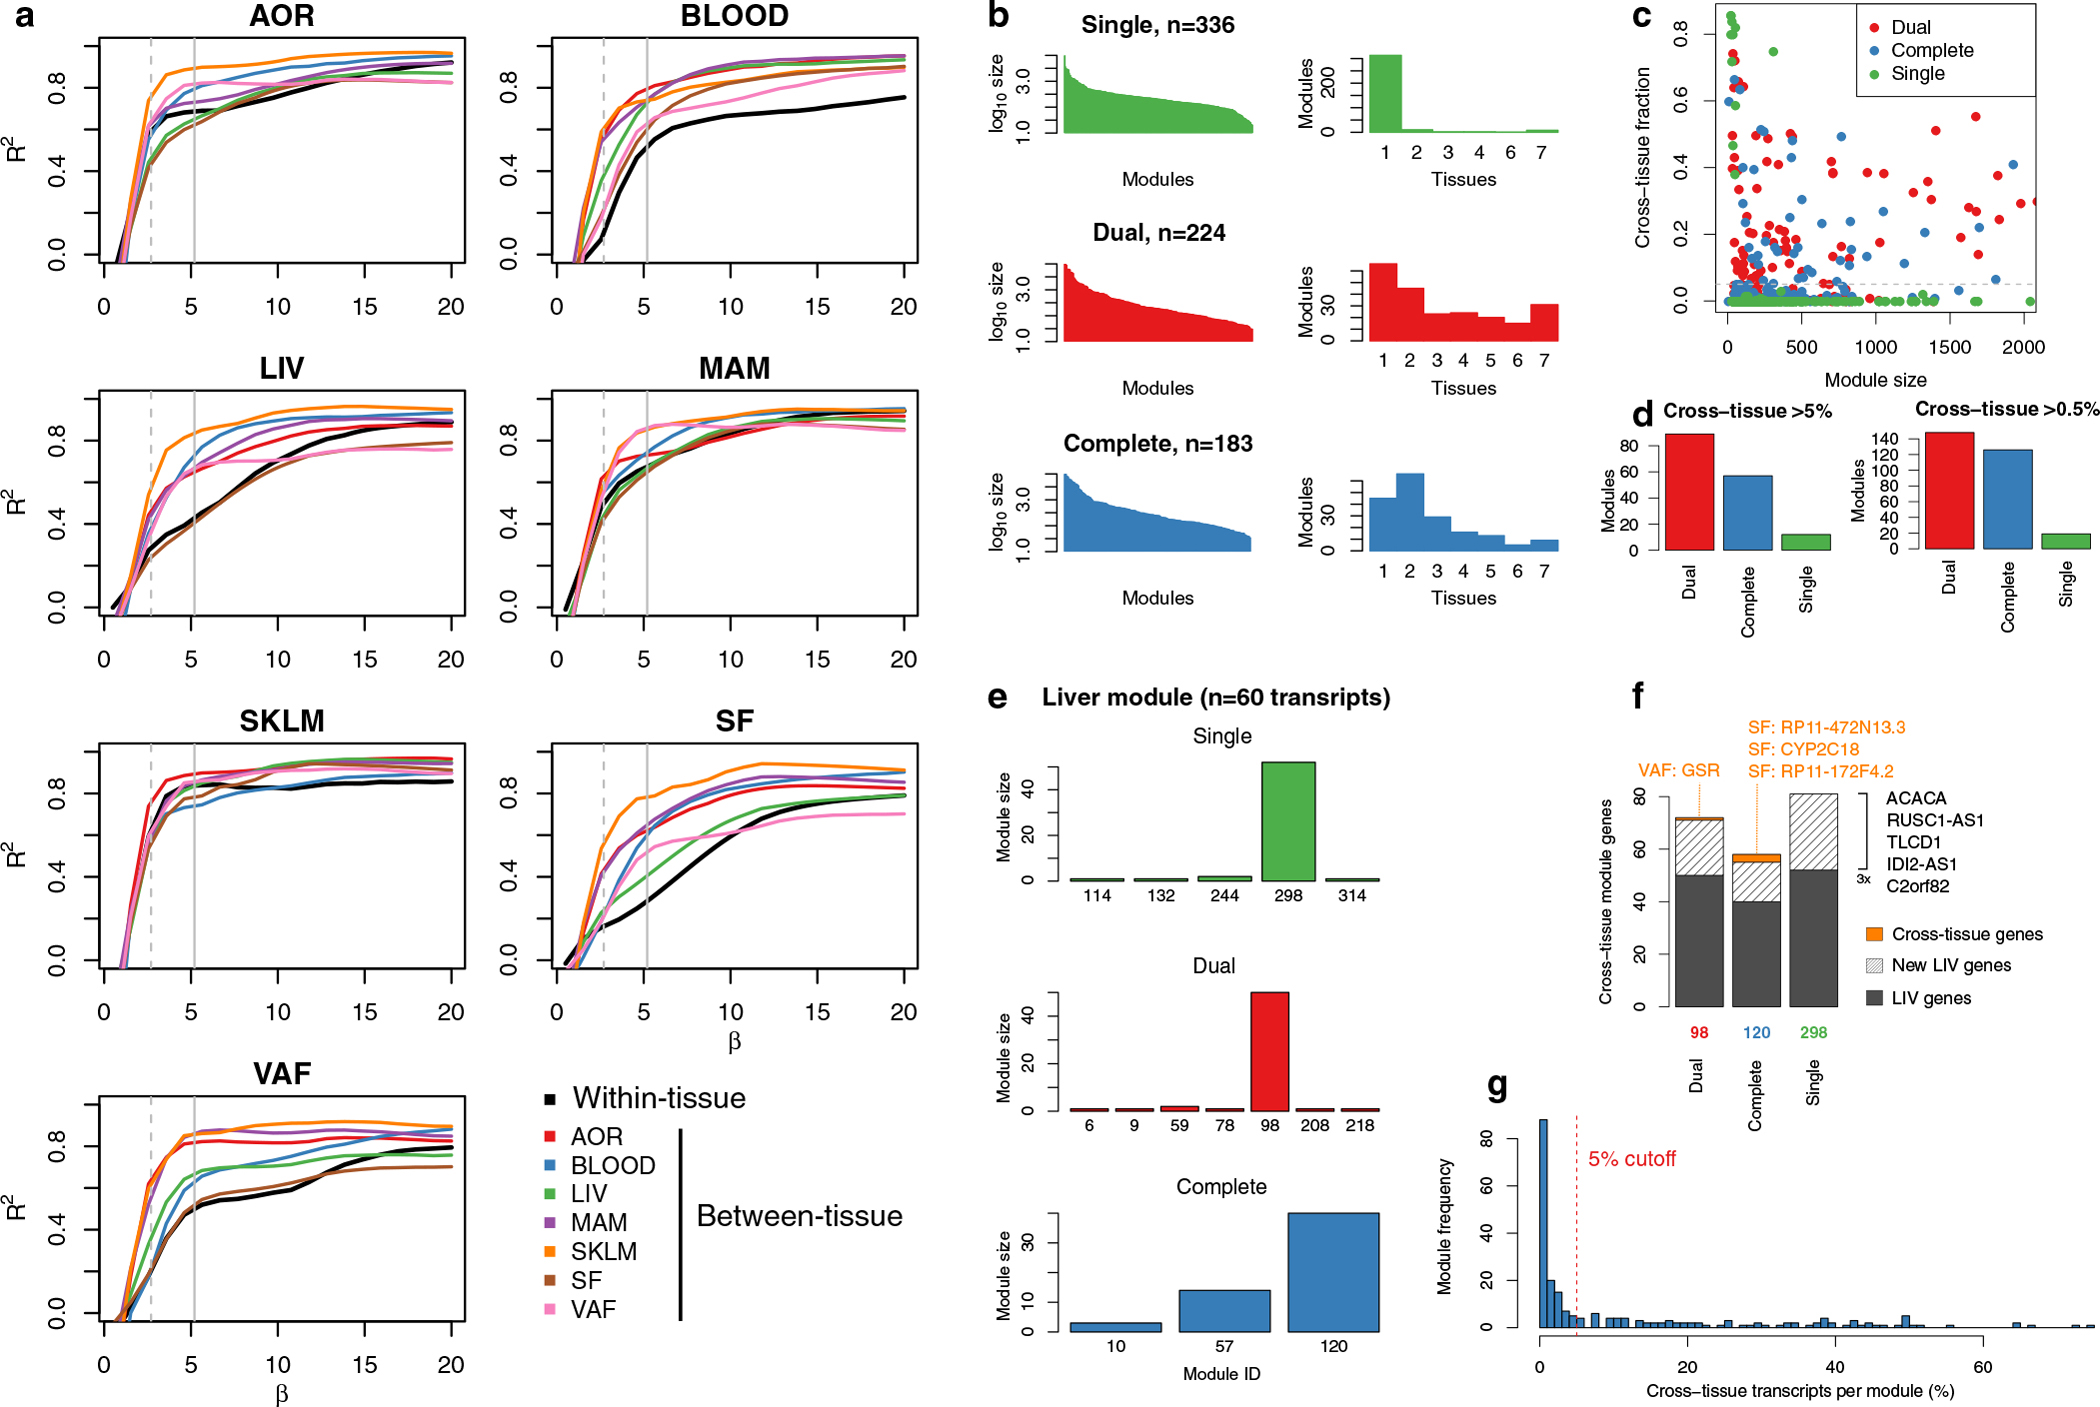
To achieve scale-free properties for both tissue-specific and cross-tissue co-expression networks using weighted gene co-expression network analysis (WGCNA), different β-values (exponentiation parameter of network weights) must be used for gene-gene interactions within and between tissues (Methods). a, β-value calibration curves per tissue and between all tissue combinations, showing the TOM-adjusted scale-free network properties of tissue-specific and cross-tissue networks at different β-values. b, The sizes of co-expression modules (left) and tissue specificity (right) detected using a single (upper panel, green), dual (middle, red) and complete set of pairwise β-values (lower, blue). WGCNA with a single, average β-value for all networks both within and across tissues resulted in 336 predominantly tissue-specific modules. A dual approach with two different β-values: average β-values for networks within tissues (the diagonal in panel c) and for networks across different tissues (off-diagonal β-values in panel c). This resulted in 224 co-expression modules whereof 158 contained genes in ≥2 tissues (70.5%). A complete use of the optimal β-value for each specific pair of tissues (β-values in panel c) resulted in 183 co-expression modules. c, Scatterplot showing the cross-tissue fraction of module transcripts at different module sizes (number of genes). The line indicates the 5% threshold used to define cross-tissue modules. d, Number of detected cross-tissue modules (y-axis) using single, dual and complete β values and the cross-tissue fraction thresholds of 5% (left) and 0.5% (right). e, Detection of a previously characterized and replicated liver-specific co-expression module10 identified from tissue-specific WGCNA of STARNET using a single (top, green), dual (middle, red) and complete (bottom, blue) β-values in the WGCNA across tissues. f, Overlapping genes with liver co-expression module for the most similar module inferred using single, dual and complete β-values with WGCNA across tissues. g, Frequency of co-expression modules with increasing numbers of cross-tissue genes.
Extended Data Fig. 6 |. Cross-tissue co-expression module inference using block-wise WGCNA.
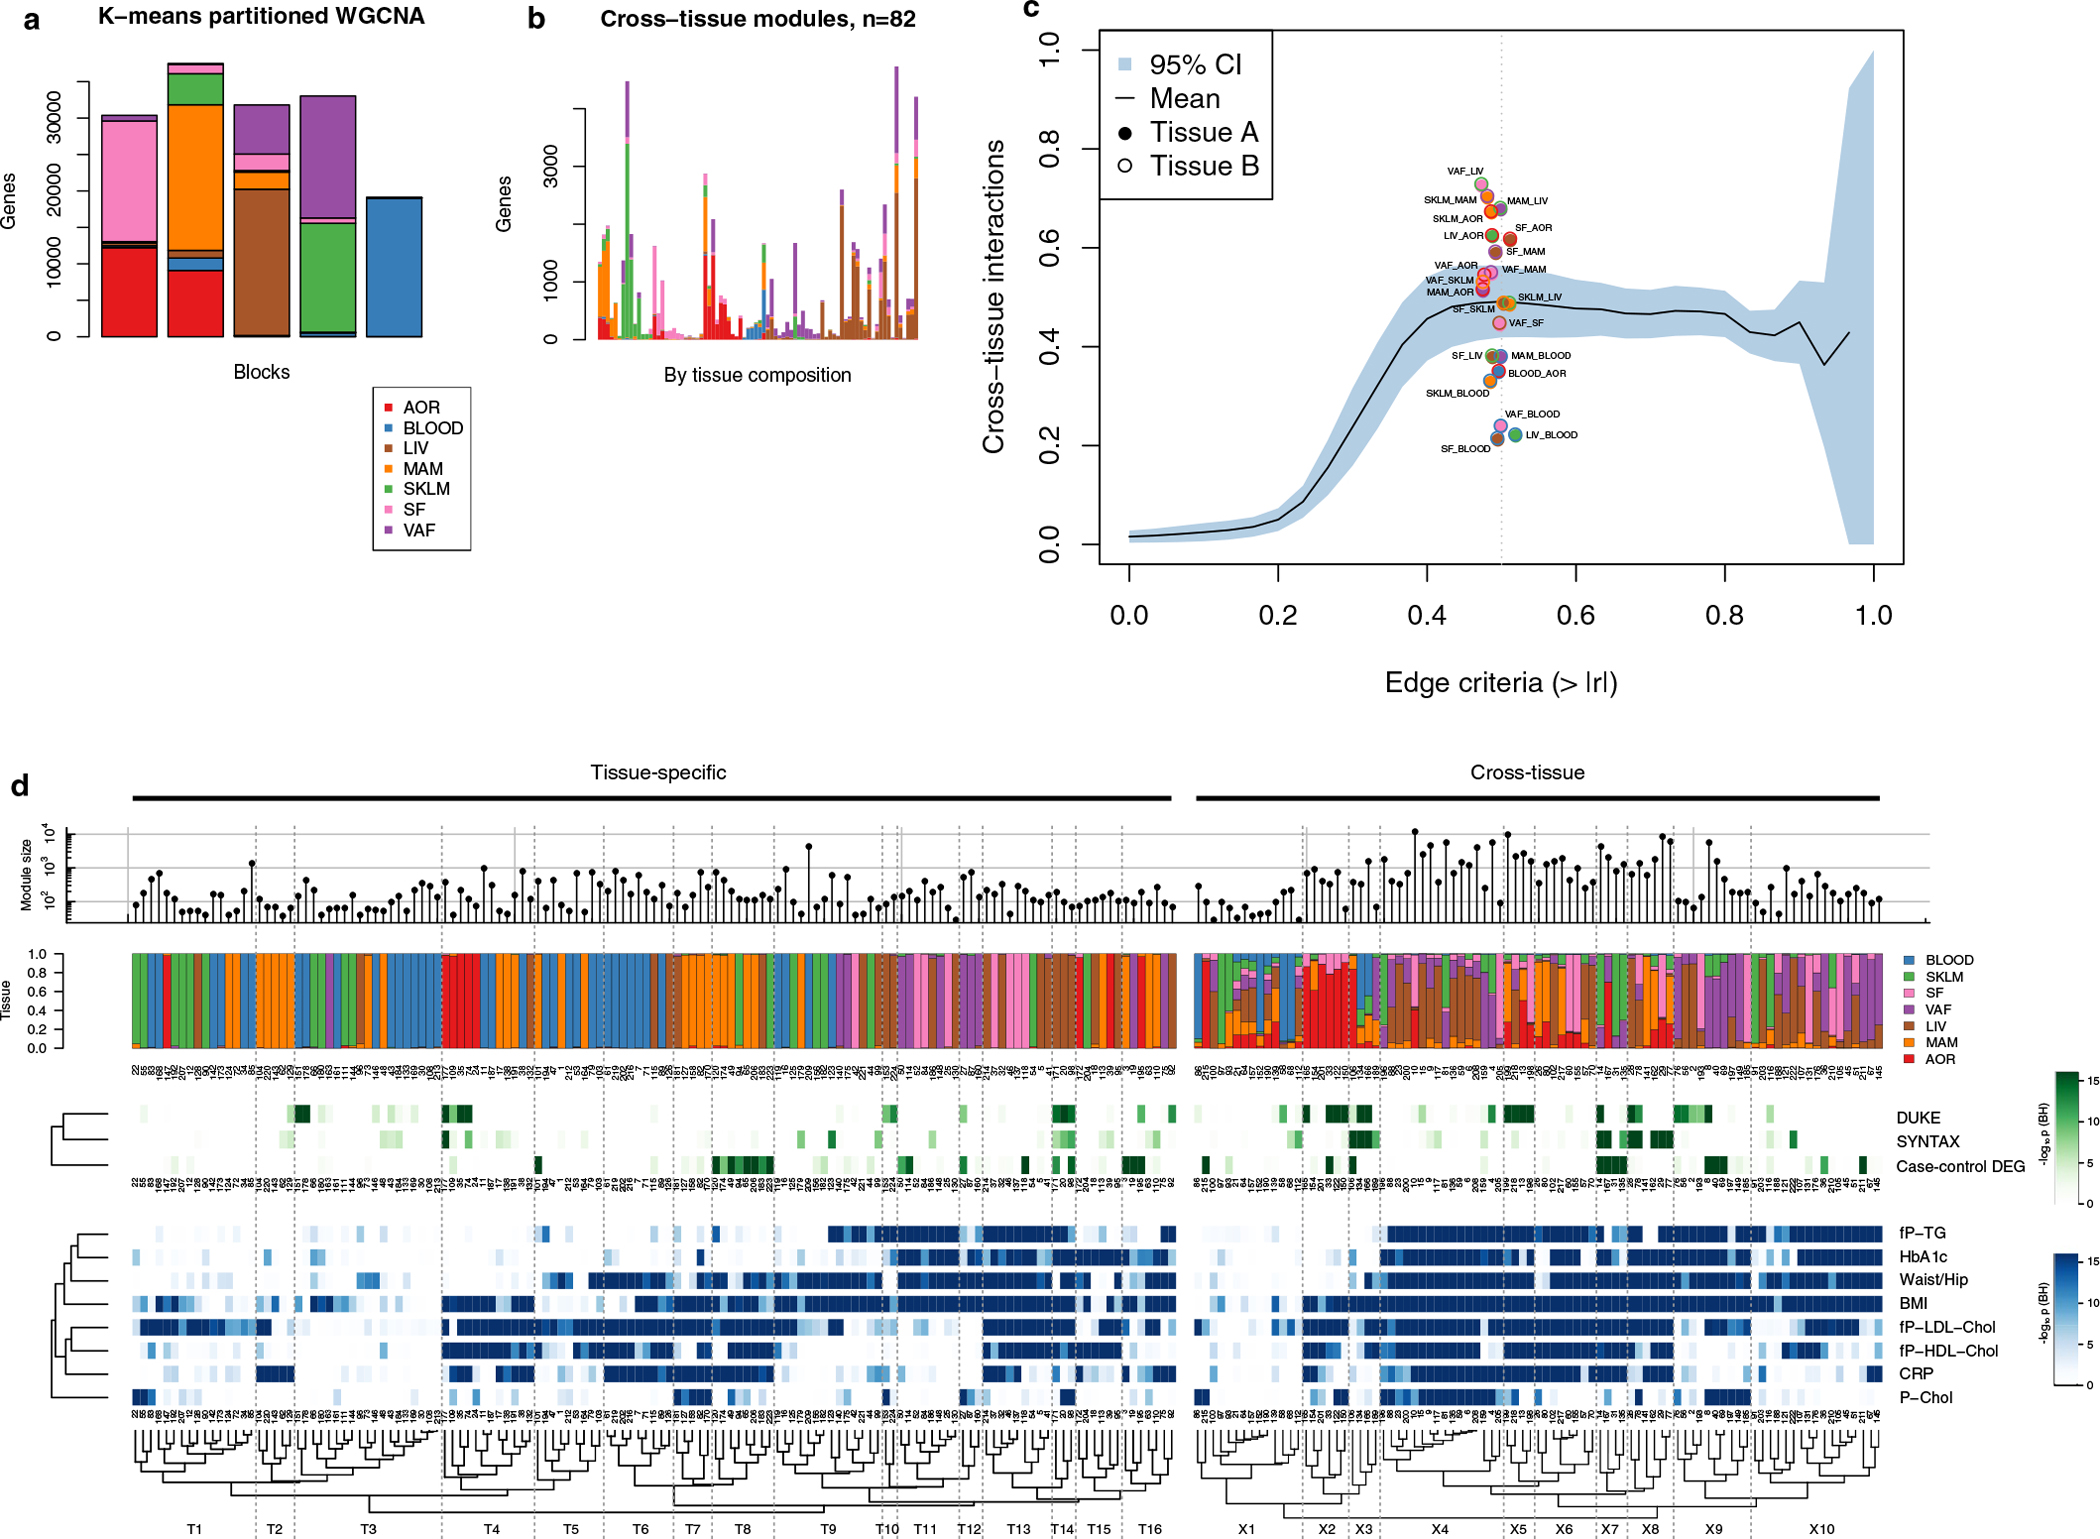
To accommodate the high number of transcripts quantified in the multitissue RNA-seq data, we used block-wise WGCNA, first partitioning transcripts from multiple tissues into 5 blocks using k-means. a, Barplot showing the tissue composition of transcripts segmented into 5 k-means clusters. b, Barplot showing hierarchical clustering of the tissue composition of cross-tissue co-expression modules detected with WGCNA. Each bar corresponds to one co-expression module. Y-axis shows the number of transcripts by tissue. Only modules containing <5,000 transcripts were included. c, Line plot showing the mean fraction of Pearson’s correlation coefficients (y-axis) captured in the 93 cross-tissue modules as a function of cross-tissue correlation cutoff criteria (x-axis). The means are calculated over the 21 tissue pairs in STARNET with the blue area indicating 95% confidence intervals. The vertical dotted line represents a correlation network edge criterium of 0.5, with all supporting tissues pairs plotted as points. d, Hierarchical clustering of co-expression modules, as shown in Fig. 2 d with module IDs.
Extended Data Fig. 7 |. Co-expression network module replication and tissue associations with CAD traits.
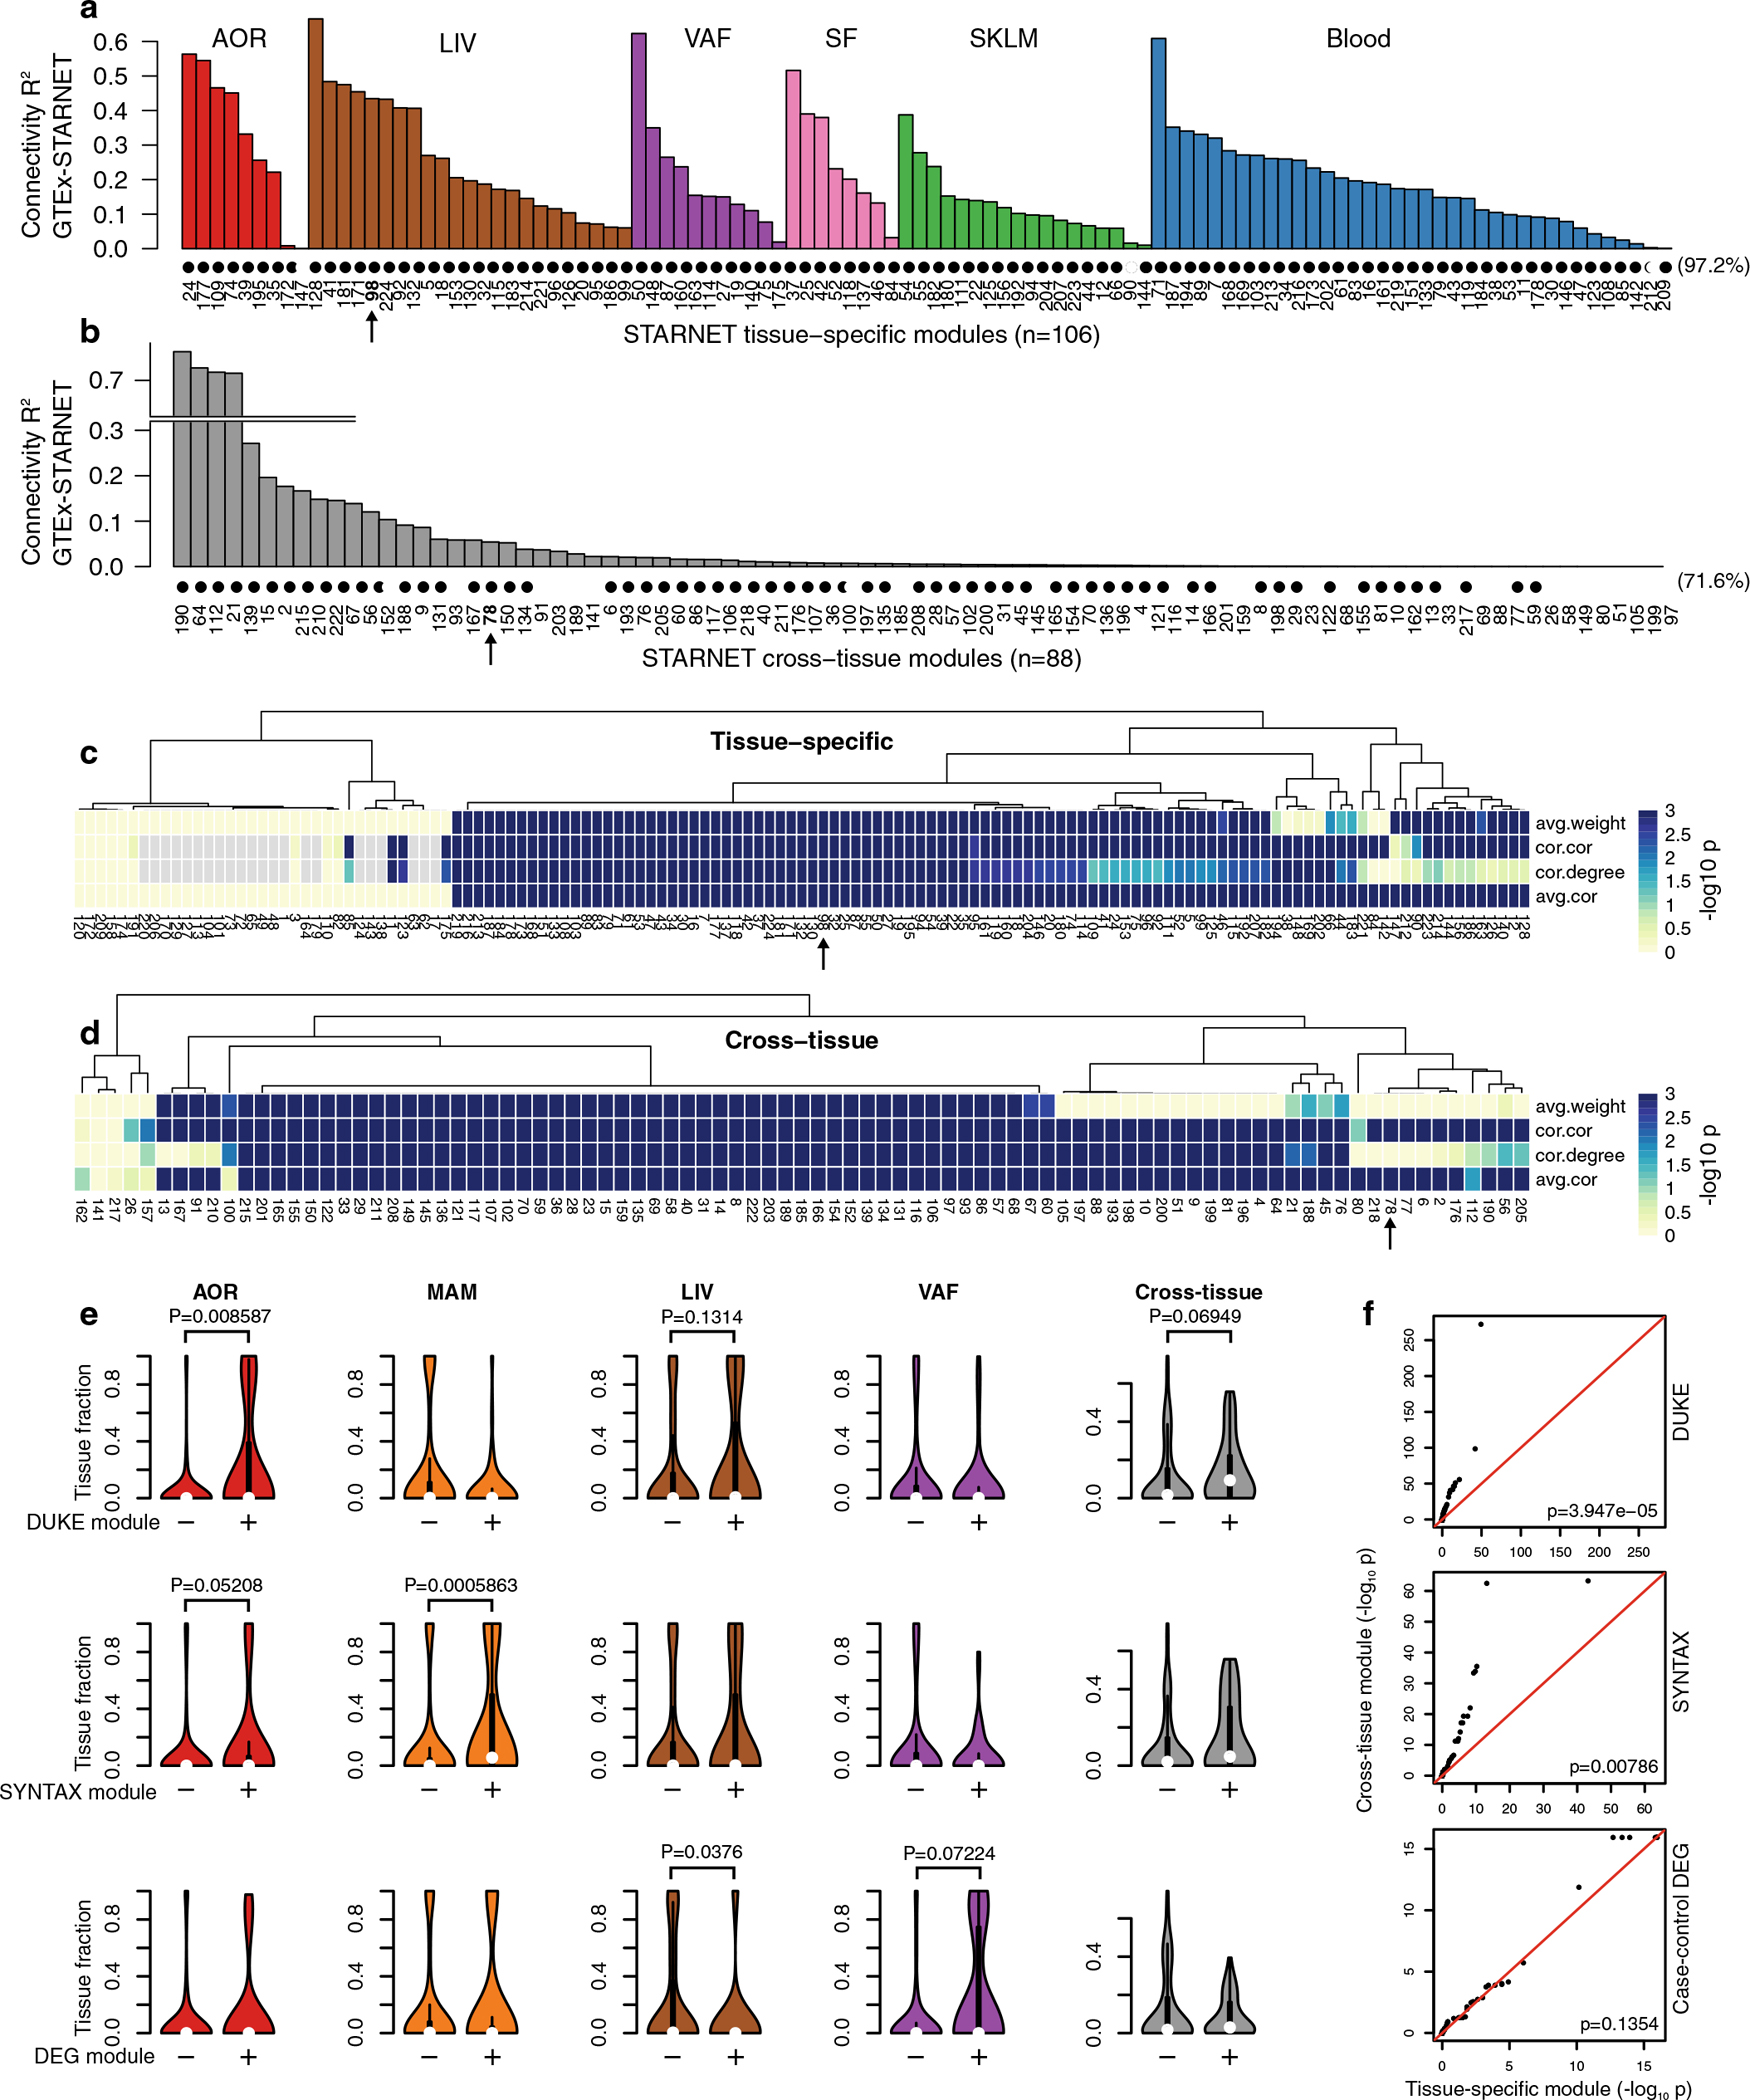
a, Concordance with GTEx RNA-seq data of gene-gene correlation coefficients in tissue-specific modules and in, b, cross-tissue modules, excluding gene-gene interactions within tissue. Modules indicated with black circle showed significant similarity at FDR < 0.05, Bonferroni corrected for n = 224 tests. c, d, In the absence of normal distributions of network correlation coefficients and weights, we also used 4 one-sided permutation tests implemented in the NetRep R package21 for replication of tissue-specific (c) and cross-tissue (d) co-expression modules. The scale is −log10 P values from the permutation test for the 4 different measures of network validation, where the extreme corresponds to P < 0.001 indicating the maximum sensitivity based on 1,000 permutations. e, Violin plots comparing tissue fractions of genes in co-expression modules that are significantly associated (+) with SYNTAX score (upper panel), Duke score (middle panel), or enriched (+) in differentially expressed CAD genes (Hypergeometric test) (Fig. 2c) with the tissue fraction of module genes that are not (−) (FDR < 0.05). P-values comparing the ‘+’and “−”module groups are calculated using Wilcoxon two-sided signed-rank test. For SYNTAX and Duke scores, which estimate arterial atherosclerosis, the co-expression modules were associated by aggregating gene-level P-values using Fisher’s method. f, QQ plots comparing tissue-specific and cross-tissue co-expression module aggregated P-values (Fisher’s method) for Duke (upper panel) and SYNTAX score (middle panel) and module enrichment of CAD DEGs. In contrast to CAD DEGs, cross-tissue modules are significantly more associated with Duke and SYNTAX scores than tissue-specific modules (Wilcoxon rank-sum test).
Extended Data Fig. 8 |. A tutorial of the STARNET browser.
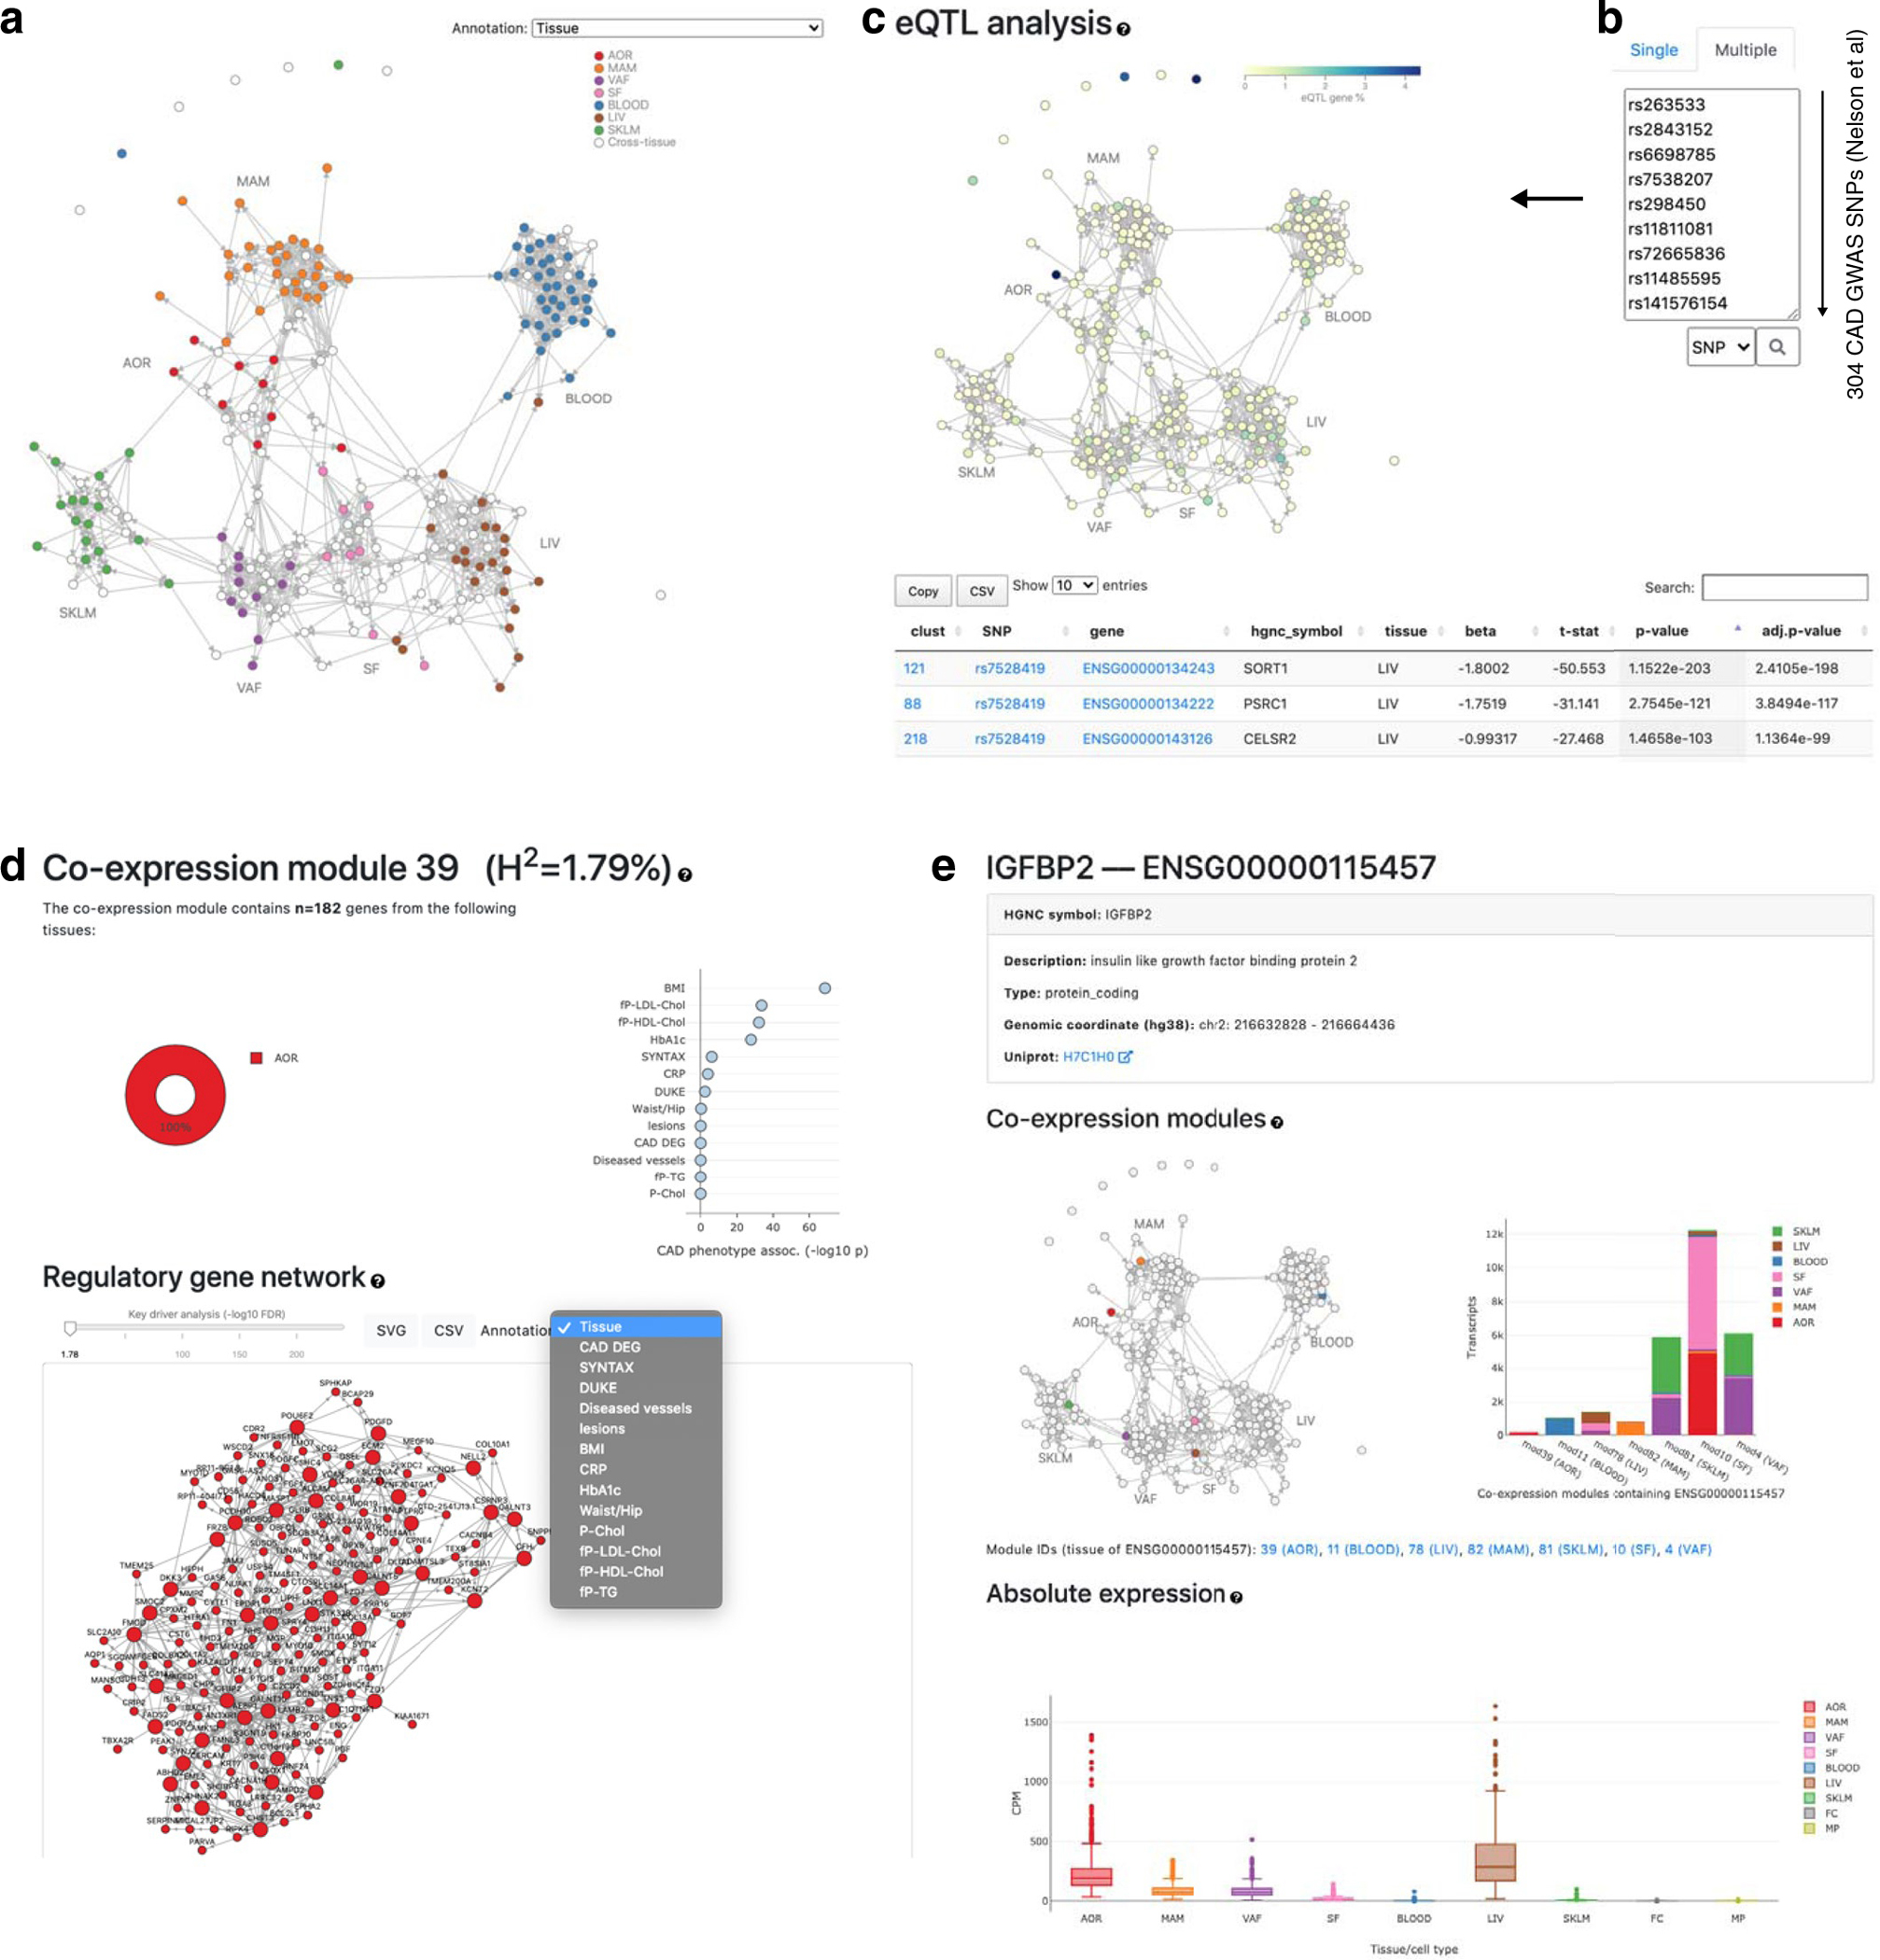
The STARNET browser (http://starnet.mssm.edu) brings the mechanistic framework of GRNs to the bench-side of the individual CMD and CAD scientist for immediate use. In the displayed example, 304 lead SNPs identified by the most recent GWAS of CAD28 are queried using the STARNET browser. Six of these lead SNPs are found as eQTLs in GRN39. Together with plasma LDL/HDL levels, these lead SNPs regulate the activity of GRN39 that in turn governs the extracellular matrix organization in the coronary arteries, thereby affecting CAD development (Fig. 3).
Extended Data Fig. 9 |. Mendelian Randomization to determine gene-regulatory network causality.
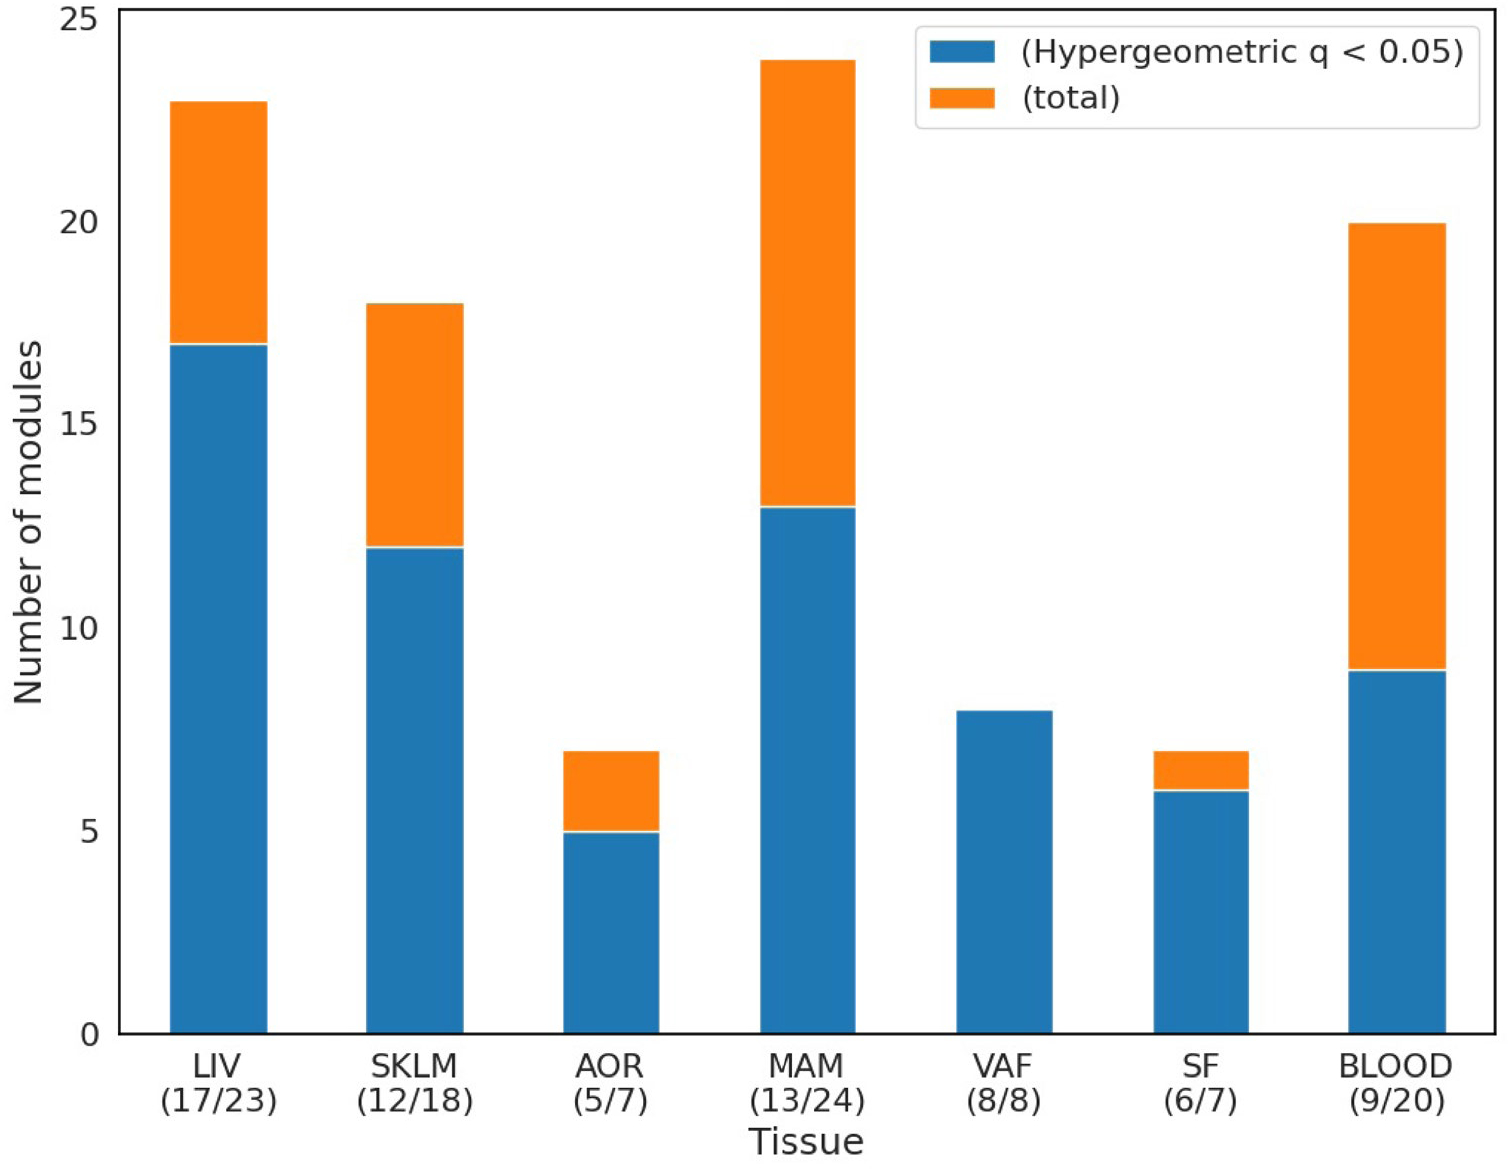
Stack plots showing fraction of tissue-specific GRNs considered causal in MR analysis (Methods). The hypergeom function from the SciPy stats package in Python62 was used to test overlaps with tissue-specific causal networks (blue, Extended Data Table 5) in relation to the total number of GRNs in each STARNET tissue (yellow, FDR < 5% according to Storey and Tibshirani63).
Extended Data Fig. 10 |. Modeling network module eigengene-eigengene interactions in a supernetwork to capture high-level tissue patterns of CAD disease progression.
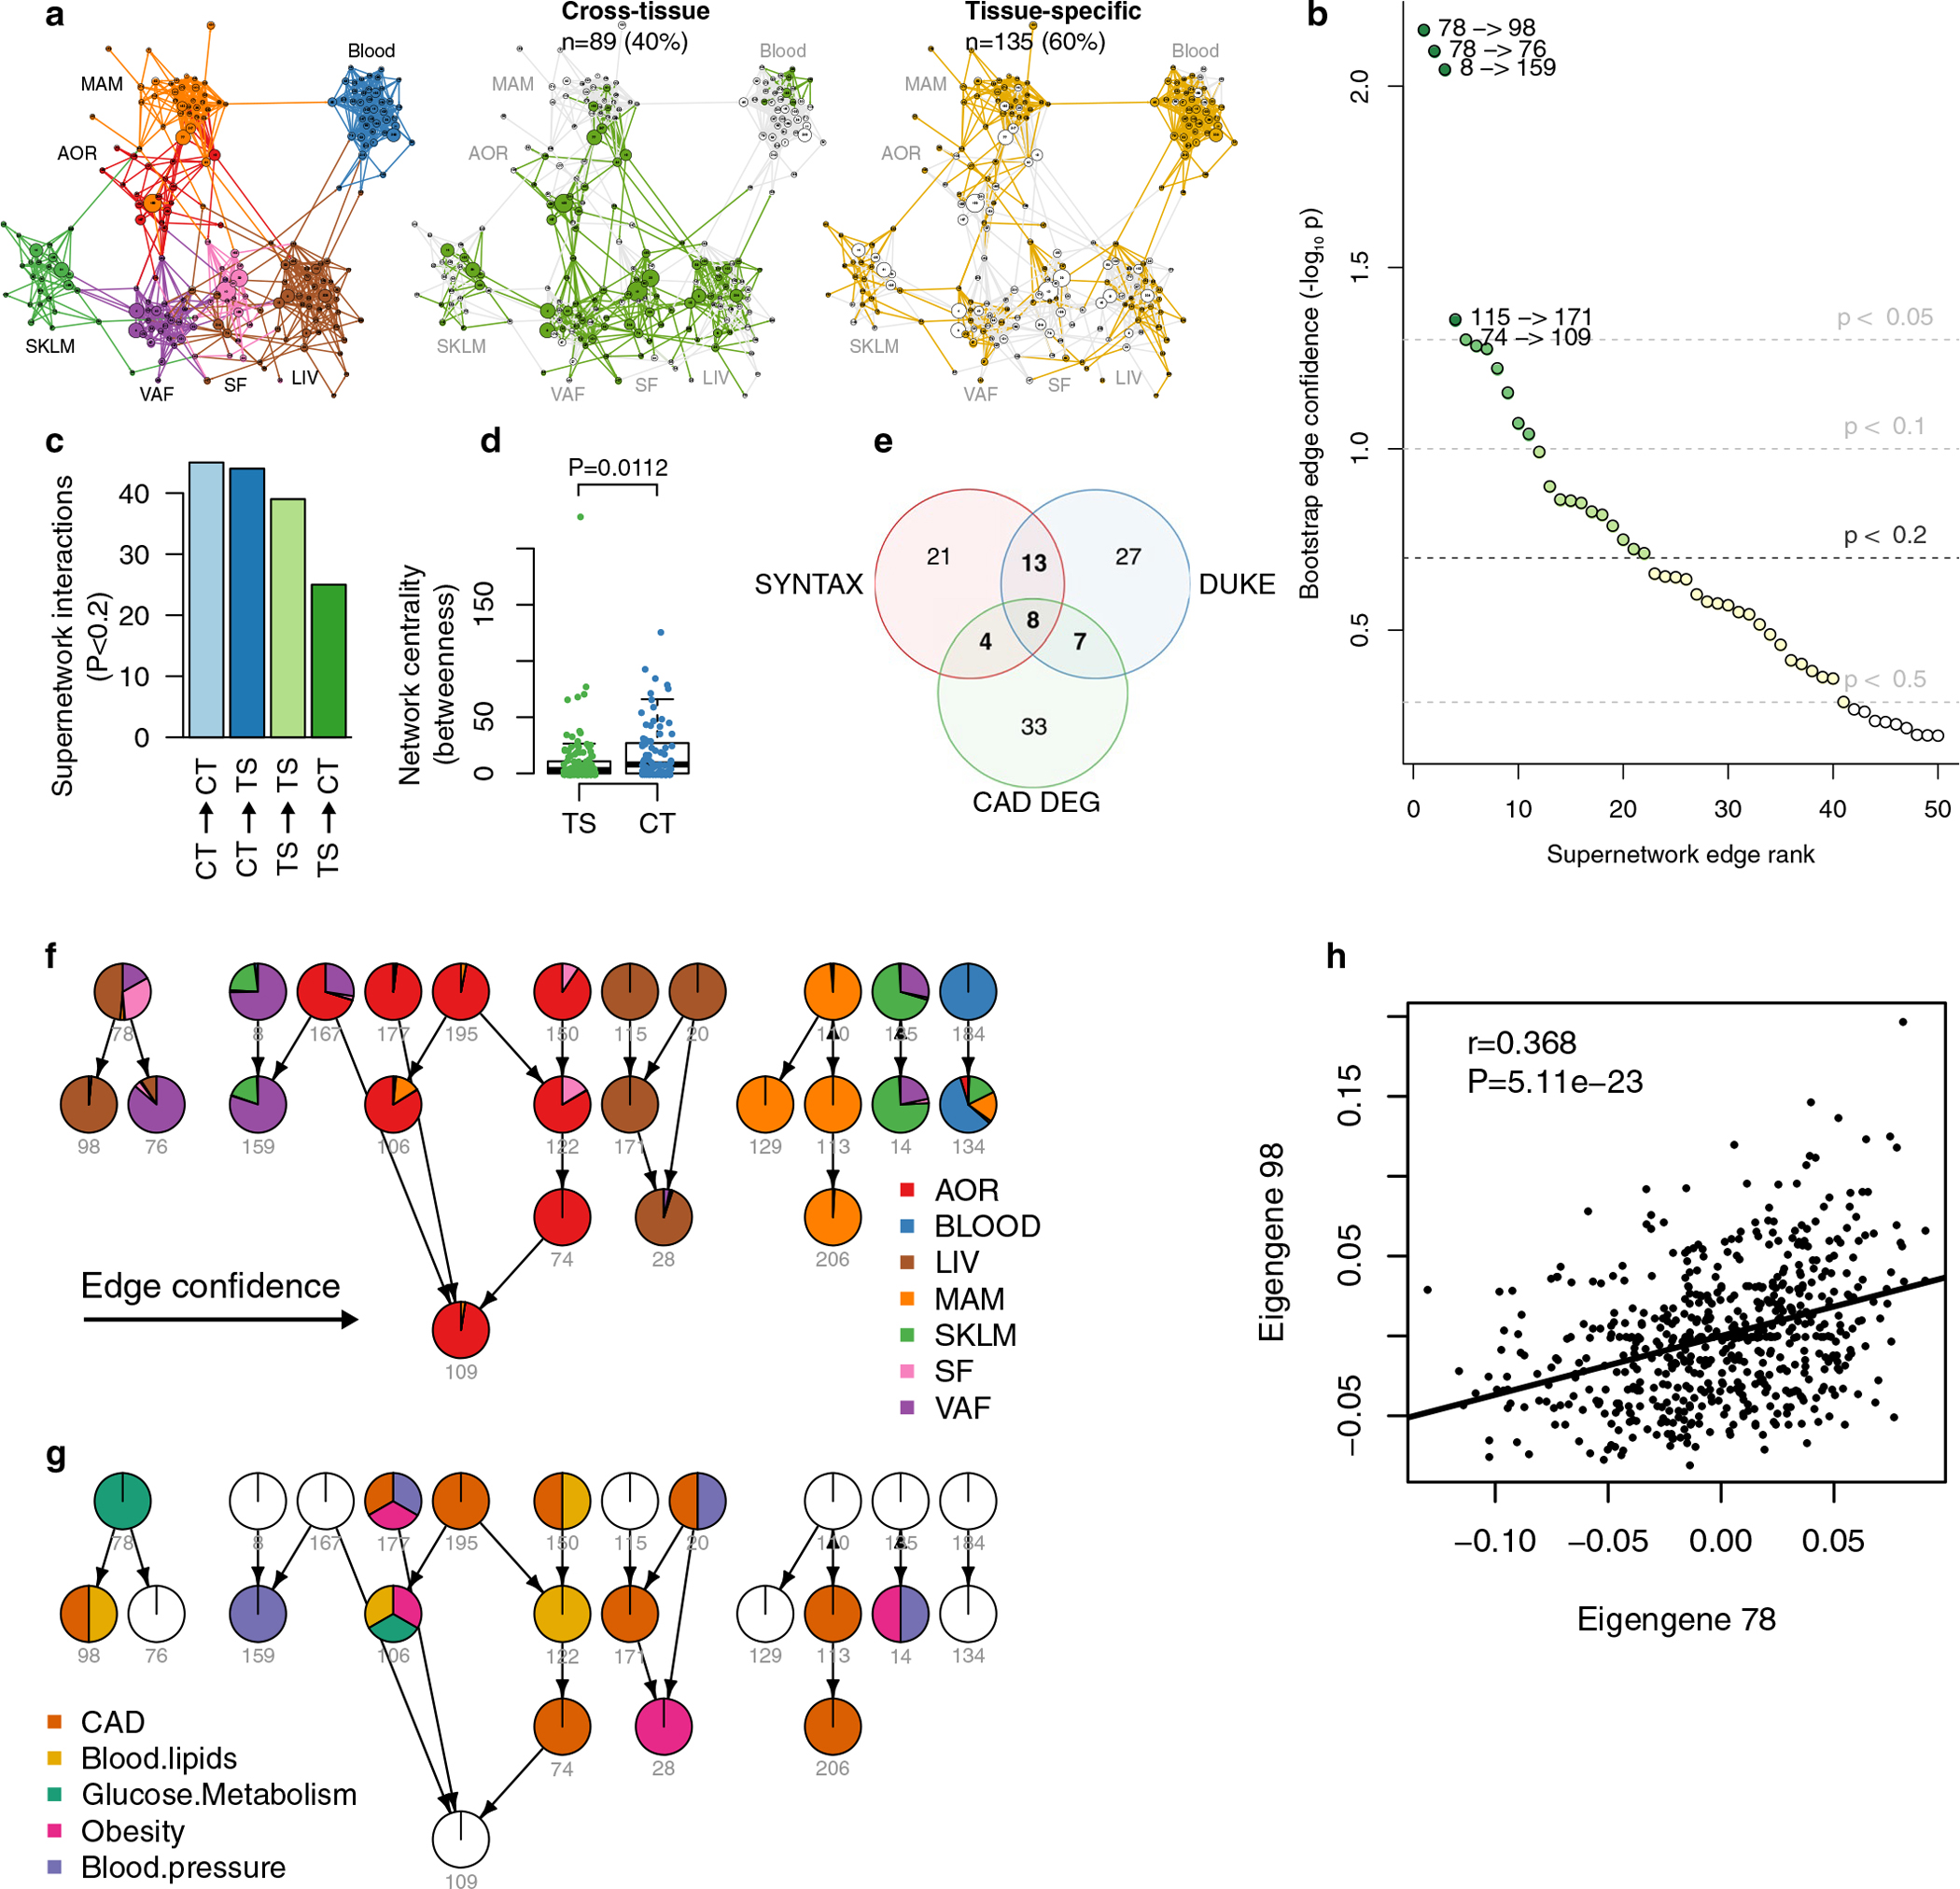
a, Bayesian supernetwork inferred from eigengene values of the 224 STARNET co-expression modules. The likelihood of directed acyclic graphs was assessed using the Bayesian information criteria (BIC) and optimized using fast greedy equivalence search from Tetrad. Network layout was determined by the Fruchterman-Reingold algorithm. Left, colors indicate primary tissues, middle, green indicates cross-tissue network modules and right, yellow indicates tissue-specific network modules. b, Diagram showing bootstrap confidence estimates of supernetwork edges (Methods). Random sets of subjects were drawn and used to infer an ensemble of 1,000 Bayesian networks, from which supernetwork edges were ranked. Bootstrapped P values estimated by 1–frequency of edges in network ensemble. c, Bar plot showing the distribution of 153 statistically robust edges in the supernetwork among the four possible combinations of cross-tissue (CT) and tissue-specific (TS) module interactions. Edge robustness was assessed by bootstrap analysis (M = 10,000) of the full supernetwork of 224 module nodes and 49,952 possible edges (Methods). d, Box plots comparing centrality of cross-tissue modules (n = 89) compared to tissue-specific modules (n = 135). Median center, lower and upper quartile box, 1.5 interquartile range whiskers. The network centrality analysis was based on the betweenness measure, counting the number of shortest paths through each node, performed on a 224×224 matrix of supernetwork eigengene interaction P-values (bootstrap estimates). Comparison by two-sided t test. e, Venn diagram showing 113 GRNs significantly enriched in at least one of 3 CAD clinical measures; 32 GRNs with at least 2 CAD measures, and 8 GRNs with all 3 CAD measures. The CAD measures of the GRNs are enrichment with genes associated with SYNTAX (1) and/or Duke (2) scores (FDR < 0.01) and/or with DEGs in CAD cases versus controls (3). f,g, High-confidence directed edges in the supernetwork (see Methods) detected between 25 of the 32 CAD-associated GRNs with more than two CAD measures (a) colored according to module tissue distribution (f) and enrichment with candidate genes identified by GWAS (g and Fig. 3e). The layout was determined by the Sugiyama algorithm. Indicated below each supernetwork node is the GRN identification number. h, Scatter plot of Pearson correlations between the eigengene values of the most significant edge in the supernetwork between cross-tissue network module 78 and tissue-specific network module 98. P-values were calculated using a two-tailed t-test.
Supplementary Material
Acknowledgements
J.L.M.B. acknowledges research support from NIH R01HL125863, the American Heart Association (A14SFRN20840000), the Swedish Research Council (2018–02529) and the Heart Lung Foundation (20170265) and by AstraZeneca through ICMC, Karolinska Institutet, Sweden. J.L.M.B. and H.S. acknowledge support from the Foundation Leducq (‘PlaqueOmics: Novel Roles of Smooth Muscle and Other Matrix Producing Cells in Atherosclerotic Plaque Stability and Rupture’, 18CVD02; ‘CADgenomics: Understanding CAD Genes’, 12CVD02) and the European Union under grant agreement HEALTH-F2–2013-601456 (‘CVgenes-at-target’). H.S. received grants for a British Heart Foundation (BHF)–German Center of Cardiovascular Research (DZHK) collaboration and from the ERA-NET (‘Druggable-MI-Genes’, 01KL1802) and was supported by grants from the Federal German Ministries (AbCD-Net grant 01ZX1706C, BLOCK-CAD grant 16GW0198K and ModulMax grant ZF4590201BA8) and the DFG as part of the Sonderforschungsbereich CRC 1123 (B2) and the Transregio TRR 267 (B05) as well as the DigiMed Bayern project (DBM-1805–0001). J.C.K. acknowledges research support from the National Institutes of Health (R01HL130423, R01HL135093 and R01HL148167–01A1) and New South Wales health grant RG194194. A.J.L. acknowledges the Foundation Leducq (‘CADgenomics: Understanding CAD Genes’, 12CVD02) and NIH grants R01 HL144651, R01 HL147883, PO1 HL28481 and R01 DK117850. M.S. acknowledges NIH grant HL138193.
Footnotes
Competing interests
J.L.M.B. is the founder of Clinical Gene Networks (CGN). J.L.M.B. (chair) and A.R. are on CGN’s board of directors. J.L.M.B., A.R. and T.M. are shareholders in CGN. J.L.M.B. receives financial compensation as a consultant for CGN. CGN has an invested interest in STARNET that is regulated in an agreement with the Icahn School of Medicine at Mount Sinai. Neither the Icahn School of Medicine at Mount Sinai nor CGN have made claims to results presented in this study. E.E.S. is the CEO of Sema4. C.W. and L.-M.G. are employees of AstraZeneca. No funding for this study was received from Sema4. AstraZeneca supported this study through independent grants to J.L.M.B. at the Karolinska Institutet (ICMC). The remaining authors declare no competing interests.
Supplementary information The online version contains supplementary material available at https://doi.org/10.1038/s44161-021-00009-1.
Peer review information Nature Cardiovascular Research thanks Thomas Quertermous and the other, anonymous, reviewer(s) for their contribution to the peer review of this work.
Reprints and permissions information is available at www.nature.com/reprints.
References
- 1.Kumar V, Hsueh WA & Raman SV Multiorgan, multimodality imaging in cardiometabolic disease. Circ. Cardiovasc. Imaging 10, e005447 (2017). [DOI] [PMC free article] [PubMed] [Google Scholar]
- 2.Rask-Madsen C & Kahn CR Tissue-specific insulin signaling, metabolic syndrome, and cardiovascular disease. Arterioscler. Thromb. Vasc. Biol. 32, 2052–2059 (2012). [DOI] [PMC free article] [PubMed] [Google Scholar]
- 3.Beverly JK & Budoff MJ Atherosclerosis: pathophysiology of insulin resistance, hyperglycemia, hyperlipidemia, and inflammation. J. Diabetes 12, 102–104 (2020). [DOI] [PubMed] [Google Scholar]
- 4.Schadt EE et al. An integrative genomics approach to infer causal associations between gene expression and disease. Nat. Genet. 37, 710–717 (2005). [DOI] [PMC free article] [PubMed] [Google Scholar]
- 5.Schadt EE Molecular networks as sensors and drivers of common human diseases. Nature 461, 218–223 (2009). [DOI] [PubMed] [Google Scholar]
- 6.Schadt EE & Bjorkegren JL NEW: network-enabled wisdom in biology, medicine, and health care. Sci. Transl. Med. 4, 115rv111 (2012). [DOI] [PubMed] [Google Scholar]
- 7.Bjorkegren JL, Kovacic JC, Dudley JT & Schadt EE Genome-wide significant loci: how important are they? Systems genetics to understand heritability of coronary artery disease and other common complex disorders. J. Am. Coll. Cardiol. 65, 830–845 (2015). [DOI] [PMC free article] [PubMed] [Google Scholar]
- 8.Zhang B et al. Integrated systems approach identifies genetic nodes and networks in late-onset Alzheimer’s disease. Cell 153, 707–720 (2013). [DOI] [PMC free article] [PubMed] [Google Scholar]
- 9.Talukdar HA et al. Cross-tissue regulatory gene networks in coronary artery disease. Cell Syst. 2, 196–208 (2016). [DOI] [PMC free article] [PubMed] [Google Scholar]
- 10.Cohain AT et al. An integrative multiomic network model links lipid metabolism to glucose regulation in coronary artery disease. Nat. Commun. 12, 547 (2021). [DOI] [PMC free article] [PubMed] [Google Scholar]
- 11.Marbach D et al. Wisdom of crowds for robust gene network inference. Nat. Methods 9, 796–804 (2012). [DOI] [PMC free article] [PubMed] [Google Scholar]
- 12.van der Wijst MGP, de Vries DH, Brugge H, Westra HJ & Franke L An integrative approach for building personalized gene regulatory networks for precision medicine. Genome Med. 10, 96 (2018). [DOI] [PMC free article] [PubMed] [Google Scholar]
- 13.Zhang B & Horvath S A general framework for weighted gene coexpression network analysis. Stat. Appl. Genet. Mol. Biol. 4, Article17 (2005). [DOI] [PubMed] [Google Scholar]
- 14.Zhang B & Zhu J Identification of key causal regulators in gene networks. Proc. World Congr. Eng 2013 II, 1309–1312 (2013). [Google Scholar]
- 15.Shang MM et al. Lim domain binding 2: a key driver of transendothelial migration of leukocytes and atherosclerosis. Arterioscler. Thromb. Vasc. Biol. 34, 2068–2077 (2014). [DOI] [PubMed] [Google Scholar]
- 16.Wang Y et al. Clonally expanding smooth muscle cells promote atherosclerosis by escaping efferocytosis and activating the complement cascade. Proc. Natl Acad. Sci. USA 117, 15818–15826 (2020). [DOI] [PMC free article] [PubMed] [Google Scholar]
- 17.Marbach D et al. Tissue-specific regulatory circuits reveal variable modular perturbations across complex diseases. Nat. Methods 13, 366–370 (2016). [DOI] [PMC free article] [PubMed] [Google Scholar]
- 18.Wang IM et al. Systems analysis of eleven rodent disease models reveals an inflammatome signature and key drivers. Mol. Syst. Biol. 8, 594 (2012). [DOI] [PMC free article] [PubMed] [Google Scholar]
- 19.Franzen O et al. Cardiometabolic risk loci share downstream cis- and trans-gene regulation across tissues and diseases. Science 353, 827–830 (2016). [DOI] [PMC free article] [PubMed] [Google Scholar]
- 20.Dobrin R et al. Multi-tissue coexpression networks reveal unexpected subnetworks associated with disease. Genome Biol. 10, R55 (2009). [DOI] [PMC free article] [PubMed] [Google Scholar]
- 21.Ritchie SC et al. A scalable permutation approach reveals replication and preservation patterns of network modules in large datasets. Cell Syst. 3, 71–82 (2016). [DOI] [PubMed] [Google Scholar]
- 22.Aibar S et al. SCENIC: single-cell regulatory network inference and clustering. Nat. Methods 14, 1083–1086 (2017). [DOI] [PMC free article] [PubMed] [Google Scholar]
- 23.Huynh-Thu VA, Irrthum A, Wehenkel L & Geurts P Inferring regulatory networks from expression data using tree-based methods. PLoS ONE 5, e12776 (2010). [DOI] [PMC free article] [PubMed] [Google Scholar]
- 24.Nelson CP et al. Association analyses based on false discovery rate implicate new loci for coronary artery disease. Nat. Genet. 49, 1385–1391 (2017). [DOI] [PubMed] [Google Scholar]
- 25.Ghazalpour A et al. Hybrid mouse diversity panel: a panel of inbred mouse strains suitable for analysis of complex genetic traits. Mamm. Genome 23, 680–692 (2012). [DOI] [PMC free article] [PubMed] [Google Scholar]
- 26.Zeng L et al. Contribution of gene regulatory networks to heritability of coronary artery disease. J. Am. Coll. Cardiol. 73, 2946–2957 (2019). [DOI] [PMC free article] [PubMed] [Google Scholar]
- 27.Yao DW, O’Connor LJ, Price AL & Gusev A Quantifying genetic effects on disease mediated by assayed gene expression levels. Nat. Genet. 52, 626–633 (2020). [DOI] [PMC free article] [PubMed] [Google Scholar]
- 28.Buniello A et al. The NHGRI-EBI GWAS Catalog of published genome-wide association studies, targeted arrays and summary statistics 2019. Nucleic Acids Res. 47, D1005–D1012 (2019). [DOI] [PMC free article] [PubMed] [Google Scholar]
- 29.Langfelder P & Horvath S Eigengene networks for studying the relationships between co-expression modules. BMC Syst. Biol. 1, 54 (2007). [DOI] [PMC free article] [PubMed] [Google Scholar]
- 30.Chickering DM Optimal structure identification with greedy search. J. Mach. Learn. Res. 3, 507–554 (2002). [Google Scholar]
- 31.Seldin MM et al. A strategy for discovery of endocrine interactions with application to whole-body metabolism. Cell Metab. 27, 1138–1155 (2018). [DOI] [PMC free article] [PubMed] [Google Scholar]
- 32.GTEx Consortium. Human genomics. The Genotype–Tissue Expression (GTEx) pilot analysis: multitissue gene regulation in humans. Science 348, 648–660 (2015). [DOI] [PMC free article] [PubMed] [Google Scholar]
- 33.Greenawalt DM et al. A survey of the genetics of stomach, liver, and adipose gene expression from a morbidly obese cohort. Genome Res. 21, 1008–1016 (2011). [DOI] [PMC free article] [PubMed] [Google Scholar]
- 34.Sabatine MS PCSK9 inhibitors: clinical evidence and implementation. Nat. Rev. Cardiol. 16, 155–165 (2019). [DOI] [PubMed] [Google Scholar]
- 35.von Scheidt M et al. Applications and limitations of mouse models for understanding human atherosclerosis. Cell Metab. 25, 248–261 (2017). [DOI] [PMC free article] [PubMed] [Google Scholar]
- 36.Deshmukh AS et al. Proteomics-based comparative mapping of the secretomes of human brown and white adipocytes reveals EPDR1 as a novel batokine. Cell Metab. 30, 963–975 (2019). [DOI] [PubMed] [Google Scholar]
- 37.Jones PD et al. JCAD, a gene at the 10p11 coronary artery disease locus, regulates hippo signaling in endothelial cells. Arterioscler. Thromb. Vasc. Biol. 38, 1711–1722 (2018). [DOI] [PMC free article] [PubMed] [Google Scholar]
- 38.Davidson EH Emerging properties of animal gene regulatory networks. Nature 468, 911–920 (2010). [DOI] [PMC free article] [PubMed] [Google Scholar]
- 39.Kauffman S Gene regulation networks: a theory for their global structure and behaviors. Curr. Top. Dev. Biol. 6, 145–182 (1971). [DOI] [PubMed] [Google Scholar]
- 40.Hastie T, Tibshirani R & Friedman JH The Elements of Statistical Learning: Data Mining, Inference, and Prediction 2nd edn. (Springer, 2009). [Google Scholar]
- 41.Leek JT, Johnson WE, Parker HS, Jaffe AE & Storey JD The sva package for removing batch effects and other unwanted variation in high-throughput experiments. Bioinformatics 28, 882–883 (2012). [DOI] [PMC free article] [PubMed] [Google Scholar]
- 42.Buuren SV & Groothuis-Oudshoorn K mice: multivariate imputation by chained equations in R. J. Stat. Softw. 45, 1–67 (2011). [Google Scholar]
- 43.Love MI, Huber W & Anders S Moderated estimation of fold change and dispersion for RNA-seq data with DESeq2. Genome Biol. 15, 550 (2014). [DOI] [PMC free article] [PubMed] [Google Scholar]
- 44.Dobin A et al. STAR: ultrafast universal RNA-seq aligner. Bioinformatics 29, 15–21 (2013). [DOI] [PMC free article] [PubMed] [Google Scholar]
- 45.Langfelder P & Horvath S WGCNA: an R package for weighted correlation network analysis. BMC Bioinformatics 9, 559 (2008). [DOI] [PMC free article] [PubMed] [Google Scholar]
- 46.Mi H, Muruganujan A, Ebert D, Huang X & Thomas PD PANTHER version 14: more genomes, a new PANTHER GO-slim and improvements in enrichment analysis tools. Nucleic Acids Res. 47, D419–D426 (2019). [DOI] [PMC free article] [PubMed] [Google Scholar]
- 47.Lambert SA et al. The human transcription factors. Cell 172, 650–665 (2018). [DOI] [PubMed] [Google Scholar]
- 48.Shu L et al. Mergeomics: multidimensional data integration to identify pathogenic perturbations to biological systems. BMC Genomics 17, 874 (2016). [DOI] [PMC free article] [PubMed] [Google Scholar]
- 49.Nikpay M et al. A comprehensive 1,000 Genomes-based genome-wide association meta-analysis of coronary artery disease. Nat. Genet. 47, 1121–1130 (2015). [DOI] [PMC free article] [PubMed] [Google Scholar]
- 50.CARDIoGRAMplusC4D Consortium et al. Large-scale association analysis identifies new risk loci for coronary artery disease. Nat. Genet. 45, 25–33 (2013). [DOI] [PMC free article] [PubMed] [Google Scholar]
- 51.Speed D, Hemani G, Johnson MR & Balding DJ Improved heritability estimation from genome-wide SNPs. Am. J. Hum. Genet. 91, 1011–1021 (2012). [DOI] [PMC free article] [PubMed] [Google Scholar]
- 52.Yang J et al. Common SNPs explain a large proportion of the heritability for human height. Nat. Genet. 42, 565–569 (2010). [DOI] [PMC free article] [PubMed] [Google Scholar]
- 53.Wang L & Michoel T Efficient and accurate causal inference with hidden confounders from genome–transcriptome variation data. PLoS Comput. Biol. 13, e1005703 (2017). [DOI] [PMC free article] [PubMed] [Google Scholar]
- 54.Chen LS, Emmert-Streib F & Storey JD Harnessing naturally randomized transcription to infer regulatory relationships among genes. Genome Biol. 8, R219 (2007). [DOI] [PMC free article] [PubMed] [Google Scholar]
- 55.Yavorska OO & Burgess S MendelianRandomization: an R package for performing Mendelian randomization analyses using summarized data. Int. J. Epidemiol. 46, 1734–1739 (2017). [DOI] [PMC free article] [PubMed] [Google Scholar]
- 56.Cooper GF et al. The center for causal discovery of biomedical knowledge from big data. J. Am. Med. Inform. Assoc. 22, 1132–1136 (2015). [DOI] [PMC free article] [PubMed] [Google Scholar]
- 57.Bostrom P et al. A PGC1-α-dependent myokine that drives brown-fat-like development of white fat and thermogenesis. Nature 481, 463–468 (2012). [DOI] [PMC free article] [PubMed] [Google Scholar]
- 58.Lusis AJ et al. The Hybrid Mouse Diversity Panel: a resource for systems genetics analyses of metabolic and cardiovascular traits. J. Lipid Res. 57, 925–942 (2016). [DOI] [PMC free article] [PubMed] [Google Scholar]
- 59.Serruys PW et al. Assessment of the SYNTAX score in the Syntax study. EuroIntervention 5, 50–56 (2009). [DOI] [PubMed] [Google Scholar]
- 60.Mark DB et al. Continuing evolution of therapy for coronary artery disease. Initial results from the era of coronary angioplasty. Circulation 89, 2015–2025 (1994). [DOI] [PubMed] [Google Scholar]
- 61.Phillips PC Epistasis—the essential role of gene interactions in the structure and evolution of genetic systems. Nat. Rev. Genet. 9, 855–886 (2008). [DOI] [PMC free article] [PubMed] [Google Scholar]
Associated Data
This section collects any data citations, data availability statements, or supplementary materials included in this article.
Supplementary Materials
Data Availability Statement
Case and control STARNET data are available at the dbGAP site (dbGaP study accession phs001203.v1.p1). Validation data are provided by the HMDP25, GTEx32 and morbid obesity33 studies. Liver RNA-seq data generated in response to injecting mice with recombinant endocrine factors are available under GEO entry GSE189001. Source data are provided with this paper.


