Abstract
The Quantiplex human immunodeficiency virus type 1 RNA 3.0 Assay (bDNA) (Bayer Diagnostics, Walpole, Mass.) produced linear and reproducible (intra-assay and interassay) results over its quantification range of 50 to 500,000 copies/ml of plasma with 96% specificity. A threefold or 0.5-log10 change or greater was clinically significant for serial patient samples.
Serial human immunodeficiency virus type 1 (HIV-1) RNA testing is an essential component of management for individual HIV-positive patients (1, 2). The Quantiplex HIV-1 RNA 3.0 Assay (bDNA) (Bayer Diagnostics, Walpole, Mass.) is a signal amplification nucleic acid probe assay for the direct quantification of plasma HIV-1 RNA (3). In validating this assay for use in our laboratory, we examined its (i) specificity, (ii) linearity over its reportable range of 50 to 500,000 copies/ml of plasma, (iii) intra-assay (well-to-well) variability, (iv) interassay (run-to-run) variability, (v) variability between serial patient samples and its clinical significance, and (vi) copy numbers, compared to those of the (previous) 2.0 version. We also compared a plastic tube to the standard glass tube used to collect the blood sample. Many laboratories have switched to the plastic tube to avoid breakage.
(This work was presented in part at the Fifteenth Annual Clinical Virology Symposium, Clearwater Beach, Fla., 9 to 12 May 1999, abstr. M19).
Bayer Diagnostics (formerly Chiron) provided frozen plasma for the specificity and linearity testing. The other samples were obtained from HIV-positive patients at the Veterans Affairs Medical Centers in Washington, D.C., and Baltimore, Md. Peripheral blood was collected by venipuncture, kept at room temperature, and centrifuged within 4 h at 1,000 × g for 10 to 15 min. The plasma was frozen at −80°C. Each specimen was then tested according to the manufacturer's directions (Quantiplex HIV-1 RNA 3.0 Assay [bDNA] package insert; Bayer Diagnostics). A run of a complete plate contained up to 80 samples; a half-plate run contained 35 samples. One person prepared and analyzed all of the plasma samples.
Seventy-four HIV antibody-negative plasmas were analyzed by using three runs and three kits from two kit lots. For 71 samples, the HIV-1 RNA level was below the detectable limit of 50 copies/ml. The three remaining samples gave values of 85, 114, and 237 copies/ml of plasma. These values were well below the range reported for acute HIV infection of 27,200 to 1,600,000 copies/ml (4). These low quantities were considered false positives, and the specificity of this assay was 96%. This is consistent with the manufacturer's statement of intended use; this test is not to be employed for the diagnosis of HIV infection (Quantiplex package insert). However, clinicians do order HIV-1 RNA assays to screen for acute infection before seroconversion has occurred. If this particular assay is being used, caution must be taken to not interpret a low positive value as proof of a genuine HIV infection.
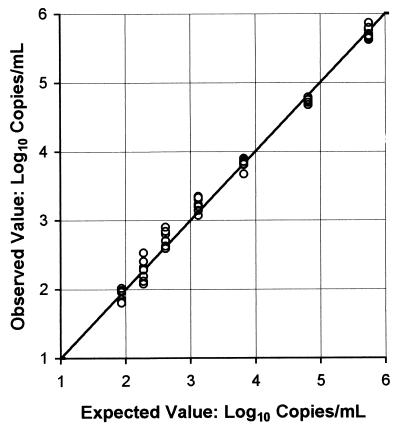
Seven samples from a serial dilution panel were analyzed eight times each by using two runs and two kits from the same kit lot. As illustrated in Fig. 1, the Quantiplex HIV-1 RNA 3.0 Assay (bDNA) gave linear results over its quantification range of 50 to 500,000 copies/ml. The least-squares linear regression for the median log10 copies per milliliter was as follows: y = 0.075 + 0.983x, with r2 = 0.996.
FIG. 1.
Linearity check of Quantiplex HIV-1 RNA 3.0 Assay (bDNA). The expected values are the medians of the 88 quantifications per sample performed by 11 laboratories and are expressed as log10 copies per milliliter. The observed values are the eight runs per sample performed by our laboratory and are expressed as log10 copies per milliliter.
In the intra-assay study, matching plasma samples in adjacent wells were assayed by using four runs and three kits of the same kit lot. Table 1 shows little variation between wells. There was also agreement on four samples being <50 copies/ml and one sample being >500,000 copies/ml. In designing this study, it was assumed that using two varieties of Vacutainer EDTA tubes would not contribute significantly to the variability. The data supports this assumption, and K3 EDTA liquid in glass tubes and K2 EDTA sprayed in plastic tubes can be used interchangeably with this assay.
TABLE 1.
Summary of intra-assay, interassay, and serial clinical sample correlations for the Quantiplex HIV-1 RNA 3.0 assay (bDNA)a
| Assay or sample (n) | Slope | Intercept | r2 | P | Median change
|
95th percentile change
|
Median copies/ml | Range copies/ml | |||
|---|---|---|---|---|---|---|---|---|---|---|---|
| % | Fold | Log | Fold | Log | |||||||
| Intra-assayb (27) | 1.006 | −0.032 | 0.989 | 0.605 | −3 | 1.13 | 0.052 | 1.67 | 0.222 | 5,941 | 61–472,203 |
| Interassayc (35) | 1.006 | −0.067 | 0.964 | 0.113 | −15 | 1.25 | 0.097 | 2.15 | 0.332 | 6,973 | 118–304,956 |
| Serial samplesd (31) | 1.013 | −0.115 | 0.928 | 0.119 | −24 | 1.43 | 0.156 | 2.70 | 0.431 | 8,015 | 71–150,328 |
Each comparison was performed on a different set of samples. The slope, intercept, and r2 were determined by least-squares linear regression of the log10 copies per milliliter. The P value was determined by a two-tailed paired t test. Median and 95th percentile changes were derived from copies per milliliter as follows: percent change = 100 × (sample 2 [S2] − sample 1 [S1])/S1; fold change = S1/S2 if S1 > S2 or S2/S1 if S2 > S1; log change = |log S1 − log S2|. The medians and ranges of copies per milliliter were based on the averages of S1 and S2.
Patient samples were drawn in a 7-ml liquid K3 EDTA glass tube (Vacutainer no. 36-7665) and in a 4-ml sprayed K2 EDTA polyethylene tube (Vacutainer no. 36-7861). The plasma was analyzed December 1998 in adjacent wells by using four runs, three kits, one kit lot, and one operator.
From one phlebotomy, each patient's plasma was frozen in September and October 1998 at −80°C, thawed, and analyzed twice by using 11 runs, five kits, one kit lot, and one operator.
Obtained from clinically stable patients with no recent changes in antiretroviral therapy. The samples were analyzed from September to December 1998 by using one operator.
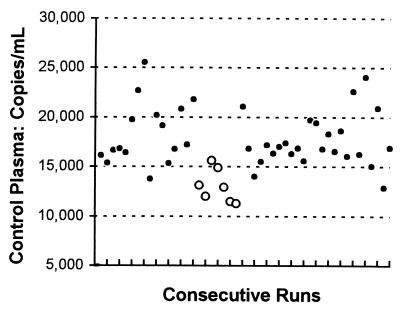
In the interassay study, 35 patients were phlebotomized once, and their plasmas were frozen, thawed, and assayed twice. Three or four samples were compared at a time by using 11 runs and five kits of the same kit lot. As shown in Table 1, the run-to-run variability was low. However, its effect was still apparent: four of five runs of four samples and two of five runs of three samples had values all higher or all lower than those of the previous run. The median decrease of 15% from the first to second run is likely the result of the extra freeze-thaw cycle. Interassay variability was also examined with an in-house control (Fig. 2). Each run had one specific well dedicated to hold this control: mean, 17,166 copies/ml; standard deviation (SD), 3,179; percent coefficient of variation, 18.5; n, 48. A significant difference was found between kit lot no. 3 (mean, 13,057 copies/ml; SD, 1,673; n, 7) and the other six kit lots (mean, 17,868 copies/ml; SD, 2,828; n, 41 [P < 0.001, two-tailed t test]).
FIG. 2.
Interassay variability of Quantiplex HIV-1 RNA 3.0 Assay (bDNA). The in-house control was pooled plasma frozen in 1-ml aliquots at 80°C; it was analyzed by using 48 runs, seven kit lots, and one operator from September 1998 to July 1999. ○, kit lot no. 3; ●, all other kit lots.
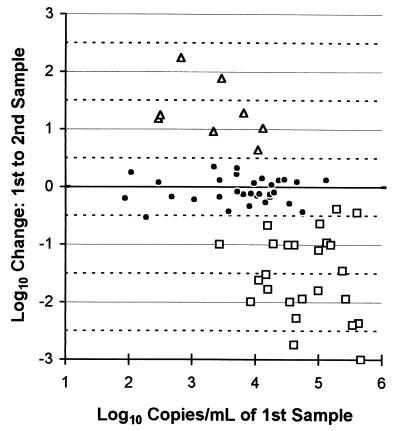
During a 3-month period, 64 pairs of serial samples had values within the quantification range (Fig. 3). A retrospective chart review determined that 25 patients had decreases (0.381 to 3.103 log10; median, 1.519 log10) in their HIV-1 RNA following changes in their antiretroviral therapy. Eight patients had increases (0.645 to 2.240 log10; median, 1.214 log10) because they were nonadherent. The remaining 31 patients (Fig. 3; Table 1) had stable clinical and therapeutic histories. Their samples, drawn 6 to 84 days apart (median of 42 days), had less than a threefold or 0.5-log10 95th percentile change. There was a 24% median decrease from the first to second sample. Despite the lower control values obtained with kit lot no. 3 (Fig. 2), its use in analyzing 18 of the second samples was not a significant factor: the median decrease for those pairs was also 24%.
FIG. 3.
Serial clinical sample variability with Quantiplex HIV-1 RNA 3.0 Assay (bDNA). □, antiretroviral therapy (ART) started or changed; ▵, ART interrupted; ●, no clinical or ART changes.
Eighty-six patient samples with version 2.0 viral loads of 600 to 416,000 copies/ml (median, 8,000 copies/ml) were reanalyzed with version 3.0 by using two runs and two kits from the same kit lot. The linear regression correlation (r2) was 0.965 for the log10 copies per milliliter. The 3.0 version values were consistently higher, with a mean assay ratio (version 3.0 to version 2.0) of 2.5 ± 0.9 (1 SD). For 78 specimens with version 2.0 values of <500 copies/ml, 41% had values of <50 copies/ml, 38% had values of 50 to 500 copies/ml, and 21% had values of 500 to 2,600 copies/ml with the 3.0 version. These findings are consistent with data from other laboratories (C. Major, T. Degazio, R. Galli, A. Rachlis, C. Kovacs, S. Read, and M. Fearon, 12th World AIDS Congr., poster presentation 1998; J. L. Perez, P. Perez, J. M. Escriba, D. Podzamczer, and R. Martin, 6th Conf. Retrovir. Opportun. Infect., abstr. 146, 1999; L. Sawyer, S. Barr, G. Gorrin, D. Hendricks, J. Kolberg, J. Robertson, L. Shen, and B. Irvine, 14th Annu. Clin. Virol. Symp., abstr. T34, 1998.
In conclusion, the Quantiplex HIV-1 RNA 3.0 Assay (bDNA) was 96% specific and gave linear and reproducible (intra-assay, interassay, and serial clinical samples) results over its quantification range of 50 to 500,000 copies/ml. It correlated well with the 2.0 assay, generally giving 1.5- to 4.5-fold-higher values. Either glass or plastic EDTA Vacutainer tubes can be used with this assay.
Acknowledgments
I thank V. Kan for reviewing the manuscript and making helpful suggestions.
REFERENCES
- 1.Carpenter C C, Fischl A, Hammer S M, Jacobson D M, Katzenstein D A, Montaner J S G, Richman D D, Sang M S, Schooley R T, Thompson M A, Vella S, Yeni P G, Volberding P A. Antiretroviral therapy for HIV infection in 1998: updated recommendations of the International AIDS Society-USA panel. JAMA. 1998;280:78–86. doi: 10.1001/jama.280.1.78. [DOI] [PubMed] [Google Scholar]
- 2.Centers for Disease Control and Prevention. Report of the NIH panel to define the principles of therapy of HIV infection and guidelines for the use of antiretroviral agents in HIV-infected adults and adolescents. Morbid Mortal Weekly Rep. 1998;47:1–82. [Google Scholar]
- 3.Collins M L, Irvine B, Tyner D, Fine E, Zayati C, Chang C, Horn T, Ahle D, Detmer J, Shen L, Kolberg J, Bushnell S, Urdea M S, Ho D D. A branched DNA signal amplification assay for quantification of nucleic acid targets below 100 molecules/mL. Nucleic Acids Res. 1997;25:2979–2984. doi: 10.1093/nar/25.15.2979. [DOI] [PMC free article] [PubMed] [Google Scholar]
- 4.Schacker T W, Hughes J P, Shea T, Coombs R W, Corey L. Biological and virological characteristics of primary HIV infection. Ann Intern Med. 1998;128:613–620. doi: 10.7326/0003-4819-128-8-199804150-00001. [DOI] [PubMed] [Google Scholar]


