Abstract
In this paper, we present the parameterization of the CAVS coarse-grained (CG) force field for 20 amino acids, and our CG simulations show that the CAVS force field could accurately predict the amino acid tendency of the secondary structure. Then, we used the CAVS force field to investigate the binding of a severe acute respiratory syndrome-associated coronavirus fusion peptide (SARS-CoV-2 FP) to a phospholipid bilayer: a long FP (FP-L) containing 40 amino acids and a short FP (FP-S) containing 26 amino acids. Our CAVS CG simulations displayed that the binding affinity of the FP-L to the bilayer is higher than that of the FP-S. We found that the FP-L interacted more strongly with membrane cholesterol than the FP-S, which should be attributed to the stable helical structure of the FP-L at the C-terminus. In addition, we discovered that the FP-S had one major and two minor membrane-bound states, in agreement with previous all-atom molecular dynamics (MD) studies. However, we found that both the C-terminal and N-terminal amino acid residues of the FP-L can strongly interact with the bilayer membrane. Furthermore, we found that the disulfide bond formed between Cys840 and Cys851 stabilized the helices of the FP-L at the C-terminus, enhancing the interaction between the FP-L and the bilayer membrane. Our work indicates that the stable helical structure is crucial for binding the SARS-CoV-2 FP to cell membranes. In particular, the helical stability of FP should have a significant influence on the FP–membrane binding.
Introduction
Severe acute respiratory syndrome-associated coronaviruses (SARS-CoVs)1,2 have severely threatened public health. Since the end of 2019, the outbreak of SARS-CoV-2 and its mutants have triggered unprecedented severe pneumonia (namely, COVID-19), and various mutants of SARS-CoV-2 continue to seriously impact human health and the development of the world economy. The envelope of the RNA virus consists of various proteins, among which the spike protein or S-protein is vital to viral infection.3−8 The S-protein of SARS-CoV (SARS-CoV-1 or SARS-CoV-2) consists of S1 and S2 subunits. Various studies have consistently revealed that during virus infection, the receptor-binding domain (RBD) of the S1 subunit first interacts with the host cell’s angiotensin-converting enzyme 2 (ACE2),9−13 and then, the S2 subunit facilitates the membrane fusion between the host cells and SARS-CoVs.14,15
The S2 subunit of S-protein, which involves viral fusion and entry, contains different structural domains, including fusion peptide (FP) and transmembrane (TM).16,17 FP is a short peptide with 15–40 amino acid residues,18−27 which are mainly hydrophobic. In particular, some membrane-penetrating residues are highly conserved in the coronavirus family, such as leucine (Leu), isoleucine (Ile), and phenylalanine (Phe). The FP is vital to the viral fusion into host cells.26
However, the membrane fusion process of SARS-CoVs (consisting of multiple FPs) is more complicated than influenza viruses, which usually contain a single FP.27 For instance, Rottier and co-workers19 considered the hydrophobic region (residues 770―788) as a potential FP of SARS-CoV-1. Wimley and co-workers20 also proposed the same hydrophobic region (residues 770―788) as the SARS-CoV-1 FP. Furthermore, Guillén et al.21−23 identified the segment (residues 873―888) of S-protein as an internal FP (IFP) of SARS-CoV-1. Whittaker and co-workers24 showed that the amino acids of the segment (residues 798―815) are highly conserved among all CoVs. Lee et al.25 solved the FP structures of SARS-CoV-2 (residues 816–838) in the different states by the solution NMR and CD experiments, revealing that a helix-turn-helix motif characterizes the binding of the SARS-CoV-2 FP to cell membranes.
Due to the complex membrane–fusion mechanism of SARS-CoV FPs, it is a great challenge for experimental research. As an important supplementary tool for experimental research, the all-atom molecular dynamics (MD) simulation technique has been widely used to probe the membrane–fusion mechanism of SARS-CoV FPs.28 For instance, Tajkhorshid and co-workers29 used the experimental FP structure (PDB: 5XLR)30 of SARS-CoV-1 (residues 798―823) to model the FP structure of SARS-CoV-2 (residues 816―841). They found that the FP fragment (containing 26 residues) of SARS-CoV-2 had three membrane-binding modes in a highly mobile membrane mimetic environment. Hummer et al.31 used full-length FP (composed of 40 amino acid residues) of SARS-CoV-2 to construct an FP–membrane binding complex and found that the full-length FP (residues 816–855), containing three short helices and a fully conserved disulfide bond, spontaneously bound to the membrane. Banerjee and co-workers32 compared the binding of two different SARS-CoV-2 FPs (a long FP encompassing 40 residues and a short FP containing 26 residues) to the cell membrane. Their MD simulations showed that the long FP (FP-L) trimer would trigger the membrane fusion more effectively than the short FP (FP-S). Pal33 employed replica-exchange MD (REMD) simulations to explore the physicochemical properties of the SARS-CoV-2 FPs, suggesting that the S-protein dynamics (especially loop dynamics) should be critical to the fusogenicity of SARC-CoV-2. Li and co-workers34 investigated the opening of the SARS-CoV-2 FP using enhanced sampling techniques, showing that the interaction between small molecules and the FP would slow the opening of the FP.
However, the all-atom MD simulation method requires considerable computational power when investigating the process of a complex system occurring on a larger spatial scale and on a longer time scale. To ease the computational costs, various coarse-grained (CG) models (such as MARTINI,35−37 TMFF,38−40 PACE,41,42 UNRES,43,44 and GBEMP,45−47 PRIMO,48,49 ELBA,50,51 etc.) have been proposed by reducing multiple atoms into a “superatom”. The accuracy of these CG models varies with the granularity level or the purpose of specific research. For instance, Voth et al.52 constructed a CG model for a complete SARS-CoV-2 viral particle and showed how to improve the CG model using available experimental and computational data. To explain the high infection of SARS-CoVs, Tarakanova et al.53 constructed CG models for the S-proteins of different CoVs. They conducted the normal mode analysis (NMA) to compare the protein dynamics of different CoV S-proteins. Amitai54 constructed a shape-based CG model for the SARS-CoV-2 S-protein and conducted the on-rate (targeting) analysis to predict important mutation sites in the S-protein. Gu and co-workers55 used the MARTINI force field to simulate the binding form of SARS-CoV-2 RBD with ACE2, and they found that the plier structure at both ends of the RBD-ACE2 interface would benefit the interaction between the RBD and the full-length human ACE2. Tieleman and co-workers56 constructed the MARTINI CG models for the intact envelopes of SARS-CoVs containing multiple S-proteins. They performed microsecond CG simulations to explore the S-protein dynamics in different SARS-CoV envelopes. Unfortunately, there is a lack of CG simulations to explore the fusion mechanism between SARS-CoV FPs and cell membranes.
Previously, we have proposed the CAVS models for water,57 phospholipids,58,59 sterols,60,61 surfactants,62 and helical peptides.63 In the CAVS CG model for water shown in Figure S1 in the Supporting Information,57 four actual water molecules are grouped into a collective unit. As for the CAVS models for phospholipids given in Figure S2 in the Supporting Information, two additional electrostatic interaction sites are included in each ester-linkage group, such that the CAVS simulation can accurately predict the dipole potential of phosphatidylcholine (PC) phospholipid bilayers58 and correctly reveal the ether linkage effect.59 We also applied the CAVS CG model to reveal the sterol effect on the water–membrane interface structure and the sterol dynamics in bilayer membranes.60,61 Recently, the CAVS force field has been successfully used to simulate a surfactant’s adsorption on graphene.62 In addition, we parameterized the CAVS CG model for different helical peptides and explored the tilt of KALP peptides in the dimyristoylphosphatidylcholine (DMPC) bilayer.63
Here, we parameterized the CAVS CG model for 20 amino acids and simulated the FP–membrane binding process. First, we constructed the binding complexes of a short FP (FP-S) and a long FP (FP-L) with a POPC/cholesterol bilayer (the ratio of POPC to cholesterol is 7:3). Then, we generated six different membrane-binding structures for each FP–membrane binding model and performed a 10 μs CAVS simulation on each starting configuration. Finally, we used the 60 μs CG MD trajectory to explore the membrane-binding modes of the FPs. It is encouraging that our CAVS model can capture the binding modes observed in atomistic MD studies. In addition, our CAVS simulations show that the stable helical structure enables the hydrophobic residues to interact strongly with cholesterol, which endows the FP-L with a higher membrane-binding strength than the FP-S. This observation is consistent with the previous all-atom MD simulation results.31,64 Finally, we investigated the effect of the disulfide bond between Cys840 and Cys851 on the membrane binding of the FP-L, finding that the disulfide bridge stabilizes the helical structure, which should strengthen the binding between the FP-L and the bilayer membrane.
Methods
CAVS Models for Cholesterol
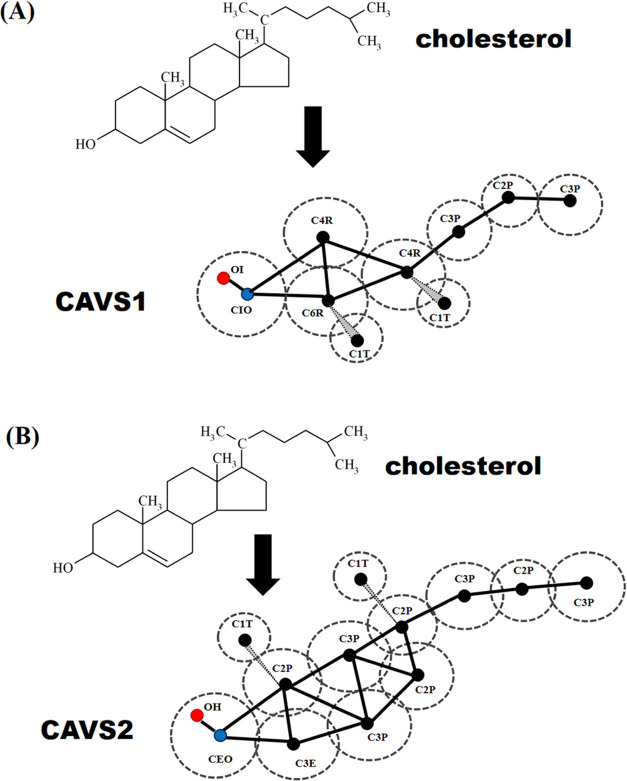
In our earlier work, we proposed the CAVS CG model for cholesterol and investigated the influence of cholesterol on various phospholipid bilayer structures.60 However, the old version of the CAVS cholesterol model (namely, CAVS1) underestimated the phospholipid bilayer thickness at low cholesterol contents. In this paper, we propose an updated version of the CAVS model for cholesterol (namely CAVS2), which can improve the prediction of POPC bilayer thickness at low cholesterol concentrations. Figure 1 compares the difference between the CAVS1 and CAVS2 representation for cholesterol. In the CAVS1 model, we reduced the cholesterol ring to four CG particles (one CIO, one C6R, and two C4R beads) and introduced a point dipole into the CIO bead containing two electrostatic sites: OI and CIO. In the CAVS2 model, we reduced the cholesterol ring to seven CG particles (one CEO, one C3E, two C3P, and four C2P beads). Similarly, we included a point dipole into the CEO bead containing two electrostatic sites: OI and CEO. Therefore, the main difference between the CAVS1 and CAVS2 models is the granularity level of the cholesterol ring. Specifically, the CAVS2 model introduces three more CG particles into the cholesterol ring than the CAVS1 model. In the CAVS1 and CAVS2 models, we grouped the hydrophobic tail of cholesterol into three beads (one C2P and two C3P beads). In addition, the pseudo-methyl groups (two C1T beads) of cholesterol were explicitly attached to the cholesterol ring to prevent the closer packing between cholesterol molecules.
Figure 1.
Comparison between the (A) CAVS1 CG model and (B) CAVS2 CG model for cholesterol. In the CAVS1 and CAVS2 models, two C1T beads were respectively attached to the cholesterol ring to prevent the closer packing between cholesterol molecules, and the nonpolar tail of cholesterol was grouped into three beads (one C2P and two C3P beads). As for the cholesterol ring, four CG particles (one CIO, one C6R, and two C4R beads) were used for the CAVS1 model and seven CG particles (one CEO, one C3E, two C3P, and three C2P beads) for the CAVS2 model.
CAVS Models for Amino Acid Dipeptides
In the CAVS CG representation for alanine dipeptide (Figure 2), we reduced the alanine dipeptide into 10 CG units: one CAN, three C1T, two OCN, two CON, and two NHC beads (the corresponding all-atom structures of these reduced CG beads are given in Figure S3 in the Supporting Information). In the alanine dipeptide model, the OCN and HN sites involve electrostatic interactions. The CG representation for the side chain analogues of 19 amino acids is depicted in Figure S4 in the Supporting Information. Based on the all-atom structures of amino acid dipeptides, we determined the equilibrium distance (Table S1 in the Supporting Information) of the bond connecting two neighboring CG units. Similarly, the angle and dihedral potentials were parameterized by fitting the probability distributions constructed from all-atom reference MD simulations of amino acid dipeptides.63 All angle-bending and dihedral angle parameters are given in Tables S2 and S3 in the Supporting Information, and the vdW interaction parameters (Table S4 in the Supporting Information) for all CAVS CG particles are directly adopted from our previous works.57−63
Figure 2.
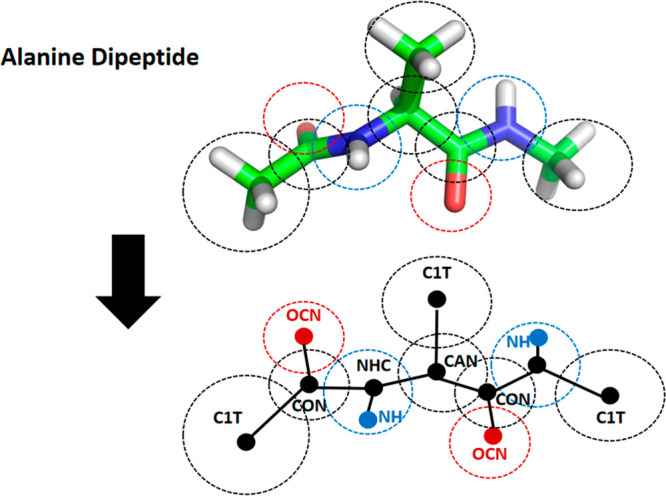
CAVS model for alanine dipeptide. In this model, the van der Waals (vdW) interacting centers are denoted by black and the electrostatic interaction sites by red and blue.
Membrane-Binding Models of SARS-CoV-2 FPs
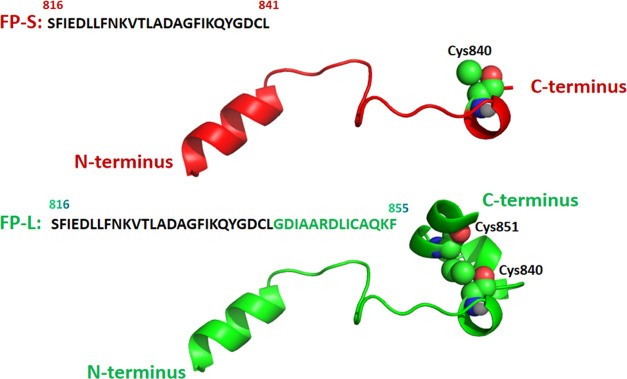
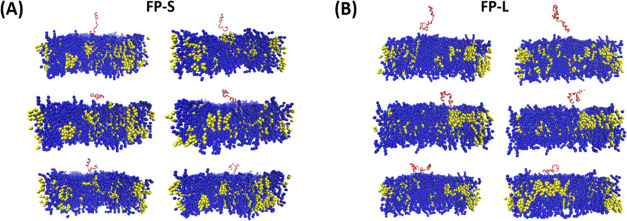
Based on the experimental S-protein structure of SARS-CoV-2 (PDB: 6XR8),65 we obtained all-atom structures of the FP-L (26 amino acid residues) and FP-S (40 amino acid residues), as shown in Figure 3. Then, we converted each atomistic structure into its corresponding CG representation. Since phosphatidylcholine (PC) and cholesterol molecules are the major components of biomembranes, we constructed the FP–membrane binding complexes with the POPC bilayer (30 mol % cholesterol) using the PACKMOL program.66 The POPC bilayer membrane comprises 154 cholesterol molecules and 358 POPC lipids. For each FP–membrane complex, we constructed six starting structures (Figure 4) by altering the orientation of the FP relative to the bilayer normal (z-axis).
Figure 3.
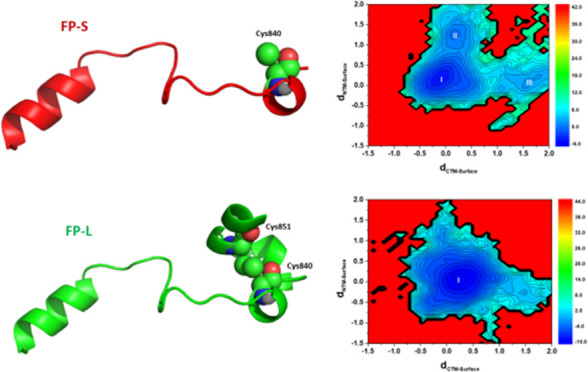
FP models of SARS-CoV-2: FP-S (red) and FP-L (green). Cys840 and Cys851 (space-filling models) form a disulfide bridge in the FP-L model.
Figure 4.
Six starting configurations of the (A) FP-S and (B) FP-L binding to the POPC/cholesterol bilayer membrane were used for the CG simulations. The bilayer membrane comprises 154 cholesterol molecules and 358 POPC lipids. The FP-S and FP-L monomers are indicated by red, the cholesterol molecules by yellow, and the POPC lipids by blue.
CAVS Coarse-Grained (CG) Simulation
The simulation package GROMACS 4.6.567 was used for all CAVS simulations. Each membrane-binding model of the FP was immersed in the CAVS CG water57 (0.15 M NaCl solution), and the solvated complex was minimized. The optimized structure was heated from 100 to 300 K under NVT conditions. Then, we performed a 100 ns NPT equilibrium run followed by a 10 μs production run under an NPT condition. All NPT simulations were conducted at a constant temperature of 310 K with the Nose–Hoover method68,69 and a constant pressure of 1 bar with the semi-isotropic Parrinello-Rahman algorithm.70 We used a shift scheme for the vdW interactions (shifted from 1.2 to 1.6 nm) and adopted the particle mesh Ewald (PME) method71 to calculate electrostatic interactions (the cutoff value is 1.6 nm). The integration time step of 10 fs was used for CG simulations when we employed the LINCS algorithm72 for the constrained bonds inside CG units.
Constant-Velocity Pulling Simulation
In this work, we conducted pulling simulations with a constant velocity to compare the FP-L and FP-S membrane-binding strength in the POPC/cholesterol bilayer. Six different structures selected from CAVS simulation trajectories were used for the pulling simulation. Three independent pulling simulations (starting with different initial velocities) were conducted for each selected configuration, and a pulling force was applied to remove the FP from the bilayer surface (toward the aqueous solution). The removal force constant is 1000 kJ nm–1 mol–1, and the constant pulling speed is 0.005 nm ns–1. We terminated each pulling simulation when the distance between the FP mass center and the bilayer surface was about 4.0 nm.
Results and Discussion
Improving the CAVS Model for Cholesterol
Hodzic et al.73 used the SAXS (small-angle X-ray scattering) technique to determine the bilayer thickness of POPC membranes as a function of cholesterol content, showing that the experimental bilayer thickness increased from 3.7 nm at low cholesterol contents and then reached the plateau at high cholesterol concentrations (>17% cholesterol). Our previous work showed that the early CAVS model (CAVS1) roughly captured this experimental trend.60 However, the CAVS1 model underestimated the experimental bilayer thickness of the POPC membrane and did not reproduce the plateau at high cholesterol concentrations. To improve the prediction of POPC bilayer thickness at low cholesterol concentrations, we proposed an updated version of the CAVS model for cholesterol (CAVS2) by introducing more CG units. By comparing the performance of the CAVS1 and CAVS2 CG models in predicting the bilayer thickness of the POPC membrane, we found that the CAVS2 model improved the prediction at low cholesterol contents and reproduced the plateau at high cholesterol contents, as shown in Figure 5A. In addition, Smaby et al.74 investigated the cholesterol effect on the POPC bilayer condensation, showing a rapid decrease in area per molecule below 30% cholesterol and a slow decline above 30% cholesterol. It is encouraging that the CAVS2 model nicely captures the feature, as shown in Figure 5B.
Figure 5.
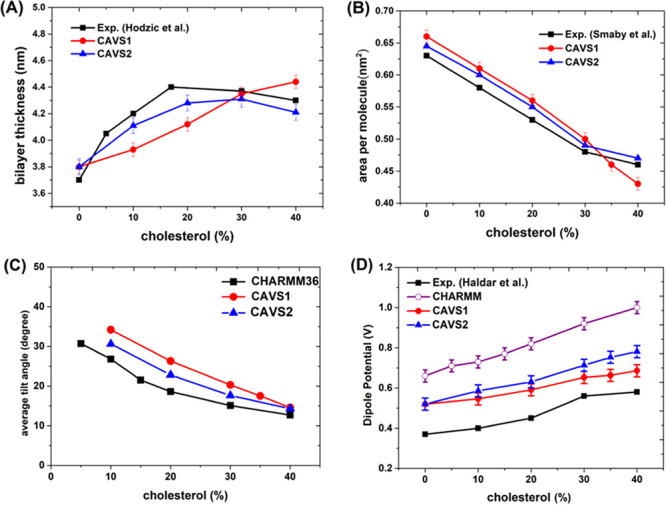
(A) Cholesterol effect on the POPC/cholesterol bilayer thickness, and the experimental bilayer thickness of the POPC bilayer was obtained from the work by Hodzic et al.73 (B) Cholesterol effect on the POPC area condensation, and we obtained the experimental results for area per molecule from the work by Smaby et al.74 (C) Cholesterol effect on the average cholesterol tilt in the POPC bilayer, and our previous work60 provided the CHARMM36 all-atom calculations of the cholesterol tilt angle. (D) Cholesterol effect on the dipole potential of the POPC bilayer, and we obtained the experimental result for the dipole potential from the work by Haldar et al.75
Based on the CAVS CG simulations of the POPC/cholesterol bilayer bound with the FPs, we estimated the average cholesterol tilt angle ⟨θ⟩ as follows
| 1 |
where θ and ρ(θ) represent the tilt angle and the probability. We define the cholesterol tilt angle (Figure S5 in the Supporting Information) based on the orientation between the principal axis of cholesterol and the z-axis (bilayer normal). Figure 5C shows that the average cholesterol tilt angle decreases with the increase of the cholesterol concentration, in agreement with the CHARMM36 all-atom simulation results.
Furthermore, we measured the dipole potential ϕd as a function of z through the following relation
| 2 |
where ε0 represents the vacuum permittivity and ρ(z″) corresponds to the local charge density. The CAVS2 model (shown in Figure 5D) displays that the dipole potential of the POPC bilayer increases with the increase of cholesterol concentration, qualitatively in agreement with the CHARMM36 all-atom and experimental results.
CAVS CG Simulations of Amino Acid Dipeptides
Here, we completed the CAVS CG force field parameterization for 20 amino acids. The derivation of the CAVS CG parameters for amino acids and phospholipids has been described in our previous works,58−63 and we briefly report it below:
-
(1)
We parameterized the bonded potential (bond and angles) for the CAVS force field based on all-atom MD simulations. Tables S1–S3 in the Supporting Information present the parameters of bonded potential for the CAVS force field.
-
(2)
The intermolecular interaction potentials between CAVS CG beads and solvents (such as water and 1-octanol) were parameterized based on the experimental solvation free energies of organic molecules in solvents.58 Then, we parameterized the nonbonded potential (Table S4 in the Supporting Information) of CAVS CG beads by fitting the all-atom MD results for the radial distribution functions (RDF).63
-
(3)
To preserve the electrostatic characteristics of a hydrophilic molecule, we introduced the electrostatic interaction sites into the CAVS CG unit and calculated the partial charges (Table S5 in the Supporting Information) according to the dipole moments of the organic molecules.
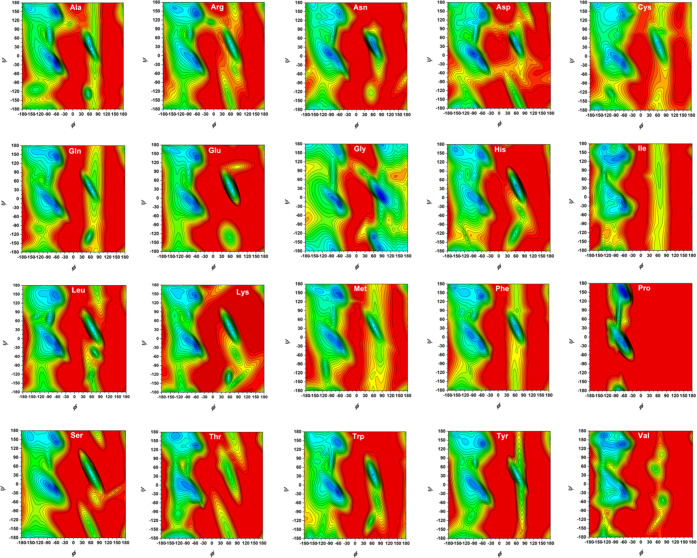
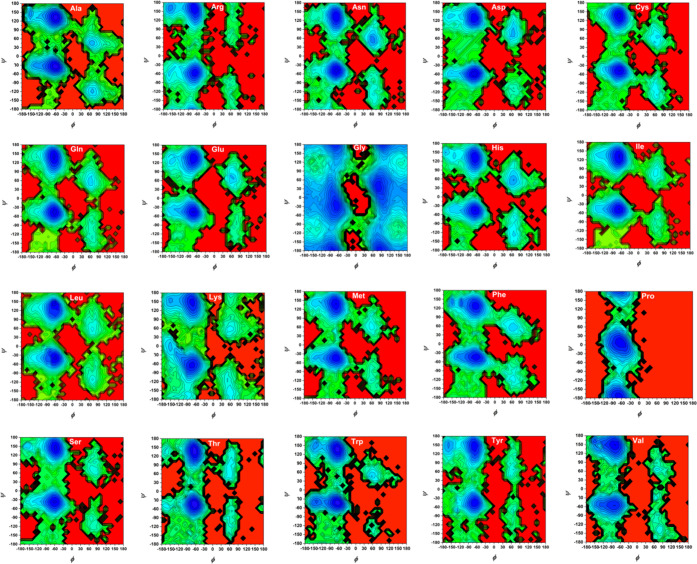
We constructed the potential mean force (PMF) profiles (or free-energy landscapes) for the backbone (ϕ/ψ) distributions of 20 amino acid dipeptides based on the Dunbrak library,76 as displayed in Figure 6. From the CAVS simulation results (Figure 7), it is seen that our CG model can correctly predict the three dominant regions (αR, αL, and PPII + β). The backbone (ϕ/ψ) distributions can be classified into the following regions: (a) PPII region (−120° < ϕ < −20, 60° < ψ < 180°, and −180° < ψ < –120°); (b) β region (−180° < ϕ < –120° and 120° < ϕ < 180°, 60° < ψ < 180° and −180° < ψ < –120°); (c) αL region (20° < ϕ < 160° and −60° < ψ < 120°); and (d) αR region (−160° < ϕ < −20° and −120° < ψ < 60°). The CAVS CG results for the relative populations of three dominant regions (αL, αR, and PPII + β) show that the CAVS predictions are consistent with the Dunbrack library results (Figure 8), indicating that our CAVS model can predict the amino acid preference for the secondary structure (Table 1).1
Figure 6.
Free-energy (PMF) landscapes for the backbone distributions (ϕ/ψ) of 20 amino acid dipeptides, obtained from the Dunbrack library.76 In the free-energy contour plots, the difference between the contour lines is 0.5 kJ/mol.
Figure 7.
Free-energy (PMF) landscapes for the backbone distributions (ϕ, ψ) of 20 amino acid dipeptides, obtained from the CAVS CG simulations. In the free-energy contour plots, the difference between the contour lines is 0.5 kJ/mol.
Figure 8.
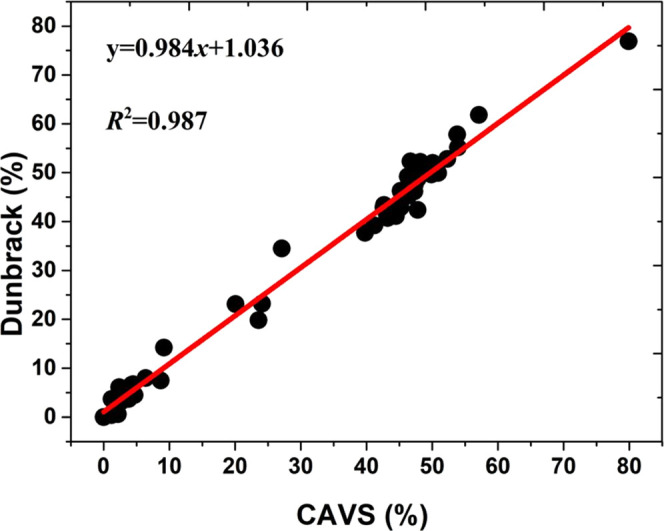
Correlation between the CAVS CG and the Dunbrack library results for the relative population of the three dominant regions (αL, αR, and PPII + β,) based on the backbone distributions (ϕ/ψ) of 20 amino acid dipeptides.
Table 1. Relative Populations (%) of Three Dominant Regions (αL, αR, PPII + β) Calculated Based on the Backbone (ϕ/ψ) Distributions of Amino Acid Dipeptides and the Comparison between the CAVS Simulations and the Dunbrack Library,76 Which Is Free to Download.
| αL (%) |
αR (%) |
PPII+β (%) |
||||
|---|---|---|---|---|---|---|
| amino acid | CAVS | Dunbrack | CAVS | Dunbrack | CAVS | Dunbrack |
| Ala | 3.1 | 4.4 | 47.3 | 46.2 | 47.1 | 47.7 |
| Arg | 1.2 | 3.7 | 43.2 | 40.7 | 53.9 | 55.2 |
| Asn | 9.2 | 14.2 | 43.8 | 42.1 | 45.1 | 43.4 |
| Asp | 4.3 | 6.6 | 48.9 | 51.6 | 44.5 | 41.1 |
| Cys | 4.5 | 6.7 | 42.7 | 43.4 | 49.9 | 49.6 |
| Gln | 4.2 | 4.7 | 43.3 | 42.4 | 50.1 | 52.0 |
| Glu | 4.7 | 4.5 | 45.2 | 42.9 | 48.2 | 52.2 |
| Gly | 27.1 | 34.5 | 24.1 | 23.2 | 23.6 | 19.8 |
| His | 8.7 | 7.5 | 41.2 | 39.2 | 46.7 | 52.3 |
| Ile | 2.7 | 3.2 | 43.1 | 41.6 | 53.8 | 57.8 |
| Leu | 3.8 | 3.7 | 47.5 | 48.1 | 47.4 | 47.6 |
| Lys | 3.1 | 4.7 | 46.4 | 45.3 | 48.3 | 49.8 |
| Met | 3.2 | 4.0 | 42.6 | 42.9 | 52.3 | 52.8 |
| Phe | 6.4 | 8.0 | 44.4 | 42.5 | 46.3 | 49.2 |
| Pro | 0 | 0 | 20.1 | 23.1 | 79.9 | 76.9 |
| Ser | 2.1 | 2.4 | 46.9 | 46.3 | 49.2 | 50.7 |
| Thr | 2.2 | 0.6 | 48.1 | 50.4 | 47.8 | 48.7 |
| Trp | 2.4 | 6.1 | 49.3 | 51.2 | 47.8 | 42.4 |
| Tyr | 2.3 | 3.6 | 45.2 | 46.3 | 50.9 | 49.9 |
| Val | 1.2 | 0.4 | 39.8 | 37.7 | 57.1 | 61.8 |
CAVS CG Simulations of Membrane-Binding Models of the FP-S and FP-L
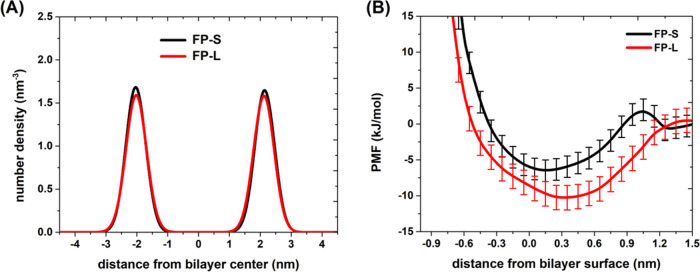
Figure 9A illustrates the number density distributions of the phosphate (P) calculated from the CAVS simulations of the FP–membrane binding structures. According to the number density profiles, we estimated the distance from phosphate to phosphate (z distance) and defined this as the POPC bilayer thickness. Our results show that the FP–membrane binding has an insignificant influence on the POPC/cholesterol bilayer thickness (around 4.3 nm). Thus, we can consider the z-position of the bilayer membrane surface to be 2.15 nm away from the bilayer center. Then, we calculated the free energy curves (Figure 9B) for binding the FPs to the POPC bilayer. It is seen from Figure 9B that the interaction strength of the FP-L with the membrane should be higher than that of the FP-S.
Figure 9.
(A) Number density distribution of the phosphate (P) groups of POPC, constructed based on the CAVS CG simulations of POPC/cholesterol bilayer bound with the FP-S (black) and FP-L (red). (B) PMF curves for binding the FP-S (black) and FP-L (red) to the bilayer membrane. The error for the PMF curves was estimated using the bootstrapping method.
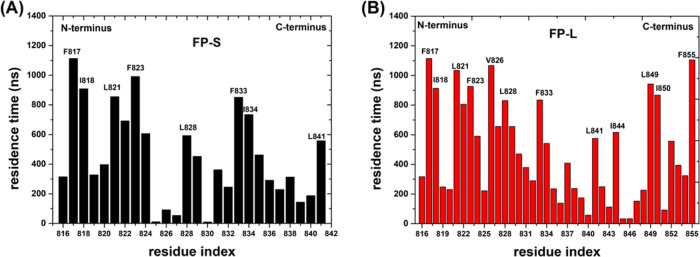
It has been reported that increasing the cholesterol content would enhance the interaction between FPs and cell membranes.27,77 Thus, the membrane-binding strength of the FPs should be related to the interaction strength with cholesterol. To estimate the interaction strength between membrane cholesterol and the FPs, we evaluated the residence time of the interaction between amino acid residues of the FPs with cholesterol in the POPC bilayer using the PyLIPiD program.78 Our results (Figure 10) show that the hydrophobic amino acid residues significantly contribute to the FP–membrane binding strength. In particular, one can see from Figure 10 that the amino acid residues of the FP-L at the C-terminus have much stronger cholesterol interaction than those of the FP-S. Furthermore, we computed the helicity of the FPs as a function of residue index from six independent 10 μs CAVS CG simulations (Figure S6 in the Supporting Information), consistently displaying that the C-terminal helices of the FP-L are more stable than those of the FP-S. Our results indicate that its secondary structural elements should substantially influence the FP–membrane interaction strength. Specifically, the hydrophobic residues of a short helix might facilitate the membrane binding of FPs.
Figure 10.
Residence time of the interaction between amino acid residues of (A) FP-S and (B) FP-L with cholesterol in the POPC bilayer. We labeled some hydrophobic amino acid residues that interact strongly with cholesterol.
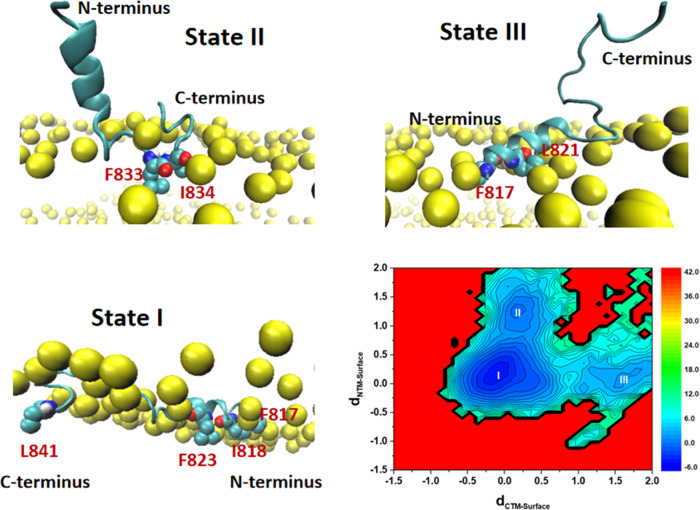
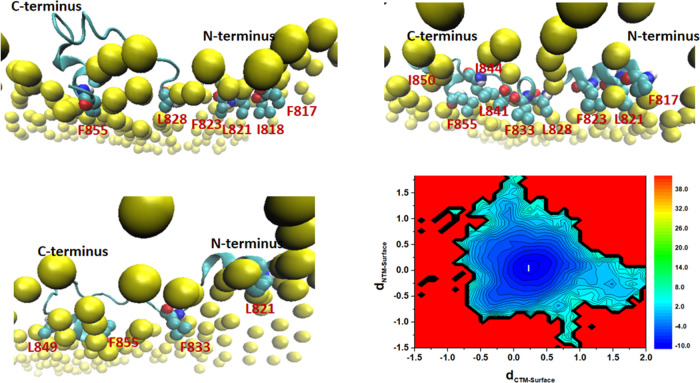
To compare the FP-S and FP-L membrane-binding modes, we computed the z-distances from the FP N-terminus and C-terminus to the POPC bilayer surface and constructed a two-dimensional (2D) free-energy landscape (in the unit of kJ/mol) for the FP–membrane binding, as shown in Figures 11 and 12. In the case of the FP-S, we found that the FP-S has three membrane-bound states (one major and two minor binding modes), and the structures of the most stable state (state I) and two metastable states (states II and III) are presented in Figure 11. The most favorable state (state I) corresponds to the immersion of the FP-S in the POPC bilayer. In addition, it can be seen that some hydrophobic residues (such as F817, I818, F823, and L841) strongly interact with the POPC bilayer, in support of the observation in Figure 10A. The two metastable states (states II and III) represent the two minor binding modes: state II reveals the insertion of the C-terminal loop into the bilayer, while state III is featured by the incomplete embedding of the N-terminal helix into the POPC bilayer. In addition, we found that F833 and I834 belong to the C-terminal loop segment (Figure 11), and the hydrophobic side chains of F817 and L821 are pointing toward the bilayer membrane center (Figure 12), explaining why they strongly interact with cholesterol (illustrated in Figure 10). It is encouraging that the binding modes of the FP-S revealed by our CAVS model are similar to the results obtained from the all-atom MD simulation performed by Tajkhorshid and co-workers.29
Figure 11.
Two-dimensional (2D) free-energy landscape for the interaction between the FP-S and the POPC bilayer (30% cholesterol), and the free energy unit is kJ/mol. dCTM-Surface represents the z distance from the FP C-terminus to the POPC bilayer surface, while dNTM-Surface corresponds to the z distance from the FP N-terminus to the POPC bilayer surface. We labeled the most stable state with I and two metastable states with II and III. Some hydrophobic residues of the FP-S are represented by color spheres and the phosphate groups by yellow spheres.
Figure 12.
Two-dimensional (2D) free-energy landscape for the interaction between the FP-L and the POPC bilayer (30% cholesterol), and free energy unit is kJ/mol. dCTM-Surface represents the z distance from the FP C-terminus to the POPC bilayer surface, while dNTM-Surface corresponds to the z distance from the FP N-terminus to the POPC bilayer surface. We labeled the most stable state with I. Some hydrophobic residues of the FP-S is represented by color spheres and the phosphate groups by yellow spheres.
However, in the case of the FP-L, one can see from Figure 12 that the FP-L has only one predominate binding mode, in which the N-terminal and C-terminal helices are embedded into the POPC bilayer. Based on the 2D free-energy landscape given in Figure 12, we randomly selected three representative configurations from the most stable state (state I). The three representative structures in Figure 12 show that the hydrophobic side chains of amino acid residues are pointing toward the membrane center, ensuring a strong interaction between the FP-L and the bilayer. These results support the observations in Figure 10B, showing that the FP N-terminus and C-terminus strongly interact with membrane cholesterol. In addition, the N-terminal and C-terminal amino acid residues of the FP-L have a high tendency to form the helical structure (Figure S6 in the Supporting Information). All-atom MD simulations performed by Hummer and co-workers31 have shown that the helical structure should enhance the ability of hydrophobic residues (in particular, Phe, Ile, and Leu) to penetrate the cell membrane. It has been reported that the crowding or insertion of peptides should alter the area per lipid, resulting in membrane bending.79,80 In this work, we found that the single-peptide binding has an insignificant influence on the area per lipid. Thus, it is worth investigating how multiple peptide binding influences membrane bending, which we will present in our future work.
Membrane-Binding Strength of the FP-L is Stronger than the FP-S
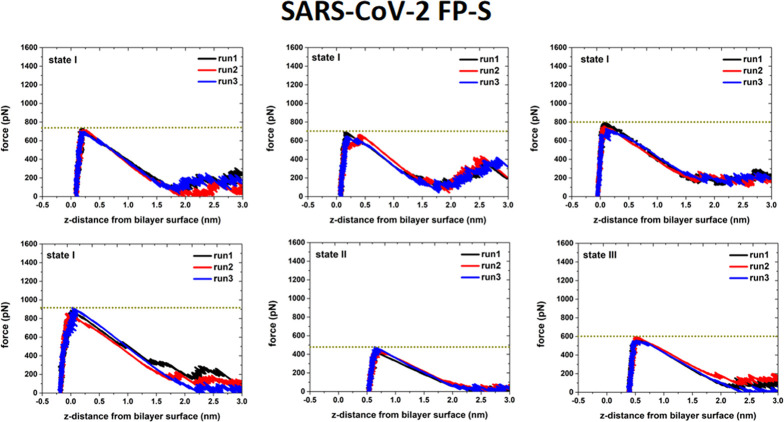
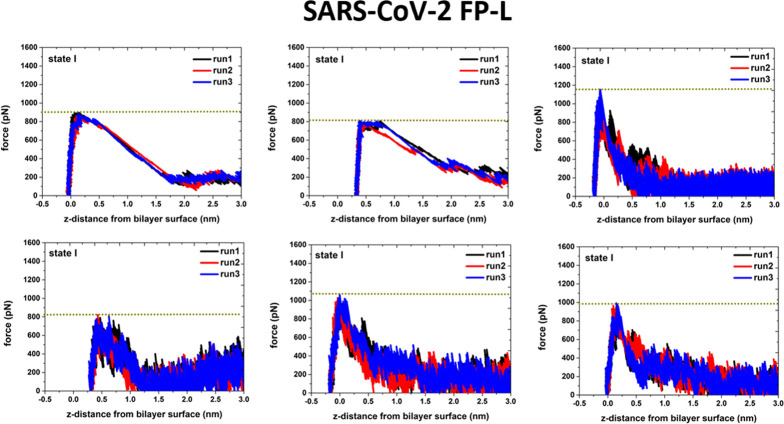
To investigate the interaction strength of the FPs with the POPC bilayer, we conducted the pulling simulations of the FP–membrane binding models (Figure S7 in the Supporting Information). In each case, we removed the FP from the POPC bilayer surface (toward the aqueous solution) and terminated the simulation when the distance between the FP mass center and the bilayer surface was about 4.0 nm. Based on the force-extension curves (given in Figures 13 and 14), it can be seen that the force to remove the FP-L from the POPC bilayer surface is in the range of 800 to 1200 pN, while the FP-S only requires a removal force of 500 and 700 pN. These results support that the interaction between the POPC bilayer and the FP-L is stronger than the FP-S.
Figure 13.
Force-extension curves for pulling the FP-S away from the POPC bilayer surface. From the CAVS simulations of the FP-S, six different structures (Figure S7 in the Supporting Information) were selected for the pulling simulation. Three independent pulling simulations (starting with different initial velocities) were conducted for each selected configuration.
Figure 14.
Force-extension curves for pulling the FP-L away from the POPC bilayer surface. From the CAVS simulations of the FP-L, six different structures (Figure S7 in the Supporting Information) were selected for the pulling simulation. Three independent pulling simulations (starting with different initial velocities) were conducted for each selected configuration.
In the pulling simulations of the FP-S, we selected four configurations from the most favorable state (state I in Figure 11), one from state II, and one from state III, as illustrated in Figure S7 in the Supporting Information. One can see from Figure 13 that the maximum removal forces in state I (680–910 pN) are greater than those (490–600 pN) in states II and III, in support of the PMF profile in Figure 11. Similarly, in the case of the FP-L, we randomly selected six different structures (Figure S7 in the Supporting Information) from the most favorable state (state I). It can be seen in Figure 14 that the maximum force (in the range of 800–1200 pN) to remove the FP-L from the bilayer depends on the depth of the FP-L insertion: the deeper insertion leads to the greater maximum rupture force.
Role of Disulfide Bridge in the Membrane Binding of the FP-L
Recently, Sikdar et al.81 explored the effect of disulfide bonds on the HAV-2B (hepatitis A virus 2B) peptide partitioning and found that the disulfide bonds would alter the hydrophobic exposure of peptides, which will influence the interaction of the viral peptide with host cells. To probe the effect of the disulfide bridge (S–S) on the helices of the FP-L, we conducted the CAVS CG simulations on the FP-L with the disulfide bridge (namely, FP-L-SS) and the FP-L with a broken disulfide bridge (namely, FP-L-noSS) in an aqueous solution (0.15 M NaCl), respectively. Based on the 1.0 μs CG simulations in the aqueous solution, we found that the disulfide bond formed between Cys840 and Cys851 has little effect on the helical structure at the N-terminus but had a significant impact on the helical structure at the C-terminus (Figure 15). Specifically, the disulfide bond is critical to maintain the stability of the helical structure at the C-terminus (Figure 15). In addition, we calculated the helicity per residue from the 1.0 μs CAVS CG simulations of the FP-L-SS and FP-L-noSS in an aqueous solution (Figure S8 in the Supporting Information), confirming the role of the disulfide in the stability of the helical structure.
Figure 15.
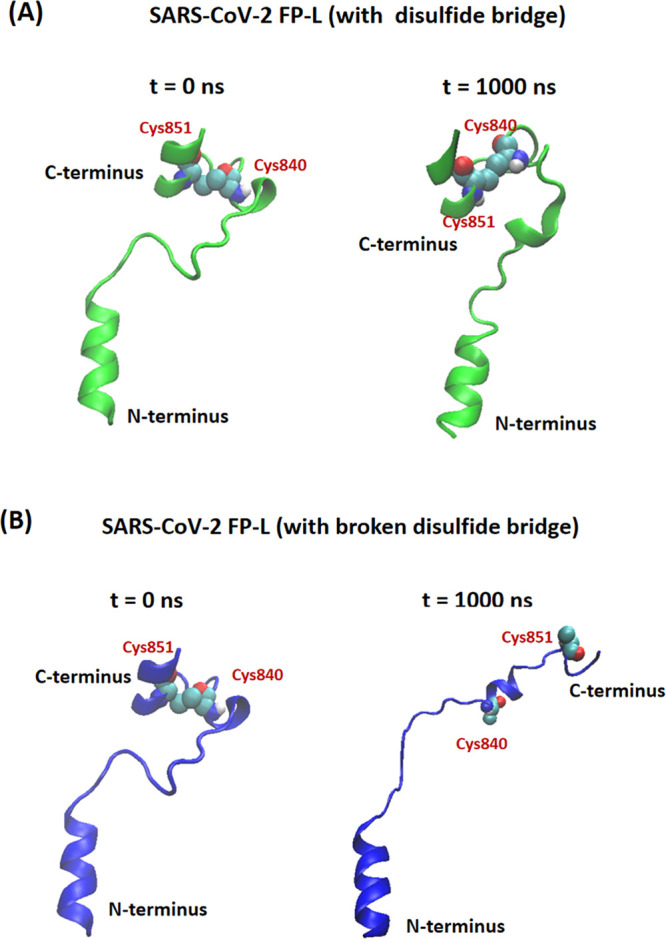
Conformational changes in (A) FP-L-SS (constraining the disulfide bond formed between two cysteine residues) and (B) FP-L-noSS (the FP-L with the broken disulfide bridge), obtained from the 1.0 μs CAVS CG simulations in aqueous solution (0.15 M NaCl). The two cysteine residues (Cys840 and Cys851) of the FP-L are given in the space-filling representation.
Furthermore, we conducted constant-velocity pulling simulations on the FP-L with the broken disulfide bridge (FP-L-noSS) to investigate the influence of the disulfide bridge on the interaction between the POPC bilayer and the FP-L. Before performing the pulling simulations, we performed the CG simulations on the starting configurations of the FP-L-noSS (Figure S7 in the Supporting Information) for 100 ns and used the equilibrated structures for pulling simulations. By comparing the force-extension curves of the FP-L with the disulfide bridge and without the disulfide bridge (Figure 16), it is seen that the disulfide bridge influences the maximum rupture forces of the membrane binding of the FP-L. In particular, five of six pulling simulations show that the disulfide bridge enhances the interaction strength of the FP-L with the POPC bilayer, and only one pulling simulation demonstrates that the disulfide bridge has a slight influence on the FP–membrane binding strength. Therefore, we can conclude that the disulfide bond formation (between Cys840 and Cys851) stabilizes the short helices of the FP-L (Figures 15 and S8 in the Supporting Information), consequently enhancing the binding between the FP-L and the POPC bilayer.
Figure 16.
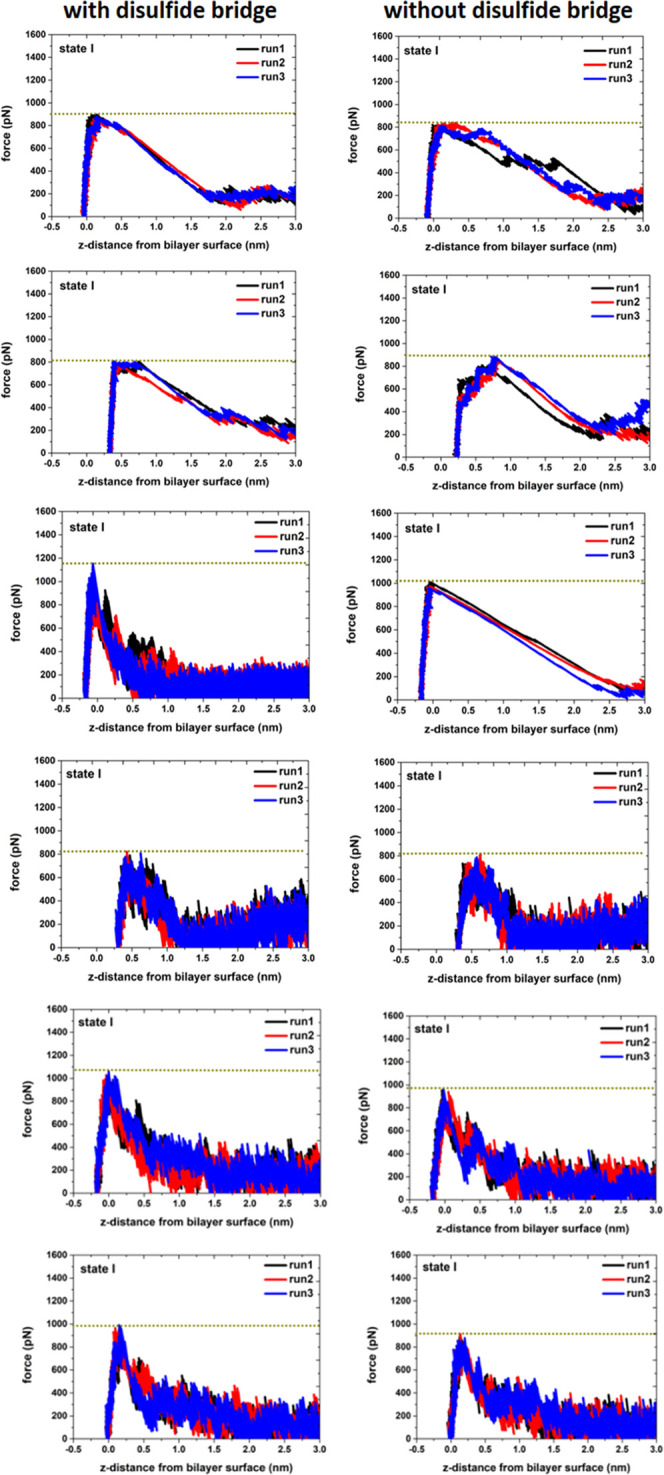
Comparison between the force-extension curves for pulling the FP-L-SS (left pannel) and the FP-L-noSS (right panel) away from the POPC/cholesterol bilayer surface.
Conclusions
In this work, we presented an updated version of the CAVS force field for cholesterol (CAVS2), which can more effectively improve the cholesterol effect on the POPC bilayer compared to the early version of the CAVS CG model (CAVS1). Then, we completed the CAVS force field parameterization for 20 amino acids, which can accurately reproduce the amino acid propensity for secondary structures.
We applied the CAVS force field to explore the binding between the FPs of SARS-CoV-2 and the POPC bilayer (30 mol % cholesterol). We constructed six different membrane-bound configurations for each FP model and performed a 10 μs CAVS CG simulation on each configuration. The PMF calculations revealed that the FP-L interacts with the POPC bilayer more strongly than the FP-S, consistent with the constant-velocity pulling simulation results. Based on the 2D free-energy landscapes for the FP–membrane binding, we discovered that the FP-S had one primary and two minor binding modes. It is encouraging that the three binding modes captured by our CAVS CG model are similar to those obtained by previous all-atom MD simulations. In contrast, the FP-L had only one predominate binding mode: the N-terminal and C-terminal residues strongly interact with membrane cholesterol. Our work indicates that the stable helices of the FP-L ensure the FP-L with a higher membrane-binding strength as compared to the FP-S. This conclusion is confirmed by investigating the role of disulfide bond in the membrane binding of the FP-L. Specifically, the disulfide bond formed between Cys840 and Cys851 stabilizes the C-terminal helices, facilitating the interactions between the FP-L and the target membrane.
Acknowledgments
This research was supported by the National Natural Science Foundation of China (No. 22167007), the National Natural Science Foundation of China (No. 21863002), the Science and Technology Foundation of Guizhou Province (No. QKHJC-[2020]1Y040), the start-up fund from the Guizhou Education University, and the construction project for Guizhou Provincial Key Disciplines (No. ZDXK[2015]10). The China supercomputing technology (CST) cloud and Shanghai Supercomputer Center (SSC) are gratefully acknowledged for providing the computational resources for the simulations.
Supporting Information Available
The Supporting Information is available free of charge at https://pubs.acs.org/doi/10.1021/acsomega.2c05079.
CAVS CG representation for water; CAVS CG mapping for phospholipids, corresponding all-atom structures of reduced CG beads in the CAVS CG model; CAVS CG mapping for the neutral analogues of 19 amino acid side chains; definition for the cholesterol tilt angle with respective to the bilayer normal (z-axis); calculated helicity per residue for the FP-S and FP-L; six membrane-binding models of the FP-S and FP-L used for the pulling simulations at a constant speed; calculated helicity per residue for the FP-L-SS and FP-L-noSS (Figures S1–S8); constrained distances between two consecutive CG beads; parameters for the angle-bending potential of the CAVS force field; parameters for the dihedral angle potential of the CAVS force field; vdW parameters for various CAVS CG types, and partial charges used for the electrostatic interaction sites in the CAVS CG particles (Tables S1–S5) (PDF)
The authors declare no competing financial interest.
Supplementary Material
References
- Wu F.; Zhao S.; Yu B.; Chen Y.; Wang W.; Song Z.; Hu Y.; Tao Z.; Tian J.; Pei Y.; et al. A New Coronavirus Associated with Human Respiratory Disease in China. Nature 2020, 579, 265–269. 10.1038/s41586-020-2008-3. [DOI] [PMC free article] [PubMed] [Google Scholar]
- Zhou P.; Yang X.; Wang X.; Hu B.; Zhang L.; Zhang W.; Si H.; Zhu Y.; Li B.; Huang C.; et al. A Pneumonia Outbreak Associated with a New Coronavirus of Probable Bat Origin. Nature 2020, 579, 270–273. 10.1038/s41586-020-2012-7. [DOI] [PMC free article] [PubMed] [Google Scholar]
- Holmes K. V. SARS-Associated Coronavirus. N. Engl. J. Med. 2003, 348, 1948–1951. 10.1056/NEJMp030078. [DOI] [PubMed] [Google Scholar]
- Hofmann H.; Hattermann K.; Marzi A.; Gramberg T.; Geier M.; Krumbiegel M.; Kuate S.; Uberla K.; Niedrig M.; Pohlmann S. S. Protein of Severe Acute Respiratory Syndrome-Associated Coronavirus Mediates Entry into Hepatoma Cell Lines and is Targeted by Neutralizing Antibodies in Infected Patients. J. Virol. 2004, 78, 6134–6142. 10.1128/JVI.78.12.6134-6142.2004. [DOI] [PMC free article] [PubMed] [Google Scholar]
- Whittaker G. R.; Daniel S.; Millet J. K. Coronavirus Entry: How We Arrived at SARS-CoV-2. Curr. Opin. Virol. 2021, 47, 113–120. 10.1016/j.coviro.2021.02.006. [DOI] [PMC free article] [PubMed] [Google Scholar]
- Dodero-Rojas E.; Onuchic J. N.; Whitford P. C. Sterically Confined Rearrangements of SARS-CoV-2 Spike Protein Control Cell Invasion. eLife 2021, 10, e70362 10.7554/eLife.70362. [DOI] [PMC free article] [PubMed] [Google Scholar]
- Walls A. C.; Park Y.; Tortorici M. A.; Wall A.; McGuire A. T.; Veesler D. Structure, Function and Antigenicity of the SARS-CoV-2 Spike Glycoprotein. Cell 2020, 181, 281–292. 10.1016/j.cell.2020.02.058. [DOI] [PMC free article] [PubMed] [Google Scholar]
- Kuba K.; Imai Y.; Rao S.; Gao H.; Guo F.; Guan B.; Huan Y.; Yang P.; Zhang Y.; Deng W.; et al. A Crucial Role of Angiotensin Converting Enzyme 2 (ACE2) in SARS Coronavirus-Induced Lung Injury. Nat. Med. 2005, 11, 875–879. 10.1038/nm1267. [DOI] [PMC free article] [PubMed] [Google Scholar]
- Li F.; Li W.; Farzan M.; Harrison S. C. Structure of SARS Coronavirus Spike Receptor-Binding Domain Complexed with Receptor. Science 2005, 309, 1864–1868. 10.1126/science.1116480. [DOI] [PubMed] [Google Scholar]
- Hoffmann M.; Kleine-Weber H.; Schroeder S.; Krüger N.; Herrler T.; Erichsen S.; Schiergens T. S.; Herrler G.; Wu N.-H.; Nitsche A.; et al. SARS-CoV-2 Cell Entry Depends on ACE2 and TMPRSS2 and is Blocked by a Clinically Proven Protease Inhibitor. Cell 2020, 181, 271–280.e8. 10.1016/j.cell.2020.02.052. [DOI] [PMC free article] [PubMed] [Google Scholar]
- Letko M.; Marzi A.; Munster V. Functional Assessment of Cell Entry and Receptor Usage for SARS-CoV-2 and Other Lineage B Betacoronaviruses. Nat. Microbiol. 2020, 5, 562–569. 10.1038/s41564-020-0688-y. [DOI] [PMC free article] [PubMed] [Google Scholar]
- Lan J.; Ge J.; Yu J.; Shan S.; Zhou H.; Fan S.; Zhang Q.; Shi X.; Wang Q.; Zhang L.; Wang X. Structure of the SARS-CoV-2 Spike Receptor-Binding Domain Bound to the ACE2 Receptor. Nature 2020, 581, 215–220. 10.1038/s41586-020-2180-5. [DOI] [PubMed] [Google Scholar]
- Wang Q.; Zhang Y.; Wu L.; Niu S.; Song C.; Zhang Z.; Lu G.; Qiao C.; Hu Y.; Yuen K. Y.; et al. Structural and Functional Basis of SARS-CoV-2 Entry by Using Human ACE2. Cell 2020, 181, 894–904. 10.1016/j.cell.2020.03.045. [DOI] [PMC free article] [PubMed] [Google Scholar]
- Walls A. C.; Tortorici M. A.; Snijdera J.; Xiong X.; Boschd B.; Rey F. A.; Veesler D. Tectonic Conformational Changes of a Coronavirus Spike Glycoprotein Promote Membrane Fusion. Proc. Natl. Acad. Sci. U.S.A. 2017, 114, 11157–11162. 10.1073/pnas.1708727114. [DOI] [PMC free article] [PubMed] [Google Scholar]
- Roy S.; Jaiswar A.; Sarkar R. Dynamic Asymmetry Exposes 2019-nCoV Prefusion Spike. J. Phys. Chem. Lett. 2020, 11, 7021–7027. 10.1021/acs.jpclett.0c01431. [DOI] [PubMed] [Google Scholar]
- Huang Y.; Yang C.; Xu X.; Xu W.; Liu S. Structural and Functional Properties of SARS-CoV-2 Spike Protein: Potential Antivirus Drug Development for COVID-19. Acta Pharmacol. Sin. 2020, 41, 1141–1149. 10.1038/s41401-020-0485-4. [DOI] [PMC free article] [PubMed] [Google Scholar]
- Henderson R.; Edwards R. J.; Mansouri K.; Janowska K.; Stalls V.; Gobeil S. M. C.; Kopp M.; Li D.; Parks R.; Hsu A. L.; et al. Controlling the SARS-CoV-2 Spike Glycoprotein Conformation. Nat. Struct. Mol. Biol. 2020, 27, 925–933. 10.1038/s41594-020-0479-4. [DOI] [PMC free article] [PubMed] [Google Scholar]
- Belouzard S.; Chu V. C.; Whittaker G. R. Activation of the SARS Coronavirus Spike Protein via Sequential Proteolytic Cleavage at Two Distinct Sites. Proc. Natl. Acad. Sci. U.S.A. 2009, 106, 5871–5876. 10.1073/pnas.0809524106. [DOI] [PMC free article] [PubMed] [Google Scholar]
- Bosch B. J.; Martina B. E.; Van Der Zee R.; Lepault J.; Lepault B. J.; Versluis C.; Heck A. J.; De Groot R.; Osterhaus A. D.; Rottier P. J. Severe Acute Respiratory Syndrome Coronavirus (SARS-CoV) Infection Inhibition Using Spike Protein Heptad Repeat-Derived Peptides. Proc. Natl. Acad. Sci. U.S.A. 2004, 101, 8455–8460. 10.1073/pnas.0400576101. [DOI] [PMC free article] [PubMed] [Google Scholar]
- Sainz B.; Rausch J. M.; Gallaher R. F.; Garry R. F.; Wimley W. C. Identification and Characterization of the Putative Fusion Peptide of the Severe Acute Respiratory Syndrome-Associated Coronavirus Spike Protein. J. Virol. 2005, 79, 7195–7206. 10.1128/JVI.79.11.7195-7206.2005. [DOI] [PMC free article] [PubMed] [Google Scholar]
- Guillén J.; Perez-Berna A. J.; Moreno M. R.; Villalaín J. A Second SARS-CoV S2 Glycoprotein Internal Membrane-Active Peptide. Biphysical Characterization and Membrane Interaction. Biochemistry 2008, 47, 8214–8224. 10.1021/bi800814q. [DOI] [PubMed] [Google Scholar]
- Guillén J.; de Almeida R. F.; Prieto M.; Villalaín J. Structural and Dynamic Characterization of the Interaction of the Putative Fusion Peptide of the S2 SARS-CoV Virus Protein with Lipid Membranes. J. Phys. Chem. B 2008, 112, 6997–7007. 10.1021/jp7118229. [DOI] [PubMed] [Google Scholar]
- Guillén J.; Kinnunen P. K. J.; Villalaín J. Membrane Insertion of the Three main Membranotropic Sequences from SARS-CoV S2 Glycoprotein. Biochim. Biophys. Acta 2008, 1778, 2765–2774. 10.1016/j.bbamem.2008.07.021. [DOI] [PMC free article] [PubMed] [Google Scholar]
- Madu I. G.; Roth S. L.; Belouzard S.; Whittaker G. R. Characterization of a highly Conserved Domain within the Severe Acute Respiratory Syndrome Coronavirus Spike Protein S2 Domain with Characteristics of a Viral Fusion Peptide. J. Virol. 2009, 83, 7411–7421. 10.1128/JVI.00079-09. [DOI] [PMC free article] [PubMed] [Google Scholar]
- Birtles D.; Lee J. Identifying Distinct Structural Features of the SARS-CoV-2 Spike Protein Fusion Domain Essential for Membrane Interaction. Biochemistry 2021, 60, 2978–2986. 10.1021/acs.biochem.1c00543. [DOI] [PubMed] [Google Scholar]
- Pattnaik G. P.; Meher G.; Chakraborty H.. Exploring the Mechanism of Viral Peptide-Induced Membrane Fusion. In Advances in Experimental Medicine and Biology; Springer, 2018; Vol. 1112, pp 69–78. [DOI] [PubMed] [Google Scholar]
- Chakraborty H.; Bhattacharjya S. Mechanistic Insights of Host Cell Fusion of SARS-CoV-1 and SARS-CoV-2 from Atomic Resolution Structure and Membrane Dynamics. Biophys. Chem. 2020, 265, 106438 10.1016/j.bpc.2020.106438. [DOI] [PMC free article] [PubMed] [Google Scholar]
- Padhi A. K.; Rath S. L.; Tripathi T. Accelerating COVID-19 Research Using Molecular Dynamics Simulation. J. Phys. Chem. B 2021, 125, 9078–9091. 10.1021/acs.jpcb.1c04556. [DOI] [PubMed] [Google Scholar]
- Gorgun D.; Lihan M.; Kapoor K.; Tajkhorshid E. Binding Mode of SARS-CoV-2 Fusion Peptide to Human Cellular Membrane. Biophys. J. 2021, 120, 2914–2926. 10.1016/j.bpj.2021.02.041. [DOI] [PMC free article] [PubMed] [Google Scholar]
- Gui M.; Song W.; Zhou H.; Xu J.; Chen S.; Xiang Y.; Wang X. Cryo-electron Microscopy Structures of the SARS-CoV Spike Glycoprotein Reveal a Prerequisite Conformational State for Receptor Binding. Cell Res. 2017, 27, 119–129. 10.1038/cr.2016.152. [DOI] [PMC free article] [PubMed] [Google Scholar]
- Schaefer S. L.; Jung H.; Hummer G. Binding of SARS-CoV-2 Fusion Peptide to Host Endosome and Plasma Membrane. J. Phys. Chem. B 2021, 125, 7732–7741. 10.1021/acs.jpcb.1c04176. [DOI] [PMC free article] [PubMed] [Google Scholar]
- Borkotoky S.; Dey D.; Banerjee M. Computational Insight Into the Mechanism of SARS-CoV-2 Membrane Fusion. J. Chem. Inf. Model. 2021, 61, 423–431. 10.1021/acs.jcim.0c01231. [DOI] [PubMed] [Google Scholar]
- Pal D. Spike Protein Fusion Loop Controls SARS-CoV-2 Fusogenicity and Infectivity. J. Struct. Biol. 2021, 213, 107713 10.1016/j.jsb.2021.107713. [DOI] [PMC free article] [PubMed] [Google Scholar]
- Remington J. M.; McKay K. T.; Ferrell J. B.; Schneebeli S. T.; Li J. Enhanced Sampling Protocol to Elucidate Fusion Peptide Opening of SARS-CoV-2 Spike Protein. Biophys. J. 2021, 120, 2848–2858. 10.1016/j.bpj.2021.05.022. [DOI] [PMC free article] [PubMed] [Google Scholar]
- Marrink S. J.; de Vries A. H.; Mark A. E. Coarse Grained Model for Semiquantitative Lipid Simulations. J. Phys. Chem. B 2004, 108, 750–760. 10.1021/jp036508g. [DOI] [Google Scholar]
- Marrink S. J.; Risselada H. J.; Yefimov S.; Tieleman D. P.; deVries A. H. The MARTINI Force Field: Coarse Grained Model for Biomolecular Simulations. J. Phys. Chem. B 2007, 111, 7812–7824. 10.1021/jp071097f. [DOI] [PubMed] [Google Scholar]
- Souza P. C. T.; Thallmair S.; Conflitti P.; Ramírez-Palacios C.; Alessandri R.; Raniolo S.; Limongelli V.; Marrink S. J. Protein-Ligand Binding with the Coarse-Grained Martini Model. Nat. Commun. 2020, 11, 3714 10.1038/s41467-020-17437-5. [DOI] [PMC free article] [PubMed] [Google Scholar]
- Li M.; Liu F.; Zhang J. Z. H. TMFF-A Two-Bead Multipole Force Field for Coarse-Grained Molecular Dynamics Simulation of Protein. J. Chem. Theory Comput. 2016, 12, 6147–6156. 10.1021/acs.jctc.6b00769. [DOI] [PubMed] [Google Scholar]
- Li M.; Zhang J. Z. H. Two-Bead Polarizable Water Models Combined with a Two-Bead Multipole Force Field (TMFF) for Coarse-Grained Simulation of Proteins. Phys. Chem. Chem. Phys. 2017, 19, 7410–7419. 10.1039/C6CP07958J. [DOI] [PubMed] [Google Scholar]
- Li M.; Zhang J. Z. H. Protein Simulation using Coarse-Grained Two-Bead Multipole Force Field with Polarizable Water Models. J. Chem. Phys. 2017, 146, 065101 10.1063/1.4975303. [DOI] [PubMed] [Google Scholar]
- Han W.; Wan C.; Jiang F.; Wu Y. PACE Force Field for Protein Simulations: I. Full Parameterization of Version 1 and Verification. J. Chem. Theory Comput. 2010, 6, 3373–3389. 10.1021/ct1003127. [DOI] [PubMed] [Google Scholar]
- Wan C.-K.; Han W.; Wu Y. Parameterization of PACE Force Field for Membrane Environment and Simulation of Helical Peptides and Helix-Helix Association. J. Chem. Theory Comput. 2012, 8, 300–313. 10.1021/ct2004275. [DOI] [PubMed] [Google Scholar]
- Shen H.; Czaplewski C.; Liwo A.; Scheraga H. A. Implementation of a Serial Replica Exchange Method in a Physics-Based United-Residue (UNRES) Force Field. J. Chem. Theory Comput. 2008, 4, 1386–1400. 10.1021/ct800063d. [DOI] [PMC free article] [PubMed] [Google Scholar]
- Shen H.; Liwo A.; Scheraga H. A. An Improved Functional Form for the Temperature Scaling Factors of the Components of the Mesoscopic UNRES Force Field for Simulations of Protein Structure and Dynamics. J. Phys. Chem. B 2009, 113, 8738–8744. 10.1021/jp901788q. [DOI] [PMC free article] [PubMed] [Google Scholar]
- Wu J.; Zhen X.; Shen H.; Li G.; Ren P. Gay-Berne and Electrostatic Multipole Based Coarse-Grain Potential in Implicit Solvent. J. Chem. Phys. 2011, 135, 155104 10.1063/1.3651626. [DOI] [PMC free article] [PubMed] [Google Scholar]
- Shen H.; Li Y.; Ren P.; Zhang D.; Li G. Anisotropic Coarse-Grained Model for Proteins Based On Gay–Berne and Electric Multipole Potentials. J. Chem. Theory Comput. 2014, 10, 731–750. 10.1021/ct400974z. [DOI] [PMC free article] [PubMed] [Google Scholar]
- Li G.; Shen H.; Zhang D.; Li Y.; Wang H. Coarse-Grained Modeling of Nucleic Acids Using Anisotropic Gay–Berne and Electric Multipole Potentials. J. Chem. Theory Comput. 2016, 12, 676–693. 10.1021/acs.jctc.5b00903. [DOI] [PubMed] [Google Scholar]
- Kar P.; Gopal S. M.; Cheng Y.; Predeus A.; Feig M. PRIMO: A Transferable Coarse-grained Force Field for Proteins. J. Chem. Theory Comput. 2013, 9, 3769–3788. 10.1021/ct400230y. [DOI] [PMC free article] [PubMed] [Google Scholar]
- Kar P.; Gopal S. M.; Cheng Y.; Predeus A.; Feig M. Transferring the PRIMO Coarse-Grained Force Field to the Membrane Environment: Simulations of Membrane Proteins and Helix-Helix Association. J. Chem. Theory Comput. 2014, 10, 3459–3472. 10.1021/ct500443v. [DOI] [PMC free article] [PubMed] [Google Scholar]
- Orsi M.; Essex J. W. The ELBA Force Field for Coarse-Grain Modeling of Lipid Membranes. PLoS One 2011, 6, e28637 10.1371/journal.pone.0028637. [DOI] [PMC free article] [PubMed] [Google Scholar]
- Siani P.; de Souza R. M.; Dias G.; Itri R.; Khandelia H. An Overview of Molecular Dynamics Simulations of Oxidized Lipid Systems, with a Comparison of ELBA and MARTINI Force Fields for Coarse Grained Lipid Simulations. Biochim. Biophys. Acta, Biomembr. 2016, 1858, 2498–2511. 10.1016/j.bbamem.2016.03.031. [DOI] [PubMed] [Google Scholar]
- Yu A.; Pak A. J.; He P.; Monje-Galvan V.; Casalino L.; Gaieb Z.; Dommer A. C.; Amaro R. E.; Voth G. A. A Multiscale Coarse-Grained Model of the SARS-CoV-2 Virion. Biophys. J. 2021, 120, 1097–1104. 10.1016/j.bpj.2020.10.048. [DOI] [PMC free article] [PubMed] [Google Scholar]
- Kunkel G.; Madani M.; White S. J.; Verardi P. H.; Tarakanova A. Modeling Coronavirus Spike Protein Dynamics: Implications for Immunogenicity and Immune Escape. Biophys. J. 2021, 120, 5592–5618. 10.1016/j.bpj.2021.11.009. [DOI] [PMC free article] [PubMed] [Google Scholar]
- Amitai A. Viral Surface Geometry Shapes Influenza and Coronavirus Spike Evolution through Antibody Pressure. PLoS Comput. Biol. 2021, 17, e1009664 10.1371/journal.pcbi.1009664. [DOI] [PMC free article] [PubMed] [Google Scholar]
- Ma B.; Zhang Z.; Li Y.; Lin X.; Gu N. Evaluation of Interactions between SARS-CoV-2 RBD and Full-Length ACE2 with Coarse-Grained Molecular Dynamics Simulations. J. Chem. Inf. Model 2022, 62, 936–944. 10.1021/acs.jcim.1c01306. [DOI] [PubMed] [Google Scholar]
- Wang B.; Zhong C.; Tieleman P. D. Supramolecular Organization of SARS-CoV and SARS-CoV-2 Virions Revealed by Coarse-Grained Models of Intact Virus Envelopes. J. Chem. Inf. Model 2022, 62, 176–186. 10.1021/acs.jcim.1c01240. [DOI] [PubMed] [Google Scholar]
- Deng M.; Shen H. Coarse-Grained Model for Water Involving a Virtual Site. J. Phys. Chem. B 2016, 120, 733–739. 10.1021/acs.jpcb.5b08374. [DOI] [PubMed] [Google Scholar]
- Shen H.; Deng M.; Zhang Y. Extension of CAVS Coarse-Grained Model to Phospholipid Membranes: The Importance of Electrostatics. J. Comput. Chem. 2017, 38, 971–980. 10.1002/jcc.24770. [DOI] [PubMed] [Google Scholar]
- Shen H.; Zhao K.; Wu Z. Effects of Ether-linkage on Membrane Dipole Potential and Cholesterol Flip-Flop Motion in Lipid Bilayer Membranes. J. Phys. Chem. B 2019, 123, 7818–7828. 10.1021/acs.jpcb.9b06570. [DOI] [PubMed] [Google Scholar]
- Shen H.; Deng M.; Wu Z.; Zhang J.; Zhang Y.; Gao C.; Cen C. Effect of Cholesterol on Membrane Dipole Potential: Atomistic and Coarse-Grained Molecular Dynamics Simulations. J. Chem. Theory Comput. 2018, 14, 3780–3795. 10.1021/acs.jctc.8b00092. [DOI] [PubMed] [Google Scholar]
- Shen H.; Wu Z.; Zhao K.; Yang H.; Deng M.; Wen S. Effect of Cholesterol and 6-Ketocholestanol on Membrane Dipole Potential and Sterol Flip-Flop Motion in Bilayer Membranes. Langmuir 2019, 35, 11232–11241. 10.1021/acs.langmuir.9b01802. [DOI] [PubMed] [Google Scholar]
- Shen H.; Zou X.; Yang H.; Zhong W.; Wang Y.; Wang S.; Deng M. Adsorption of Organic Molecules and Surfactants on Graphene: A Coarse-Grained Study. J. Phys. Chem. A 2021, 125, 700–711. 10.1021/acs.jpca.0c11111. [DOI] [PubMed] [Google Scholar]
- Shen H.; Wu Z.; Lu C. Extension of the CAVS Model to the Simulation of Helical Peptides in a Membrane Environment. Phys. Chem. Chem. Phys. 2021, 23, 12850–12863. 10.1039/D1CP01238J. [DOI] [PubMed] [Google Scholar]
- Shen H.; Wu Z.; Chen L. Different Binding Modes of SARS-CoV-1 and SARS-CoV-2 Fusion Peptides to Cell Membranes: The Influence of Peptide Helix Length. J. Phys. Chem. B 2022, 126, 4261–4271. 10.1021/acs.jpcb.2c01295. [DOI] [PubMed] [Google Scholar]
- Cai Y.; Zhang J.; Xiao T.; Peng H.; Sterling S. M.; Walsh R. M. Jr.; Rawson S.; Rits-Volloch S.; Chen B. Distinct Conformational States of SARS-CoV-2 Spike Protein. Science 2020, 369, 1586–1592. 10.1126/science.abd4251. [DOI] [PMC free article] [PubMed] [Google Scholar]
- Martínez L.; Andrade R.; Birgin E. G.; Martínez J. M. PACKMOL: a Package for Building Initial Configurations for Molecular Dynamics Simulations. J. Comput. Chem. 2009, 30, 2157–2164. 10.1002/jcc.21224. [DOI] [PubMed] [Google Scholar]
- Hess B.; Kutzner C.; van der Spoel D.; Lindahl E. GROMAS4: Algorithms for Highly Efficient, Load-Balanced, and Scalable Molecular Simulation. J. Chem. Theory Comput. 2008, 4, 435–447. 10.1021/ct700301q. [DOI] [PubMed] [Google Scholar]
- Nosé S. Unified Formulation of the Constant Temperature Molecular-Dynamics Methods. J. Chem. Phys. 1984, 81, 511 10.1063/1.447334. [DOI] [Google Scholar]
- Hoover W. G. Canonical Dynamics: Equilibrium Phase-Space Distributions. Phys. Rev. A 1985, 31, 1695 10.1103/PhysRevA.31.1695. [DOI] [PubMed] [Google Scholar]
- Parrinello M.; Rahman A. Polymorphic Transitions in Single Crystals: A New Molecular Dynamics Method. J. Appl. Phys. 1981, 52, 7182–7190. 10.1063/1.328693. [DOI] [Google Scholar]
- Darden T.; York D.; Pedersen L. Particule Mesh Ewald: An N·log(N) Method for Ewald Sums in Large Systems. J. Chem. Phys. 1993, 98, 10089–10092. 10.1063/1.464397. [DOI] [Google Scholar]
- Hess B. P-LINCS: A Parallel Linear Constraint Solver for Molecular Simulation. J. Chem. Theory Comput. 2008, 4, 116–122. 10.1021/ct700200b. [DOI] [PubMed] [Google Scholar]
- Hodzic A.; Zoumpoulakis P.; Pabst G.; Mavromoustakos T.; Rappolt M. Losartan’s Affinity to Fluid Bilayers Modulates Lipid-Cholesterol Interactions. Phys. Chem. Chem. Phys. 2012, 14, 4780–4788. 10.1039/c2cp40134g. [DOI] [PubMed] [Google Scholar]
- Smaby J. M.; Momsen M. M.; Brockman H. L.; Brown R. E. Phosphatidylcholine Acyl Unsaturation Modulates the Decrease in Interfacial Elasticity Induced by Cholesterol. Biophys. J. 1997, 73, 1492–1505. 10.1016/S0006-3495(97)78181-5. [DOI] [PMC free article] [PubMed] [Google Scholar]
- Haldar S.; Kanaparthi R. K.; Samanta A.; Chattopadhyay A. Differential Effect of Cholesterol and Its Biosynthetic Precursors on Membrane Dipole Potential. Biophys. J. 2012, 102, 1561–1569. 10.1016/j.bpj.2012.03.004. [DOI] [PMC free article] [PubMed] [Google Scholar]
- Berkholz D. S.; Driggers C. M.; Shapovalov M. V.; Dunbrack R. L.; Karplus P. A. Nonplanar Peptide Bonds in Proteins are Common and Conserved but not Biased Toward Active Sites. Proc. Natl. Acad. Sci. U.S.A. 2012, 109, 449–453. 10.1073/pnas.1107115108. [DOI] [PMC free article] [PubMed] [Google Scholar]
- Meher G.; Bhattacharjya S.; Chakraborty H. Membrane Cholesterol Modulates Oligomeric Status and Peptide-Membrane Interaction of Severe Acute Respiratory Syndrome Coronavirus Fusion Peptide. J. Phys. Chem. B 2019, 123, 10654–10662. 10.1021/acs.jpcb.9b08455. [DOI] [PubMed] [Google Scholar]
- Song W.; Corey R. A.; Ansell B. T.; Cassidy K. C.; Horrell M. R.; Duncan A. L.; Stansfeld P. J.; Sansom M. S. P. PyLipID: A Python Package for Analysis of Protein–Lipid Interactions from Molecular Dynamics Simulations. J. Chem. Theory Comput. 2022, 18, 1188–1201. 10.1021/acs.jctc.1c00708. [DOI] [PMC free article] [PubMed] [Google Scholar]
- Nawrocki G.; Im W.; Sugita Y.; Feig M. Clustering and Dynamics of Crowded Proteins near Membranes and their Influence on Membrane Bending. Proc. Natl. Acad. Sci. U.S.A. 2019, 116, 24562–24567. 10.1073/pnas.1910771116. [DOI] [PMC free article] [PubMed] [Google Scholar]
- Mondal S.; Cui Q. Coacervation of Poly-Electrolytes in the Presence of Lipid Bilayers: Mutual Alteration of Structure and Morphology. Chem. Sci. 2022, 13, 7933–7946. 10.1039/D2SC02013K. [DOI] [PMC free article] [PubMed] [Google Scholar]
- Sikda S.; Banerjee M.; Vemparala S. Role of Disulphide Bonds in Membrane Partitioning of a Viral Peptide. J. Membr. Biol. 2022, 255, 129–142. 10.1007/s00232-022-00218-0. [DOI] [PMC free article] [PubMed] [Google Scholar]
Associated Data
This section collects any data citations, data availability statements, or supplementary materials included in this article.


