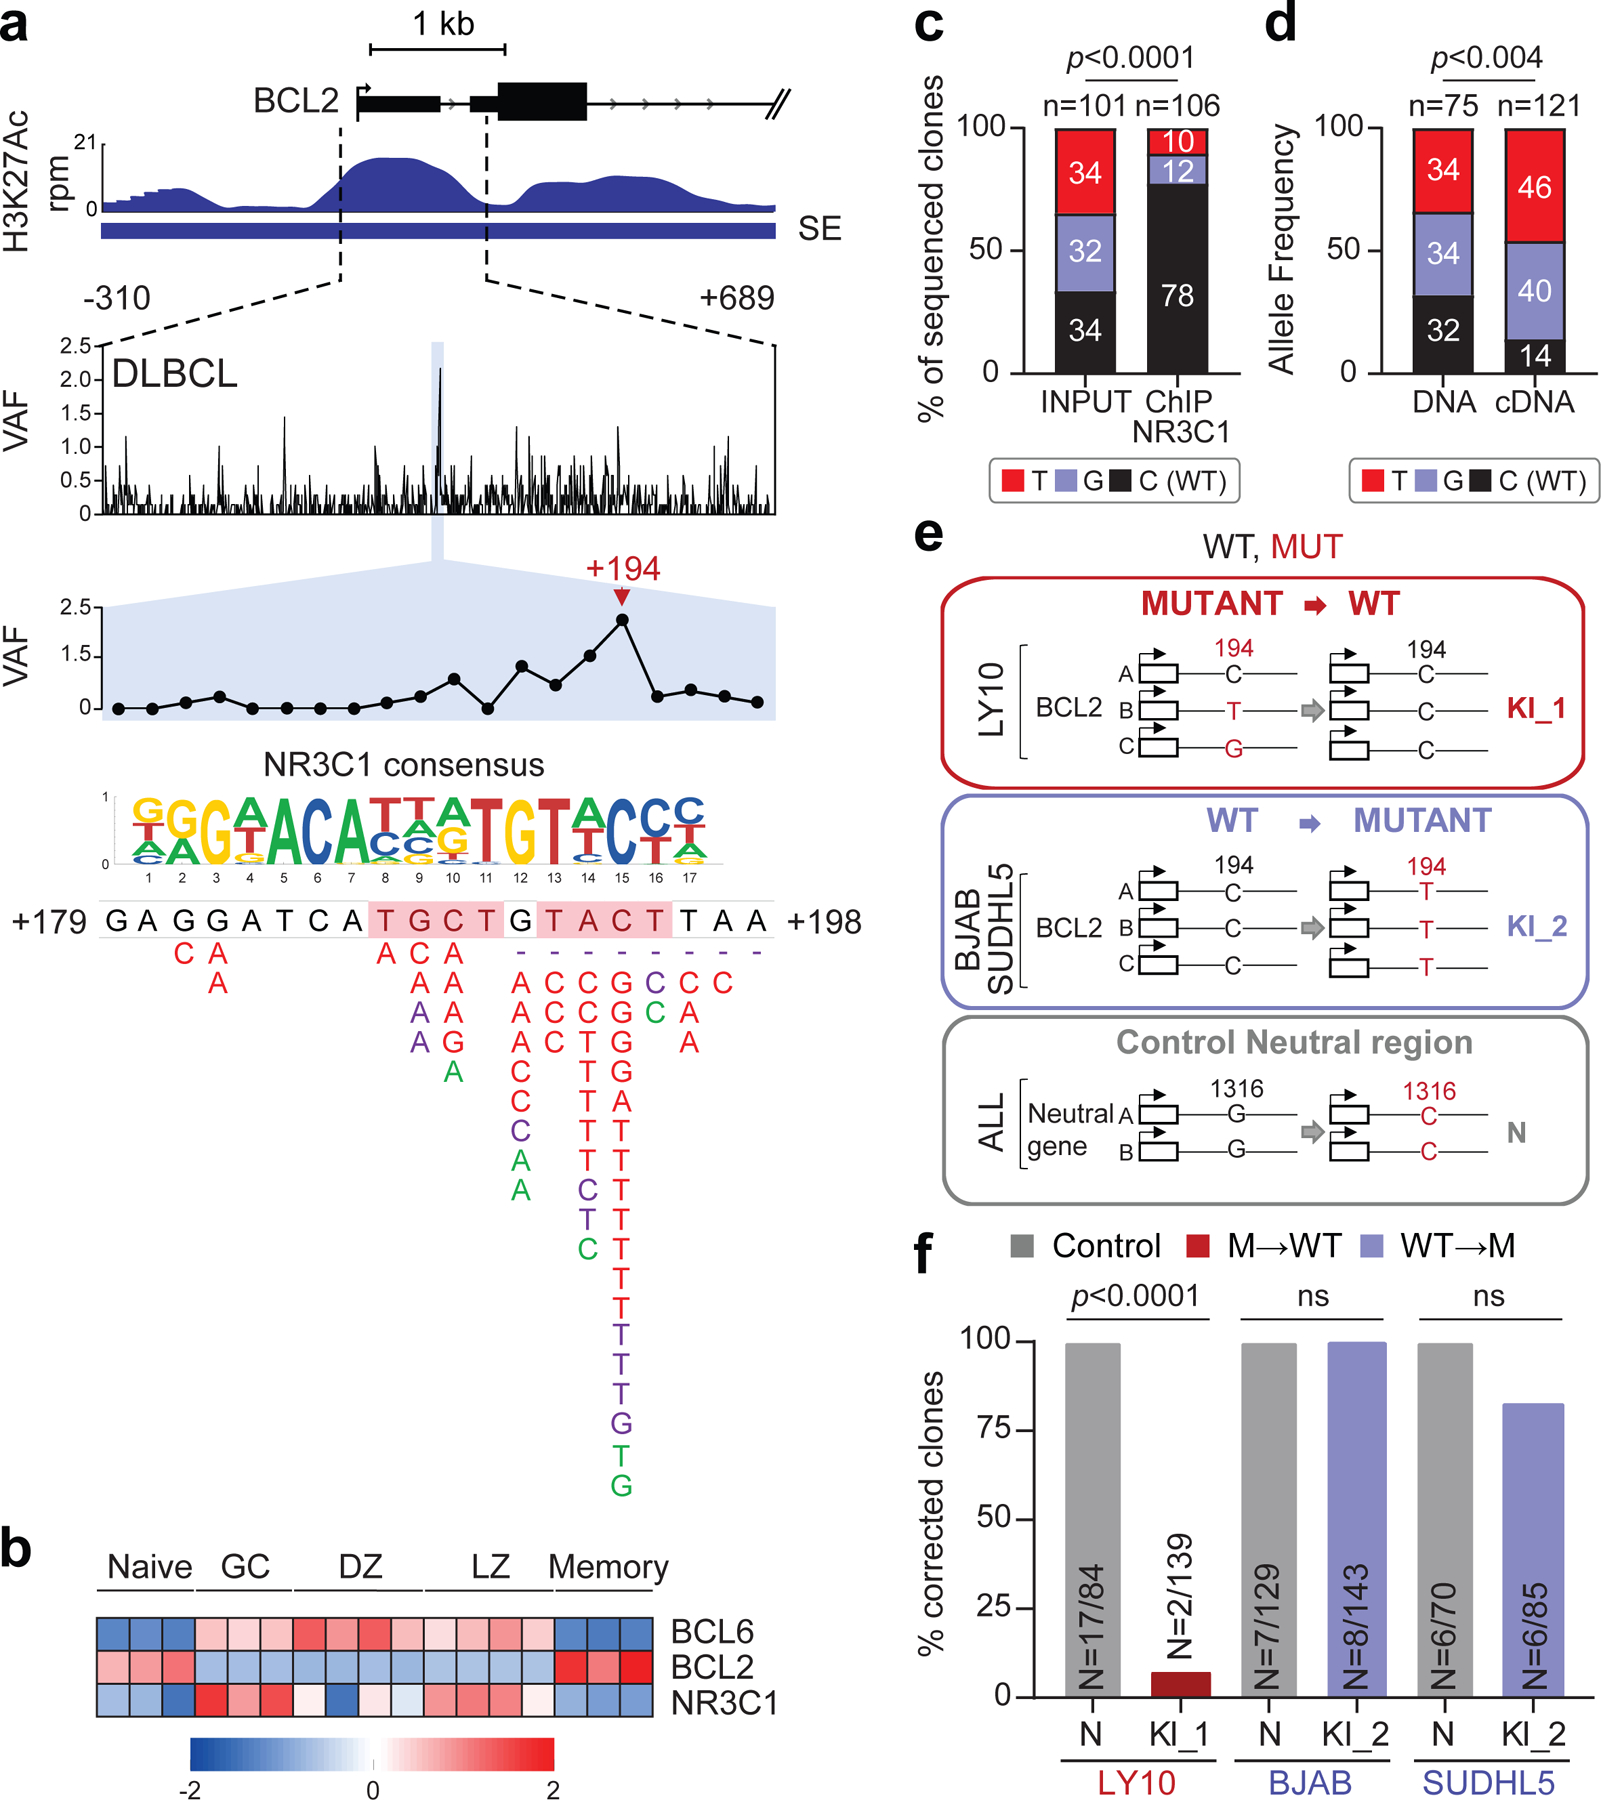
Figure 5: Hotspot mutations in the BCL2 SE prevent NR3C1 binding and transcriptional regulation.

a. H3K27Ac ChIP-seq track of the BCL2 iSE in LY10 (top). The highlighted region is expanded below the track to show VAFs in primary DLBCL cases. The mutational hotspot at position +179–198 (blue shadow) is further magnified, with the predicted NR3C1 consensus binding motif aligned to the reference sequence, and SNVs positioned below (positions according to NCBI NM_000633) (red, WGS data; purple, Sanger sequencing data; green, cell lines; dotted lines, deletions; shadowed sequence, AID recognition motif). b. BCL6, BCL2 and NR3C1 expression in normal B-cell subsets. Data are expressed as log2 TPM, and scale bar indicates the Z-score. c. Allelic quantification of input and NR3C1-IP DNA in LY10, as assessed by PCR amplification and cloning (note that LY10 has 3 BCL2 alleles). The total number of clones sequenced is indicated inside the bars (2 independent experiments). d. Relative proportion of the 3 BCL2 alleles in LY10 DNA and cDNA, as determined by sequencing analysis of cloned PCR products (2 independent experiments). e. Design of the CRISPR-Cas9 experiment utilized to correct the mutations in LY10 (red), introduce the C194T mutation in two BCL2-negative cell lines (blue), and edit the control PPP1R12C gene in all cell lines (grey). f. Normalized percentage of corrected clones recovered in the CRISPR-Cas9 experiments. In each cell line, the percentage of properly mutated clones in the neutral region was set as 100%, and absolute numbers are given inside the bars (one representative experiment out of 2 that gave similar results). P-values in c,d,f were calculated by two-tailed Fisher’s exact test.
