

Abstract
Aim
To assess the psychometric properties of the Nepali language version of the Depression Anxiety Stress Scales (DASS‐21).
Design
Descriptive, cross‐sectional survey.
Methods
The DASS‐21 was administered (May–July 2019) among 794 randomly selected older adults aged ≥60 years. Factor structure was evaluated using exploratory and confirmatory factor analyses. Cronbach's alpha was calculated, and correlation analyses with quality of life evaluated convergent validity.
Results
Exploratory factor analysis indicated that the 21 items loaded on three factors, with factor loadings ranging from 0.50–0.88. Confirmatory factor analysis suggested a four‐factor model including the three subscales and an additional common 'general distress’ factor, which demonstrated a better overall fit. Good reliability was found for each subscale, with Cronbach's alphas 0.79 for Anxiety, 0.91 for Stress, and 0.93 for Depression. The Nepali language version of the DASS‐21 satisfied convergent validity with all subscales depicting significant negative correlations with quality of life demonstrating adequate psychometric properties.
Keywords: DASS‐21, factor analysis, Nepal, psychometric properties, reliability, validity
1. INTRODUCTION
The Depression Anxiety Stress Scales (DASS), developed by Lovibond and Lovibond (1995a), is a set of screening tools designed to assess depression, anxiety and stress. The DASS questionnaire is a 42‐item instrument, which has been widely used among different population groups in diverse study settings due to its applicability to assess multiple domains of negative emotional states. The DASS‐21 is the abbreviated version of the original DASS scale with seven items for each subscale. The psychometric properties of the DASS‐21 have been assessed among clinical (Gloster et al., 2008; Musa et al., 2011; Ramli & Salmiah, 2009) and non‐clinical populations (Gomez et al., 2014; Henry & Crawford, 2005; Osman et al., 2012) confirming its validity and reliability.
The original design of the DASS proposed by Lovibond and Lovibond (1995b) was to assess depression, anxiety and stress as three distinct factors. Studies evaluating the factor structure of the DASS‐21 using both exploratory (Akin & Çetın, 2007; Saricam, 2018; Tonsing, 2014; Vignola & Tucci, 2014) and confirmatory (Gomez et al., 2014; Pezirkianidis et al., 2018; Sinclair et al., 2012; Wood et al., 2010) analyses have supported the original three‐factor structure. However, some analyses have supported alternative models to the original three‐factor structure (Imam, 2008; Le et al., 2017; Szabó, 2010; Tully et al., 2009; Yusoff, 2013). Le et al. (2017), for example, did not confirm the original three‐factor structure and thus included a fourth factor, ‘General Distress’, supported in other studies (Henry & Crawford, 2005; Osman et al., 2012). Other potential structural issues have been identified, with Imam (2008) and Wang et al. (2016) finding items of the DASS‐21 not loading to their corresponding subscales, while Tran et al. (2013) reported all 21 items loading on a single factor.
Most research using the DASS‐21 reports good internal consistency (Antony et al., 1998; Gloster et al., 2008; Sinclair et al., 2012) and temporal reliability (Asghari et al., 2008; Gomez et al., 2014; Saricam, 2018). The divergent validity of the DASS‐21 has been extensively analysed showing significant correlations with other scales measuring similar constructs including the Beck Anxiety Inventory (Akin & Çetın, 2007; Gloster et al., 2008; Vignola & Tucci, 2014), the Beck Depression Inventory (Akin & Çetın, 2007; Antony et al., 1998; Vignola & Tucci, 2014), the Hospital Anxiety and Depressive Scale (Musa et al., 2011) and the State‐Trait Anxiety Inventory (Antony et al., 1998; Wang et al., 2016). The DASS‐21 scale also demonstrated discriminant validity by differentiating between clinical and non‐clinical populations for different diagnostic groups (Akin & Çetın, 2007; Antony et al., 1998; Daza et al., 2002).
2. BACKGROUND
The DASS‐21 has been extensively used across different cultural and ethnic groups. The translated versions have been validated in different languages including Greek (Pezirkianidis et al., 2018), Malaysian (Ramli et al., 2012; Ramli & Salmiah, 2009), Spanish (Ruiz et al., 2017), Turkish (Saricam, 2018), Chinese (Wang et al., 2016), Korean (Lee et al., 2019), Hindi (Singh et al., 2013), Vietnamese (Le et al., 2017; Tran et al., 2013; Van Nguyen et al., 2015) and Brazilian Portuguese (Vignola & Tucci, 2014).
While the DASS‐21 has been widely evaluated across the globe in different languages, a Nepali version has not been validated in Nepal, despite the fact that recent studies have used a Nepalese version to assess mental health (Paudel et al., 2020; Samson, 2020; Sharma et al., 2019). In addition, many previous studies assessing mental health among older adults in Nepal have used the Geriatric Depression Scale (Thapa et al., 2018) measuring depression, rather than assessing other dimensions of mental health. Given the high prevalence of depression, anxiety and other mental disorders in Nepal, the DASS‐21 may be a useful screening tool to identify the mental health symptoms in their early phase. Further, as Nepali language speaking community are spread across the world (for example in Hong Kong, Tonsing, 2014), it has broader implications beyond Nepal to assess the mental health of Nepali speaking population to inform nurses and other healthcare professionals. In addition, while the DASS has been extensively used in research with older adults, few studies (Gloster et al., 2008; Gomez et al., 2014) have reported its validity and reliability among this cohort. The present study aimed to assess the psychometric properties of the Nepali language translated version of the DASS‐21 among community‐dwelling older adults in Nepal. More specifically, the study aimed to determine the latent structure, internal consistency and convergent validity of the Nepali language version of the DASS‐21.
Companion papers from this study assessed the prevalence and risk factors of mental health symptoms (Thapa et al., 2020a) and the quality of life of older parents left‐behind (Thapa et al., 2020b), and a further paper describing the mental health of left‐behind older parents is currently under review (authors).
3. METHODS
3.1. Design
Cross‐sectional population‐based survey among randomly selected community‐dwelling older adults.
3.2. Study settings and participants
This research used data from a survey performed between May–July 2019 in Lumbini Province in Nepal. A multistage sampling technique was employed to access study participants, which encompassed: (i) purposive selection of two districts (Rupandehi and Arghakachi) from the Lumbini province; (ii) random selection of three municipalities from each of the two districts (six municipalities in total); (iii) random selection of three villages in each of the six municipalities (18 villages in total); and (iv) random selection of older adults using the probability proportionate to size method from each of the selected villages. Samples were drawn from a sampling frame developed from the Nepal Election Commission 2017 Voters' List and comprised the list of older people aged 60 years or over living in the selected Municipalities. The inclusion criteria were older people with at least one child aged 18 years or over. Participants who could not provide informed consent, or did not have the ability to respond to the questionnaire, or were not able to speak Nepali were excluded. Data were collected through face‐to‐face interviews, conducted individually and responses recorded on android tablets using the Research Electronic Data Capture (REDCap; Harris et al., 2009). A total of 810 people were approached, with 794 included in the final analysis.
3.3. Ethics
Research Ethics Committee approval was obtained from the University of Tasmania (Reference number H0017555) and the Nepal Health Research Council (Registration number 729/2018). Letters of approval were obtained from the respective municipalities. Informed written consent was obtained from each participant prior to the interview.
3.4. Measures
3.4.1. Depression Anxiety Stress Scales (DASS‐21)
The DASS‐21 (Lovibond & Lovibond, 1995a) measures the prevalence of symptoms of three subscales, depression, anxiety and stress, over the previous week. Each subscale has seven items with answers reported on a four‐point Likert scale ranging from ‘0’ (does not apply to me) to ‘3’ (applies to me most of the time). The subscale scores are obtained by summing the individual item scores, with a maximum total score of 21 for each subscale. The final score is obtained by multiplying the score by two to obtain the equivalent score for the DASS‐42. The original study (Lovibond & Lovibond, 1995b) reported a high reliability of the DASS‐21, with Cronbach's alpha for the depression, anxiety and stress subscales of 0.91, 0.84 and 0.90, respectively. The depression and anxiety subscales correlated strongly with the Beck Depression Inventory (r = .74) and the Beck Anxiety Inventory (r = .81), respectively. The Nepali version of the DASS‐21 (Tonsing, 2014) was refined for this study. The original English version (Lovibond & Lovibond, 1995a) and its Nepali translated version are presented as Appendix S1.
3.4.2. Quality of life
Quality of life (QOL) was assessed using the WHOQOL‐BREF scale (WHOQOL Group, 1998), which is a 26‐item self‐report instrument. WHOQOL‐BREF subjectively measures perceived QOL across four domains: physical health (seven items), psychological health (six items), social relationships (three items) and environment (eight items). The WHOQOL‐BREF has demonstrated adequate validity, test–retest reliability and internal consistency (α ranging from 0.84 for physical health to 0.66 for social relationships; WHOQOL Group, 1998).
3.5. Statistical analysis
The psychometric properties of the DASS‐21 were examined by exploratory (EFA) and confirmatory factor analysis (CFA) for construct validity, Cronbach's alpha for reliability and correlation analysis with the WHOQOL‐BREF dimensions for convergent validity. This study employed principal components extraction methods for EFA with the number of factors determined by the scree test and eigenvalues (Nesselroade & Cattell, 2013). The correlations between the three subscales of the DASS‐21 in this study were strong and statistically significant (p < .0001), which is consistent with previous studies which suggest that the three subscales are associated. Given the correlations among the factors, oblique rotation (promax) was applied. Factor loadings higher than 0.4 were considered good (Piedmont, 2014). Correlations between the items and the total scores of each subscale were also analysed. Higher correlations of items with the subscale to which they belong indicate good validity.
To examine whether the Nepali version of the DASS‐21 supports the construct of the three factors of the original DASS‐21, its construct validity was evaluated using CFA. Models examined were based on the results from previous DASS‐21 factor structure research. As the DASS‐21 subscales were not normally distributed, factor invariance was examined using structural equation modelling (SEM) with the asymptotic distribution free (ADF) estimation technique using the STATA 16.1 version. IBM SPSS Amos software (version 27) was used for SEM when convergence was not achieved for a model in STATA. Factors were allowed to correlate in the models without covariances between error terms. The goodness of fit of the tested models was assessed using the following fit indices:
Chi‐square likelihood ratio test (Alavi et al., 2020), with lack of significance (p ≥ .05) indicating a good fit (Hooper et al., 2008);
Comparative Fit Index (CFI; Bentler, 1990), which should be ≥0.90 for an adequate fit;
Tucker–Lewis Index (TLI; Tucker & Lewis, 1973), which should be >0.90 for an adequate fit (Hu & Bentler, 1999);
Root Mean Square Error of Approximation (RMSEA; Browne & Cudeck, 1993), which should be ≤0.05 for a model fit (Hoyle, 1995);
Standardized Root Mean Square Residual (SRMR; Hu & Bentler, 1995), which should be ≤0.08 (Hu & Bentler, 1999);
Akaike's Information Criterion (AIC), with smaller AIC indicating better fit; and
Bayesian Information Criterion (BIC; Neath & Cavanaugh, 2012) with smaller BIC indicating better fit.
To assess the reliability, the internal consistency of the Nepali version was examined by calculating Cronbach's alpha coefficients for the overall scale and the three subscales. Values higher than 0.70 indicate good internal consistency (DeVellis, 2016). Additionally, we calculated corrected item‐total correlations of the three subscales, which is the correlation of each of the DASS items with its own DASS subscale with that item removed. Convergent validity was evaluated by examining the correlation of DASS‐21 scores with WHOQOL‐BREF.
4. RESULTS
4.1. Sample characteristics
Table 1 provides the sociodemographic profile of the sample (N = 794). The mean age of the participants was 71.1 (SD = 8.2, range 60–107) years. Almost half of the participants (47.9%) were 60–69 years old. More than half (52.1%) were male, and 61% were married. The majority of the participants could not read or write. Agriculture (47.1%) was the main occupation, and nearly one‐third of the older adults were not currently working. Table 2 shows the summary statistics of the measures used in this study.
TABLE 1.
Participant characteristics
| N | % | |
|---|---|---|
| Sex | ||
| Female | 380 | 47.9 |
| Male | 414 | 52.1 |
| Marital status | ||
| Married/living with spouse | 484 | 61.0 |
| Single (widowed, divorced, separated, unmarried) | 310 | 39.0 |
| Age (years) | ||
| 60–69 | 380 | 47.9 |
| 70–79 | 273 | 34.4 |
| ≥80 | 141 | 17.8 |
| Education | ||
| Unable to read or write | 377 | 47.5 |
| Literate, but no schooling | 246 | 31.0 |
| Primary level (grade 1–5) | 77 | 9.7 |
| Secondary level (grade 6–10) | 50 | 6.3 |
| Higher secondary or above | 44 | 5.5 |
| Occupation | ||
| Agriculture | 374 | 47.1 |
| House duties | 116 | 14.6 |
| Daily wage/labour | 12 | 1.5 |
| Service/regular income | 15 | 1.9 |
| Business/self‐employed | 36 | 4.5 |
| Currently not working | 241 | 30.4 |
TABLE 2.
Descriptive statistics of the study variables
| Variables | N | Possible range | Mean | SD | Min | Max |
|---|---|---|---|---|---|---|
| DASS Depression | 794 | 0–42 | 4.2 | 7.6 | 0.0 | 40.0 |
| DASS Anxiety | 794 | 0–42 | 3.6 | 5.0 | 0.0 | 36.0 |
| DASS Stress | 794 | 0–42 | 5.1 | 7.4 | 0.0 | 38.0 |
| QOL Physical | 790 | 0–100 | 58.8 | 19.8 | 3.6 | 100.0 |
| QOL Psychological | 791 | 0–100 | 63.7 | 18.0 | 0.0 | 100.0 |
| QOL Social | 794 | 0–100 | 60.7 | 16.2 | 8.3 | 100.0 |
| QOL Environmental | 790 | 0–100 | 61.7 | 15.0 | 9.4 | 100.0 |
4.2. Exploratory factor analysis
The study employed the principal components extraction method for factor analysis, and the number of factors was determined by the scree test and eigenvalues (Nesselroade & Cattell, 2013). As the three subscales of the DASS‐21 are strongly correlated with each other, oblique rotation was applied. Both the scree plot and eigenvalues greater than one criteria indicated a three‐factor solution (eigenvalues 11.59, 1.61 and 1.38), with this model accounting for 69.5% of the variance. The Kaiser–Meyer–Olkin (KMO) test result was 0.960 (χ 2 = 14,034, p < .0001), indicating high adequacy of the model. Table 3 shows the factor loadings for each item of the DASS‐21 with factor loadings >0.40 demonstrating adequate loading.
TABLE 3.
Items and factor loadings for the DASS‐21
| Item # | Variable | Factor 1 | Factor 2 | Factor 3 |
|---|---|---|---|---|
| 10 | I felt that I had nothing to look forward to (D) | 0.847 | 0.139 | −0.121 |
| 13 | I felt down‐hearted and blue (D) | 0.831 | 0.030 | 0.099 |
| 11 | I found myself getting agitated (S) | 0.805 | 0.101 | 0.026 |
| 18 | I felt that I was rather touchy (S) | 0.774 | 0.140 | 0.003 |
| 1 | I found it hard to wind down (S) | 0.721 | 0.003 | 0.246 |
| 3 | I could not seem to experience any positive feeling (D) | 0.695 | 0.134 | 0.134 |
| 12 | I found it difficult to relax (S) | 0.597 | 0.218 | 0.089 |
| 21 | I felt that life was meaningless (D) | 0.592 | 0.423 | −0.207 |
| 16 | I was unable to become enthusiastic about anything (D) | 0.538 | 0.486 | −0.093 |
| 15 | I felt I was close to panic (A) | 0.038 | 0.882 | 0.037 |
| 20 | I felt scared without any good reason (A) | 0.018 | 0.878 | 0.028 |
| 9 | I was worried about situations in which I might panic and make a fool of myself (A) | 0.071 | 0.821 | 0.032 |
| 14 | I was intolerant of anything that kept from getting on with what I was doing (S) | 0.239 | 0.677 | 0.087 |
| 8 | I felt I was using a lot of nervous energy (S) | 0.184 | 0.598 | 0.244 |
| 17 | I felt I was not worth much as a person (D) | 0.470 | 0.548 | −0.214 |
| 5 | I found it difficult to work up the initiative (D) | 0.306 | 0.506 | 0.044 |
| 6 | I tended to over‐react to situations (S) | 0.216 | 0.495 | 0.073 |
| 7 | I experienced trembling (A) | −0.152 | 0.170 | 0.737 |
| 4 | I experienced breathing difficulty (A) | 0.108 | −0.015 | 0.695 |
| 19 | I was aware of the action of my heart in the absence of physical exertion (A) | −0.207 | 0.468 | 0.587 |
| 2 | I was aware of dryness of my mouth (A) | 0.546 | −0.396 | 0.576 |
| Eigenvalue | 11.59 | 1.61 | 1.38 | |
| Variance (%) | 55.2 | 7.7 | 6.6 | |
| Total variance: 69.5% |
Kaiser–Meyer–Olkin measure of sampling adequacy (KMO) = 0.960; Bartlett's test of sphericity (χ 2) = 14,034.1, p < .0001. Factor loadings >0.40 are presented in bold.
Abbreviations: A, Anxiety; D, Depression; S, Stress.
The three factors did not reproduce the loading intended by the DASS‐21 subscales. Five items from the depression subscale and four items from the stress subscale loaded to Factor 1 (Depression). Two items from the depression subscale, three from anxiety and two from stress loaded to Factor 2 (Stress). The third factor (Anxiety) consisted of only four items, all from the anxiety subscale. There were five cross‐loading items observed (secondary loadings of 0.40 or greater), as shown in Table 3.
4.3. Confirmatory factor analysis
Nine different structural models were assessed using confirmatory factor analysis, with the fit indices for the models presented in Table 4. A one‐factor model (Model 1) was tested in which all items of the DASS‐21 scale were allowed to load to a single ‘emotional state’ factor (Tran et al., 2013). This did not provide a good fit. A two‐factor model collapsing the depression and anxiety scales (Model 2) was assessed, as depression and anxiety may not be independent constructs in an older population (Schoevers et al., 2003). Similarly, other two‐factor models collapsing the depression and stress scales (Model 3) and the anxiety and stress scales (Model 4), as proposed by Brown et al. (1997), were also assessed. These two‐factor models, except Model 2, significantly improved the model fit compared to Model 1 (p value of Δχ 2 < .05); however, the model fit indices remained unsatisfactory.
TABLE 4.
Confirmatory factor analysis (model fit indices) for the tested models of DASS‐21
| Model | χ2 | df | CFI | TLI | RMSEA | SRMR | AIC | BIC | χ2 difference (Δχ2 ) |
|---|---|---|---|---|---|---|---|---|---|
| M1: 1‐Factor model | 452.38*** | 189 | 0.768 | 0.742 | 0.042 | 0.160 | 536.38 | 732.82 | |
| M2: 2‐Factor model DA‐S | 572.72*** | 188 | 0.661 | 0.624 | 0.051 | 0.207 | 656.72 | 853.16 | M1–M2 = −120.34*** |
| M3: 2‐Factor model AS‐D | 450.97*** | 188 | 0.768 | 0.741 | 0.042 | 0.158 | 536.97 | 738.08 | M1–M3 = 1.41* |
| M4: 2‐Factor model DS‐A | 446.56*** | 188 | 0.772 | 0.745 | 0.042 | 0.155 | 532.56 | 733.67 | M1–M4 = 5.82** |
| M5: 3‐Factor model (original model) | 441.05*** | 186 | 0.775 | 0.746 | 0.042 | 0.150 | 531.05 | 741.52 | M4–M5 = 5.51* |
| M6: 3‐Factor model identified from the EFA | 437.83*** | 186 | 0.778 | 0.749 | 0.041 | 0.140 | 527.83 | 738.30 | M4–M6 = 8.73** |
| M7: 3‐Factor model identified from the EFA, considering the double‐loading items | 413.52*** | 181 | 0.795 | 0.762 | 0.040 | 0.117 | 513.52 | 747.38 | M4–M7 = 33.04*** |
| M8: 4‐Factor model | 338.99*** | 165 | 0.913 | 0.901 | 0.036 | 0.095 | 470.99 | 779.68 | M7–M8 = 74.53*** |
| M9: Second‐order model | 445.05*** | 186 | 0.771 | 0.742 | 0.043 | 0.149 | 531.05 | 741.52 | M8–M9 = −106.06*** |
Abbreviations: A, Anxiety; AIC, Akaike's Information Criterion; BIC, Bayesian Information Criterion; CFI, Comparative Fit Index; D, Depression; df, degrees of freedom; RMSEA, Root Mean Square Error of Approximation; S, Stress; SRMR, Standardized Root Mean Square Residual; TLI, Tucker‐Lewis Index.
p < .05.
p < .01.
p < .001.
A three‐factor model consistent with the original scale design (Model 5) and a three‐factor model allowing the items to load to one of the three factors as identified from the EFA (KMO >0.4; Model 6) were tested. Both models showed improved model fit compared with one‐ and two‐factor models but did not provide adequate fit indices. Model 6 was then modified to allow for cross‐loadings of items based on the results of the EFA for this study (Model 7); improvements were observed across most indices with CFI, TLI and RMSEA meeting the model fit criteria. A four‐factor model (Model 8) was tested, which included the three factors of the original model and one additional factor, ‘General Distress’ (Le et al., 2017; Szabó, 2010) to which all items were allowed to load. Model 8 showed optimal fit according to the model fit indices, except SRMR, compared with other models. However, the SRMR value for Model 8 was the lowest when compared to other models indicating better fit. The chi‐square statistic, although statistically significant, was also lower than for other models tested. All items, with the exception of three from the anxiety subscale, loaded significantly in this model (Figure 1).
FIGURE 1.
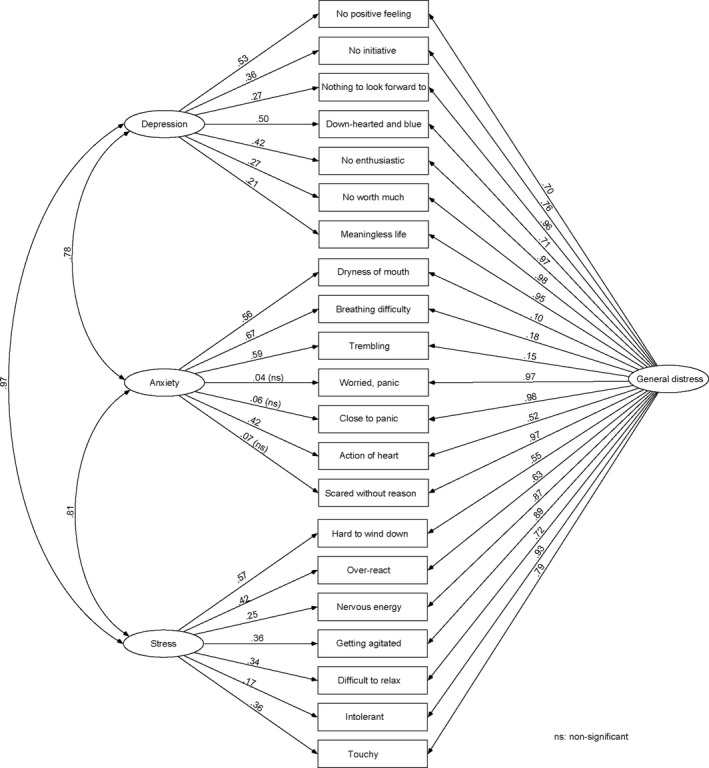
Confirmatory factor analysis of DASS‐21, the best fit model (Model 8)
A second‐order four‐factor model (Model 9) suggested by some studies (Lee et al., 2019; Osman et al., 2012; Ruiz et al., 2017) was also tested. This model included a second‐order factor linking the three latent factors—depression, anxiety and stress—but, with no direct item loading on this common factor. The results showed that the second‐order factor model did not provide better fit than the first order four‐factor model.
4.4. Reliability
The Nepali version of the DASS‐21 had adequate internal reliability with Cronbach alpha values of 0.95 for the overall scale, 0.93 for depression, 0.79 for anxiety and 0.91 for stress (Table 5). The corrected item‐rest correlation for the overall scale ranged from 0.35–0.83, with an item‐rest correlation higher than 0.3 for all three subscales demonstrating good internal consistency for the DASS‐21. Appendix S2 shows inter‐item correlations for the individual DASS‐21 items with each other.
TABLE 5.
Internal consistency of DASS‐21
| Scale/subscale | Cronbach's alpha | Item‐test correlation | Item‐rest correlation |
|---|---|---|---|
| Total scale | 0.95 | 0.40–0.85 | 0.35–0.83 |
| Depression | 0.93 | 0.77–0.88 | 0.66–0.83 |
| Anxiety | 0.79 | 0.59–0.77 | 0.37–0.67 |
| Stress | 0.91 | 0.69–0.86 | 0.58–0.79 |
4.5. Convergent validity
Between‐scale correlation coefficients were 0.72 for depression and anxiety, 0.91 for depression and stress and 0.79 for anxiety and stress, with correlations between individual items ranging from 0.17–0.85. The convergent validity of the scale was examined by correlating the DASS‐21 scores with the WHOQOL‐BREF instrument. All four QOL dimensions were negatively correlated with subscales of the DASS‐21 (Table 6). These correlations were higher for psychological and physical QOL dimensions. All correlations were significant (p < .001) and represented moderate associations with QOL dimensions, demonstrating convergent validity.
TABLE 6.
Correlation among the study variables
| Variables | (1) | (2) | (3) | (4) | (5) | (6) | (7) |
|---|---|---|---|---|---|---|---|
| (1) DASS Depression | 1 | ||||||
| (2) DASS Anxiety | 0.72 | 1 | |||||
| (3) DASS Stress | 0.91 | 0.79 | 1 | ||||
| (4) QOL Physical | −0.55 | −0.54 | −0.58 | 1 | |||
| (5) QOL Psychological | −0.65 | −0.52 | −0.62 | 0.69 | 1 | ||
| (6) QOL Social | −0.37 | −0.36 | −0.37 | 0.54 | 0.65 | 1 | |
| (7) QOL Environmental | −0.41 | −0.42 | −0.41 | 0.61 | 0.74 | 0.67 | 1 |
All the correlation coefficients were significant at p < .001.
5. DISCUSSION
The study primarily aimed to investigate the factorial structure of the Nepalese version of the DASS‐21. An EFA conducted using an oblique rotation varimax identified three factors for the DASS‐21 with eigenvalues >1 with the model explaining 69.5% of the total variance. In contrast to previous studies (Akin & Çetın, 2007; Antony et al., 1998; Crawford & Henry, 2003; Gloster et al., 2008; Gomez et al., 2014; Lovibond & Lovibond, 1995a; Saricam, 2018; Tonsing, 2014; Vignola & Tucci, 2014; Wood et al., 2010), this study identified alternative models to the original grouping of the DASS‐21 items into three subscales. Some items did not load to their corresponding factors, while a few items also demonstrated cross‐loading. A CFA analysis using structural equation modelling did not demonstrate that the original three‐factor solution of the DASS‐21 was to be preferred to competing models. This result indicated that the Nepali version of the DASS‐21 may not adequately distinguish between depression, anxiety and stress in this setting.
This study assessed participants 60 years of age and older, while most previous studies assessed adults and adolescents. The inherent differences between these cohorts may account for the difference between these results and those of previous studies. Differences in socioeconomic demographics from other studies may result in differing levels of awareness and recognition of emotional health.
Based on the recommended cut‐off criteria of the DASS‐21, we have previously reported a high prevalence of anxiety from this sample (Thapa et al., 2020a). Some anxiety items also could not load significantly on the anxiety subscale. This could be because the items in the anxiety subscale may have been interpreted by participants as being related to somatic symptoms (such as difficulty breathing and trembling hands). Participants might also have reported these symptoms more frequently due to the presence of symptoms with a physical cause.
A model with depression and stress subscales collapsed together (Model 4 in Table 4) showed better fit compared with other two‐factor models; however, many of the model fit indices did not meet the criteria. A three‐factor model identified from the EFA in this study considering the double‐loading items (Model 7) was superior to other three‐factor models. Finally, among the eight models tested, a four‐factor model including the three factors of the original model and one additional factor, ‘General Distress’, where all the items of the scale were permitted to load, yielded relatively better model fit indices. This result aligns with Le et al. (2017) and Szabó (2010), where a four‐factor latent structure representing general distress, depression, anxiety and stress factors, provided the best fit for adolescent data. Imam (2008) also did not support a simple factor structure for the DASS‐21.
One reason for the limited support for the original three‐factor model identified in the literature is likely the overlapping of mental health states such as anxiety and depression in assessment (Afzali et al., 2017; Bleich et al., 1997; Gros et al., 2012). The samples in this study showed high correlation between depression and stress. The Nepali version of the DASS‐21 may not be able to distinguish older adults experiencing depression from those under stress. While the DASS‐21 may be able to detect significant ‘Negative Affect’, it may be less able to distinguish between the specific states. The strong correlations between the three factors also suggested the similarity between these factors. Tran et al. (2013) reported somewhat similar results, with the DASS‐21 able to detect the common mental disorders of depression and anxiety, but not able to distinguish those experiencing depression from anxiety. Research has shown that among older adults, it is difficult to differentiate between depression, anxiety and stress (Lenze et al., 2005).
The Nepali version of the DASS‐21 showed adequate internal consistency in line with previous studies. Moderate negative correlations with QoL dimensions support the convergent validity of the Nepali version, with correlations in this direction expected. These results demonstrate that the Nepali version of the DASS‐21 is a reliable and valid instrument with which to assess negative emotional states. This indicates that the DASS‐21 maybe a suitable instrument for use by nursing and other health professionals working with Nepali speaking older people.
5.1. Limitations
The study did not validate the scale with an independently administered diagnostic interview, which is considered the gold standard of scale validity testing. Scores were not compared across diagnostic groups and no clinical group was studied. The sample consisted of older adults aged 60 years and over, and the factor structure of the Nepali version of the DASS‐21 may be different for other age groups. Due to the cross‐sectional nature of the study, the data could not provide test–retest reliability over time.
5.2. Research and policy implications
Nursing and other healthcare professionals would benefit from an enhanced understanding of the relationship between depression, anxiety and stress. The empirical overlap between the three subscales of the DASS‐21 showed that there could be similar symptoms and risk factors for depression, stress and anxiety in this setting. At a community level, it may not be necessary to distinguish between these states among the older population, as interventions addressing these risks will be similar (Tran et al., 2013). Universal psychosocial programmes targeting these risks could have a positive effect on overall mental health and well‐being. Further validation of the Nepali version of the DASS‐21 among other age groups and educating nursing and other healthcare professionals on the benefits of using the DASS‐21 in assessing the mental health status are suggested. Longitudinal designs involving follow‐ups and comparative studies between the diagnostic groups are also encouraged for future studies.
6. CONCLUSION
The Nepali version of the DASS‐21 has good internal consistency, indicating it is a reliable tool and has significant correlations with the WHOQOL‐BREF, showing its convergent validity. The factor analysis suggests that the DASS‐21 factor structure is different among Nepalese older adults than studies with adult samples in other settings have found. Confirmatory factor analysis could not support the original three‐factor solution of the DASS‐21. A four‐factor model consisting of depression, anxiety, stress and a common general distress factor showed a better fit to the data. Further studies are required to validate the psychometric properties of the Nepali version of DASS‐21.
CONFLICT OF INTEREST
The authors declare that there was no conflict of interest.
Supporting information
Appendix S1
Appendix S2
Thapa, D. K. , Visentin D., Kornhaber R., & Cleary M. Psychometric properties of the Nepali language version of the Depression Anxiety Stress Scales (DASS‐21). Nursing Open, 2022;9: 2608–2617. 10.1002/nop2.959
DATA AVAILABILITY STATEMENT
Data used for this research would be made available on reasonable request by the corresponding author.
REFERENCES
- Afzali, M. H. , Sunderland, M. , Teesson, M. , Carragher, N. , Mills, K. , & Slade, T. (2017). A network approach to the comorbidity between posttraumatic stress disorder and major depressive disorder: The role of overlapping symptoms. Journal of Affective Disorders, 208, 490–496. 10.1016/j.jad.2016.10.037 [DOI] [PubMed] [Google Scholar]
- Akin, A. , & Çetın, B. (2007). The Depression Anxiety and Stress Scale (DASS): The study of validity and reliability. Educational Sciences: Theory & Practice, 7(1), 260–268. [Google Scholar]
- Alavi, M. , Visentin, D. C. , Thapa, D. K. , Hunt, G. E. , Watson, R. , & Cleary, M. (2020). Chi‐square for model fit in confirmatory factor analysis. Journal of Advanced Nursing, 76(9), 2209–2211. 10.1111/jan.14399 [DOI] [PubMed] [Google Scholar]
- Antony, M. M. , Bieling, P. J. , Cox, B. J. , Enns, M. W. , & Swinson, R. P. (1998). Psychometric properties of the 42‐item and 21‐item versions of the Depression Anxiety Stress Scales in clinical groups and a community sample. Psychological Assessment, 10(2), 176–181. 10.1037/1040-3590.10.2.176 [DOI] [Google Scholar]
- Asghari, A. , Saed, F. , & Dibajnia, P. (2008). Psychometric properties of the Depression Anxiety Stress Scales‐21 (DASS‐21) in a non‐clinical Iranian sample. International Journal of Psychology, 2(2), 82–102. [Google Scholar]
- Bentler, P. M. (1990). Comparative fit indexes in structural models. Psychological Bulletin, 107(2), 238–246. 10.1037/0033-2909.107.2.238 [DOI] [PubMed] [Google Scholar]
- Bleich, A. , Koslowsky, M. , Dolev, A. , & Lerer, B. (1997). Post‐traumatic stress disorder and depression: An analysis of comorbidity. The British Journal of Psychiatry, 170(5), 479–482. 10.1192/bjp.170.5.479 [DOI] [PubMed] [Google Scholar]
- Brown, T. A. , Chorpita, B. F. , Korotitsch, W. , & Barlow, D. H. (1997). Psychometric properties of the Depression Anxiety Stress Scales (DASS) in clinical samples. Behaviour Research and Therapy, 35(1), 79–89. 10.1016/S0005-7967(96)00068-X [DOI] [PubMed] [Google Scholar]
- Browne, M. W. , & Cudeck, R. (1993). Alternative ways of assessing model fit. In Bollen K. A., & Long J. S. (Eds.), Testing structural equation models (pp. 136–162). Sage Publications. [Google Scholar]
- Crawford, J. R. , & Henry, J. D. (2003). The Depression Anxiety Stress Scales (DASS): Normative data and latent structure in a large non‐clinical sample. British Journal of Clinical Psychology, 42(2), 111–131. 10.1348/014466503321903544 [DOI] [PubMed] [Google Scholar]
- Daza, P. , Novy, D. M. , Stanley, M. A. , & Averill, P. (2002). The Depression Anxiety Stress Scale‐21: Spanish translation and validation with a Hispanic sample. Journal of Psychopathology and Behavioral Assessment, 24(3), 195–205. 10.1023/a:1016014818163 [DOI] [Google Scholar]
- DeVellis, R. F. (2016). Scale development: Theory and applications (Vol. 26). Sage publications. [Google Scholar]
- Gloster, A. T. , Rhoades, H. M. , Novy, D. , Klotsche, J. , Senior, A. , Kunik, M. , Wilson, N. , & Stanley, M. A. (2008). Psychometric properties of the Depression Anxiety and Stress Scale‐21 in older primary care patients. Journal of Affective Disorders, 110(3), 248–259. 10.1016/j.jad.2008.01.023 [DOI] [PMC free article] [PubMed] [Google Scholar]
- Gomez, R. , Summers, M. , Summers, A. , Wolf, A. , & Summers, J. J. (2014). Depression Anxiety Stress Scales‐21: Factor structure and test‐retest invariance, and temporal stability and uniqueness of latent factors in older adults. Journal of Psychopathology and Behavioral Assessment, 36(2), 308–317. 10.1007/s10862-013-9391-0 [DOI] [Google Scholar]
- Gros, D. F. , Price, M. , Magruder, K. M. , & Frueh, B. C. (2012). Symptom overlap in posttraumatic stress disorder and major depression. Psychiatry Research, 196(2–3), 267–270. 10.1016/j.psychres.2011.10.022 [DOI] [PMC free article] [PubMed] [Google Scholar]
- Harris, P. A. , Taylor, R. , Thielke, R. , Payne, J. , Gonzalez, N. , & Conde, J. G. (2009). Research electronic data capture (REDCap) ‐ A metadata‐driven methodology and workflow process for providing translational research informatics support. Journal of Biomedical Informatics, 42(2), 377–381. 10.1016/j.jbi.2008.08.010 [DOI] [PMC free article] [PubMed] [Google Scholar]
- Henry, J. D. , & Crawford, J. R. (2005). The short‐form version of the Depression Anxiety Stress Scales (DASS‐21): Construct validity and normative data in a large non‐clinical sample. British Journal of Clinical Psychology, 44(2), 227–239. 10.1348/014466505x29657 [DOI] [PubMed] [Google Scholar]
- Hooper, D. , Coughlan, J. , & Mullen, M. (2008). Structural equation modelling: Guidelines for determining model fit. Electronic Journal of Business Research Methods, 6, 53–60. [Google Scholar]
- Hoyle, R. H. (1995). The structural equation modeling approach: Basic concepts and fundamental issues. In Hoyle R. H. (Ed.), Structural equation modeling: Concepts, issues, and applications (pp. 1–15). Sage Publications Inc. [Google Scholar]
- Hu, L.‐T. , & Bentler, P. M. (1995). Evaluating model fit. In Hoyle R. H. (Ed.), Structural equation modeling: Concepts, issues and applications (pp. 76–99). SAGE. [Google Scholar]
- Hu, L.‐T. , & Bentler, P. M. (1999). Cutoff criteria for fit indexes in covariance structure analysis: Conventional criteria versus new alternatives. Structural Equation Modeling: A Multidisciplinary Journal, 6(1), 1–55. 10.1080/10705519909540118 [DOI] [Google Scholar]
- Imam, S. S. (2008). Depression anxiety stress scales (DASS): Revisited. The Journal of Behavioral Science, 3(1), 104–116. [Google Scholar]
- Le, M. T. H. , Tran, T. D. , Holton, S. , Nguyen, H. T. , Wolfe, R. , & Fisher, J. (2017). Reliability, convergent validity and factor structure of the DASS‐21 in a sample of Vietnamese adolescents. PLoS One, 12(7), e0180557. 10.1371/journal.pone.0180557 [DOI] [PMC free article] [PubMed] [Google Scholar]
- Lee, E.‐H. , Moon, S. H. , Cho, M. S. , Park, E. S. , Kim, S. Y. , Han, J. S. , & Cheio, J. H. (2019). The 21‐Item and 12‐Item versions of the Depression Anxiety Stress Scales: Psychometric evaluation in a Korean population. Asian Nursing Research, 13(1), 30–37. 10.1016/j.anr.2018.11.006 [DOI] [PubMed] [Google Scholar]
- Lenze, E. J. , Karp, J. F. , Mulsant, B. H. , Blank, S. , Shear, M. K. , Houck, P. R. , & Reynolds, C. F. (2005). Somatic symptoms in late‐life anxiety: Treatment issues. Journal of Geriatric Psychiatry and Neurology, 18(2), 89–96. 10.1177/0891988705276251 [DOI] [PubMed] [Google Scholar]
- Lovibond, P. F. , & Lovibond, S. H. (1995b). The structure of negative emotional states: Comparison of the Depression Anxiety Stress Scales (DASS) with the Beck Depression and Anxiety Inventories. Behaviour Research and Therapy, 33(3), 335–343. 10.1016/0005-7967(94)00075-U [DOI] [PubMed] [Google Scholar]
- Lovibond, S. H. , & Lovibond, P. F. (1995a). Manual for the depression anxiety stress scales (2nd ed.). Psychology Foundation of Australia. [Google Scholar]
- Musa, R. , Ramli, R. , Abdullah, K. , & Sarkarsi, R. (2011). Concurrent validity of the depression and anxiety components in the Bahasa Malaysia version of the Depression Anxiety and Stress scales (DASS). ASEAN Journal of Psychiatry, 230, 93.95. [Google Scholar]
- Neath, A. A. , & Cavanaugh, J. E. (2012). The Bayesian information criterion: Background, derivation, and applications. Wiley Interdisciplinary Reviews: Computational Statistics, 4(2), 199–203. [Google Scholar]
- Nesselroade, J. R. , & Cattell, R. B. (2013). Handbook of multivariate experimental psychology. Springer Science & Business Media. [Google Scholar]
- Osman, A. , Wong, J. L. , Bagge, C. L. , Freedenthal, S. , Gutierrez, P. M. , & Lozano, G. (2012). The Depression Anxiety Stress Scales—21 (DASS‐21): Further examination of dimensions, scale reliability, and correlates. Journal of Clinical Psychology, 68(12), 1322–1338. 10.1002/jclp.21908 [DOI] [PubMed] [Google Scholar]
- Paudel, S. , Gautam, H. , Adhikari, C. , & Yadav, D. K. (2020). Depression, anxiety and stress among the undergraduate students of Pokhara Metropolitan, Nepal. Journal of Nepal Health Research Council, 18(1), 27–34. 10.33314/jnhrc.v18i1.2189 [DOI] [PubMed] [Google Scholar]
- Pezirkianidis, C. , Karakasidou, E. , Lakioti, A. , Stalikas, A. , & Galanakis, M. (2018). Psychometric properties of the Depression, Anxiety, Stress Scales‐21 (DASS‐21) in a Greek sample. Psychology, 9, 2933–2950. 10.4236/psych.2018.915170 [DOI] [Google Scholar]
- Piedmont, R. L. (2014). Inter‐item correlations. In Michalos A. C. (Ed.), Encyclopedia of quality of life and well‐being research (pp. 3303–3304). Springer, Netherlands. [Google Scholar]
- Ramli, M. , Rosnani, S. , & Aidil Faszrul, A. R. (2012). Psychometric profile of malaysian version of the Depressive, Anxiety and Stress Scale 42‐item (DASS‐42). Malaysian Journal of Psychiatry, 21(1), 3–9. [Google Scholar]
- Ramli, M. , & Salmiah, M. (2009). Validation and psychometric properties of Bahasa Malaysia version of the Depression Anxiety and Stress Scales (DASS) among diabetic patients. Malaysian Journal of Psychiatry, 18(2), 1–7. [Google Scholar]
- Ruiz, F. J. , García Martín, M. , Suárez Falcón, J. C. , & Odriozola González, P. (2017). The hierarchical factor structure of the Spanish version of Depression Anxiety and Stress Scale‐21. International Journal of Psychology and Psychological Therapy, 17(1), 97–105. [Google Scholar]
- Samson, P. (2020). Effect of perceived social support on stress, anxiety and depression among Nepalese nursing students. Indian Journal of Continuing Nursing Education, 21(1), 59. 10.4103/IJCN.IJCN_8_20 [DOI] [Google Scholar]
- Saricam, H. (2018). The psychometric properties of Turkish version of Depression Anxiety Stress Scale‐21 (DASS‐21) in health control and clinical samples. Journal of Cognitive‐Behavioral Psychotherapy and Research, 7(1), 19–30. 10.5455/JCBPR.274847 [DOI] [Google Scholar]
- Schoevers, R. , Beekman, A. , Deeg, D. , Jonker, C. , & Tilburg, W. V. (2003). Comorbidity and risk‐patterns of depression, generalised anxiety disorder and mixed anxiety‐depression in later life: Results from the AMSTEL study. International Journal of Geriatric Psychiatry, 18(11), 994–1001. 10.1002/gps.1001 [DOI] [PubMed] [Google Scholar]
- Sharma, B. , Khanal, V. K. , Jha, N. , Pyakurel, P. , & Gurung, G. N. (2019). Study of the magnitude of diabetes and its associated risk factors among the tuberculosis patients of Morang, Eastern Nepal. BMC Public Health, 19(1), 1545. 10.1186/s12889-019-7891-x [DOI] [PMC free article] [PubMed] [Google Scholar]
- Sinclair, S. J. , Siefert, C. J. , Slavin‐Mulford, J. M. , Stein, M. B. , Renna, M. , & Blais, M. A. (2012). Psychometric evaluation and normative data for the Depression, Anxiety, and Stress Scales‐21 (DASS‐21) in a nonclinical sample of U.S. Adults. Evaluation & the Health Professions, 35(3), 259–279. 10.1177/0163278711424282 [DOI] [PubMed] [Google Scholar]
- Singh, B. , Prabhuappa, K. P. , Eqbal, S. , & Singh, A. R. (2013). Depression, anxiety and stress scale: Reliability and validity of Hindi adaptation. International Journal of Education and Management Studies, 3(4), 446–449. [Google Scholar]
- Szabó, M. (2010). The short version of the Depression Anxiety Stress Scales (DASS‐21): Factor structure in a young adolescent sample. Journal of Adolescence, 33(1), 1–8. 10.1016/j.adolescence.2009.05.014 [DOI] [PubMed] [Google Scholar]
- Thapa, D. K. , Visentin, D. , Kornhaber, R. , & Cleary, M. (2018). Prevalence of mental disorders among older people in Nepal: A systematic review. Kathmandu University Medical Journal, 16(62), 181–190. [PubMed] [Google Scholar]
- Thapa, D. K. , Visentin, D. C. , Kornhaber, R. , & Cleary, M. (2020a). Prevalence and factors associated with depression, anxiety and stress symptoms among older adults: A cross‐sectional population‐based study. Nursing & Health Sciences, 22(4), 1139–1152. 10.1111/nhs.12783 [DOI] [PubMed] [Google Scholar]
- Thapa, D. K. , Visentin, D. C. , Kornhaber, R. , & Cleary, M. (2020b). Migration of adult children and quality of life of older parents left‐behind in Nepal. Geriatrics & Gerontology International, 20(11), 1061–1066. 10.1111/ggi.14047 [DOI] [PubMed] [Google Scholar]
- Tonsing, K. N. (2014). Psychometric properties and validation of Nepali version of the Depression Anxiety Stress Scales (DASS‐21). Asian Journal of Psychiatry, 8, 63–66. 10.1016/j.ajp.2013.11.001 [DOI] [PubMed] [Google Scholar]
- Tran, T. D. , Tran, T. , & Fisher, J. (2013). Validation of the depression anxiety stress scales (DASS) 21 as a screening instrument for depression and anxiety in a rural community‐based cohort of northern Vietnamese women. BMC Psychiatry, 13(1), 24. 10.1186/1471-244X-13-24 [DOI] [PMC free article] [PubMed] [Google Scholar]
- Tucker, L. R. , & Lewis, C. (1973). A reliability coefficient for maximum likelihood factor analysis. Psychometrika, 38(1), 1–10. 10.1007/BF02291170 [DOI] [Google Scholar]
- Tully, P. J. , Zajac, I. T. , & Venning, A. J. (2009). The structure of anxiety and depression in a normative sample of younger and older Australian adolescents. Journal of Abnormal Child Psychology, 37(5), 717. 10.1007/s10802-009-9306-4 [DOI] [PubMed] [Google Scholar]
- Van Nguyen, H. , Laohasiriwong, W. , Saengsuwan, J. , Thinkhamrop, B. , & Wright, P. (2015). The relationships between the use of self‐regulated learning strategies and depression among medical students: An accelerated prospective cohort study. Psychology, Health & Medicine, 20(1), 59–70. 10.1080/13548506.2014.894640 [DOI] [PubMed] [Google Scholar]
- Vignola, R. C. B. , & Tucci, A. M. (2014). Adaptation and validation of the depression, anxiety and stress scale (DASS) to Brazilian Portuguese. Journal of Affective Disorders, 155, 104–109. 10.1016/j.jad.2013.10.031 [DOI] [PubMed] [Google Scholar]
- Wang, K. , Shi, H.‐S. , Geng, F.‐L. , Zou, L.‐Q. , Tan, S.‐P. , Wang, Y. I. , Neumann, D. L. , Shum, D. H. K. , & Chan, R. C. K. (2016). Cross‐cultural validation of the Depression Anxiety Stress Scale–21 in China. Psychological Assessment, 28(5), e88–e100. 10.1037/pas0000207 [DOI] [PubMed] [Google Scholar]
- WHOQOL Group (1998). Development of the World Health Organization WHOQOL‐BREF quality of life assessment. Psychological Medicine, 28(3), 551–558. [DOI] [PubMed] [Google Scholar]
- Wood, B. M. , Nicholas, M. K. , Blyth, F. , Asghari, A. , & Gibson, S. (2010). The utility of the short version of the Depression Anxiety Stress Scales (DASS‐21) in elderly patients with persistent pain: Does age make a difference? Pain Medicine, 11(12), 1780–1790. 10.1111/j.1526-4637.2010.01005.x [DOI] [PubMed] [Google Scholar]
- Yusoff, M. S. B. (2013). Psychometric properties of the depression anxiety stress scale in a sample of medical degree applicants. International Medical Journal, 20(3), 295–300. [Google Scholar]
Associated Data
This section collects any data citations, data availability statements, or supplementary materials included in this article.
Supplementary Materials
Appendix S1
Appendix S2
Data Availability Statement
Data used for this research would be made available on reasonable request by the corresponding author.