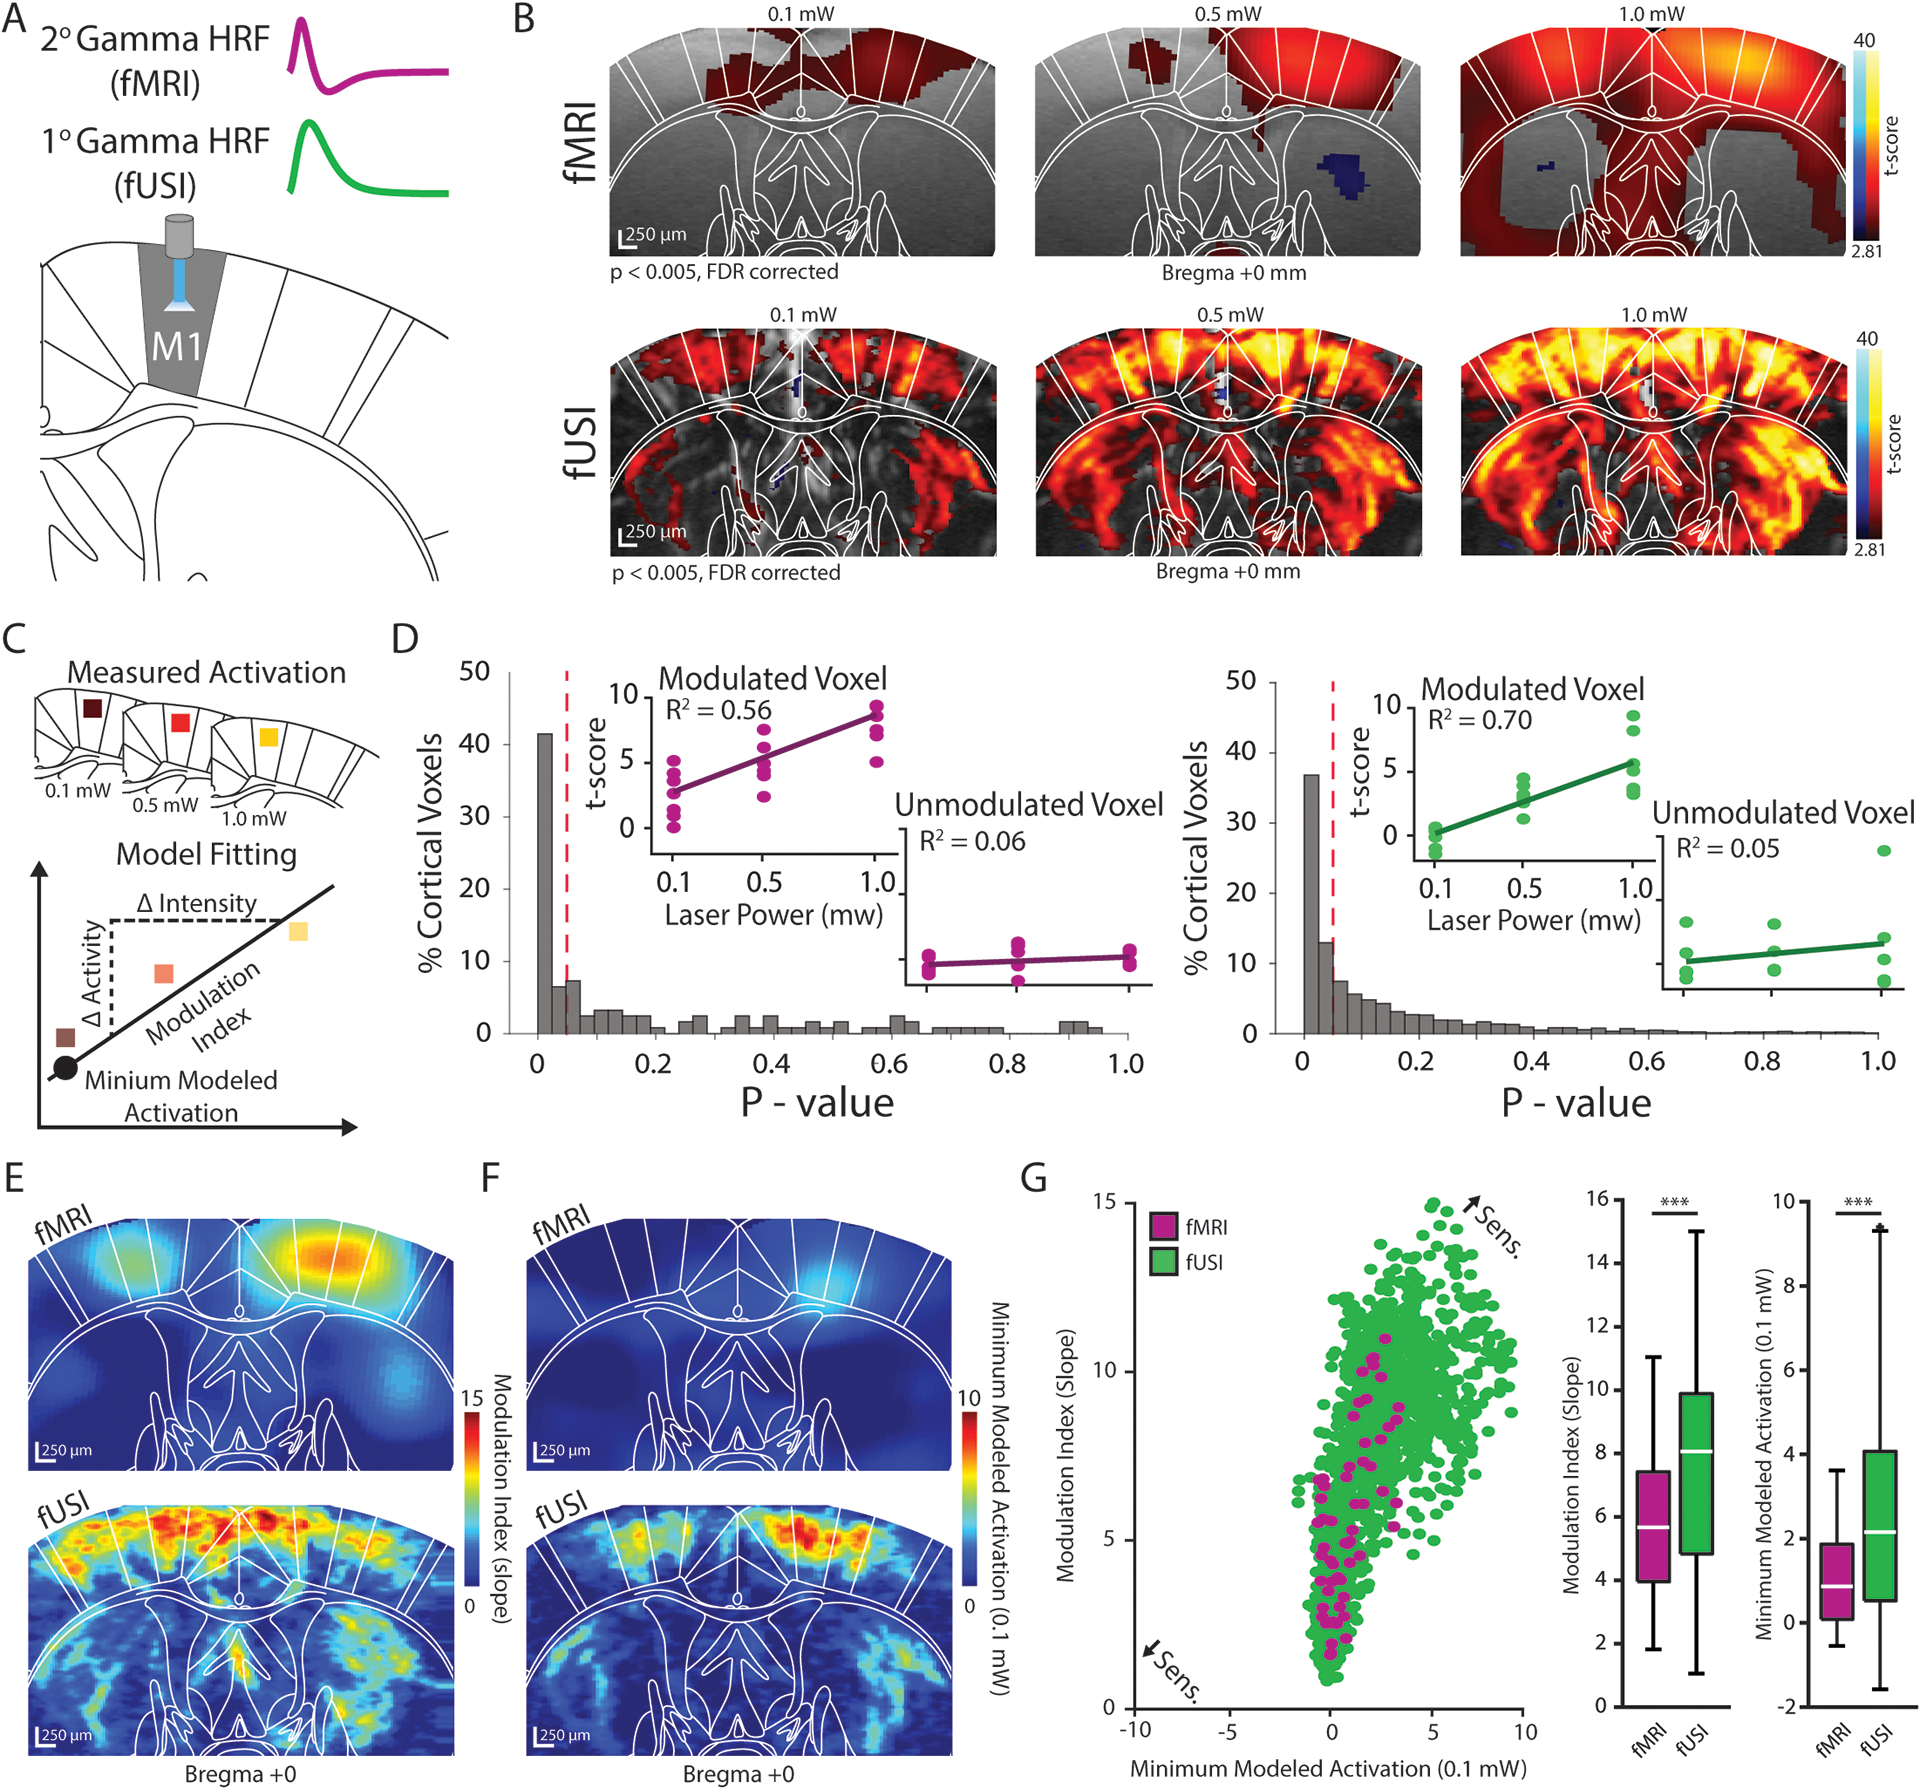
Figure 2. Functional ultrasound imaging detects optogenetically-evoked neural activity with high sensitivity.

(A) The evoked fMRI and fUSI responses clearly depict 2nd and 1st order gamma functions, respectively, and were used to model the activation dynamics voxel-wise throughout the field-of-view. (B) Group-level fMRI (top) and fUSI (bottom) activation maps for 0.1 mW (left), 0.5 mW (middle), 1.0 mW (right) stimulation were generated using a general linear model (n = 7 animals; p < 0.005, FDR corrected). Warm and cool colors indicate positive and negative t-scores, respectively. (C) Linear regression models were fit to the activation maps in (B) to determine a modulation index (slope) and minimum modeled activation (power: 0.1 mW, irradiance: 0.8 mW/mm2) value for each voxel. (D) Normalized histograms of model p-values of all cortical voxels indicate that 48% and 50% of cortical voxels were linearly modulated by stimulation intensity for fMRI (left) and fUSI (right), respectively. Inlays show t-scores and models for example voxels that were significantly modulated and unmodulated. The red dotted line indicates the significance threshold of p = 0.05. (E–F) Voxel-wise fMRI (top) and fUSI (bottom) modulation index (slope) (E) and minimum modeled activation (F) maps. (G) Sensitivity was evaluated for fMRI (purple) and fUSI (green) by plotting the minimum modeled activation values (x-axis) against the modulation index values (y-axis) for linearly modulated voxels. Boxplots plots indicate that the voxel-wise modulation index and minimum modeled activation values were significantly larger for fUSI than for fMRI (n = 7 animals, *** p < 0.001, Wilcoxon rank-sum test). Boxplots show the median (center line), 25th and 75th percentiles (boxes) and the 1st and 99th percentile (whiskers).
