

ABSTRACT
RNA translation is the rate-limiting step when cells synthesize proteins. Elevating translation efficiency (TE) is intuitively beneficial. Particularly, when viruses invade host cells, how to compete with endogenous RNAs for efficient translation is a major issue to be resolved. We collected millions of worldwide SARS-CoV-2 sequences during the past year and traced the dynamics of allele frequency of every mutation. We defined adaptive and deleterious mutations according to the rise and fall of their frequencies along time. For 5ʹUTR and synonymous mutations in SARS-CoV-2, the selection on TE is evident near start codons. Adaptive mutations generally decrease GC content while deleterious mutations increase GC content. This trend fades away with increasing distance to start codons. Mutations decreasing GC content near start codons would unravel the complex RNA structure and facilitate translation initiation, which are beneficial to SARS-CoV-2, and vice versa. During this evolutionary arms race between human and virus, SARS-CoV-2 tries to improve its cis elements to compete with host RNAs for rapid translation.
KEYWORDS: SARS-CoV-2, mutation, allele frequency, translation, RNA structure
Introduction
The central dogma of biology [1] dictates that DNA is first transcribed to RNAs and then translated into proteins. Among these multiple steps of gene expression, RNA translation is definitely the rate-limiting step that largely determines the final protein abundance. Particularly, translation initiation, where the ribosome subunits scan the 5ʹUTR (untranslated region) of mRNA to find start codon ATG [2], is the rate-limiting step during translation (Figure 1(a)). When ribosomes find the proper ATG, they will move along the CDS (coding sequence) to synthesize the peptide chain with the aid of tRNAs, a process termed translation elongation (Figure 1(a)). Although the elongation rate differs from gene to gene due to synonymous codon usage bias [3–5], it only serves as a means to fine-tune the gene expression [6] (however, the impact of codon bias on translation is detectable. Please refer to the following paragraphs). In contrast, translation initiation rate directly determines how many ribosomes can be loaded onto a single RNA per time unit, which is a proximity of the number of protein molecules produced from an RNA (Figure 1(b)). Therefore, the term ‘translation initiation efficiency’ is usually abbreviated as ‘translation efficiency’ (TE) in some literatures [7,8] because the contribution of other processes is almost ignorable.
Figure 1.

Introduction of mRNA translation. (a) The process of translation initiation and elongation. (b) Translation initiation rate eventually determines the number of protein molecules produced per mRNA, and therefore is the rate-limiting step in translation. (c) Complex RNA structure near start codon would reduce translation (initiation) efficiency. (d) Allele frequencies (AFs) of different mutation sites are compared in many literatures. This comparison is horizontal. In contrast, the vertical comparison of AF of a mutation along time is still lacking. Each bar represents the AF of each mutation. Different mutations have different colours.
5ʹUTR contains multiple elements that regulate mRNA translation initiation [9]. Kozak sequences [10,11] and upstream ORFs [12], although with strong effects on TE, only make up a small fraction of the total length of 5ʹUTR. In contrast, the RNA structures in 5ʹUTR or near start codon almost cover every nearby nucleotide [13]. Since ribosomes need to slide along 5ʹUTR before encountering start codons, the highly complex RNA structures in 5ʹUTR or near start codon would slow down the ribosome and thus decrease TE (Figure 1(c)) [14]. RNA structure is further determined mainly (or partially) by the GC content of local region (say, 5ʹUTR or near start codon) (for the proof of this statement, please refer to the first paragraph of Results section); this suggests that virtually every nucleotide alteration (mutation) within the nearby region would potentially change the RNA structure and affect TE.
It is supported by many literatures that complex RNA structure near start codon would dampen translation initiation efficiency [13,15]. The mechanism is straightforward: strong hairpin structure would make mRNA inaccessible (or less accessible) to ribosomes [15] and initiation factors [13], preventing efficient translation. Besides, high translation initiation rate is favoured by natural selection, especially for parasites like viruses [2]. Therefore, in SARS-CoV-2, the mutation that decreases the GC content near start codon would unravel the complex RNA structure to allow efficient translation so that it should be favoured by natural selection. The mutation that increases the GC content near start codon should be selected against.
However, GC content also affects the synonymous codon usage bias in CDS. Synonymous codons are not equally used by organisms. Theory of codon usage bias (or termed synonymous codon usage bias) has found that the GC-ending codons have higher tRNA availability and higher translation elongation rates than the AT-ending codons [8,16,17]. This pattern is prevalent in eukaryotes. Therefore, a synonymous mutation which changes a GC-ending codon to an AT-ending codon would slightly increase the codon optimality for rapid translation so that this type of mutation is favoured by natural selection [3,18]. It is imaginable that the finally observed sequence data come from the long-term conflicts among natural selection forces on different cis features.
Evolutionary theories propose that adaptive mutations would gradually elevate their allele frequencies (AFs) in population and deleterious mutations generally exhibit the opposite trend [19,20]. While natural selection is an ongoing process, the genome sequences of extant organisms only represent a snapshot at present time. The information in the past is largely missing [21]. Researchers usually ‘horizontally’ compare the AF of different mutations to infer their relative adaptiveness [18], but are rarely able to ‘vertically’ trace the AF trajectory of particular mutations along time (Figure 1(d)). This limitation largely hampers our understanding on the adaptiveness of mutations.
This situation changed with the outbreak of COVID-19 in 2019. Millions of worldwide SARS-CoV-2 strains have been sequenced in the past 2 years. SARS-CoV-2 is evolving fast and sequenced timely [22,23]. One can simply record the AF of each mutation every month to see whether it goes up or down as time goes by. Given the strong selection on SARS-CoV-2, a viral sequence carrying the advantageous mutations would rapidly spread throughout the local or global regions, and this change is evident enough to be reflected by the AF dynamics of mutations. Therefore, this ‘time course’ data set of SARS-CoV-2 provides us an unprecedented opportunity to accurately analyse the adaptiveness of each mutation event and infer their functional relevance in vivo.
We would test our hypothesis on the strong natural selection on RNA structure near start codon. For RNA viruses like SARS-CoV-2, the viral RNAs need to utilize hosts’ ribosomes and tRNAs to translate and propagate themselves. Competing with the host mRNAs for resources should be the major task for SARS-CoV-2 since the endogenous RNAs have already adapted to the cellular environment. We surmise that the selective constraint on TE should be particularly strong in SARS-CoV-2.
Using the millions of SARS-CoV-2 sequences available, we traced the rise and fall of all mutations in the past year. We defined adaptive and deleterious mutations according to the AF dynamics. We found that the mutations that decrease the GC content near start codons are generally adaptive while mutations of the opposite direction (increasing GC content) are mainly deleterious around start codons. We propose that the expressional regulation of genes should not be ignored when studying virus evolution. Despite that some popular mutations sites, like D614G [24,25] and N501Y [26,27], are thought to be highly dangerous due to the property of altered protein isoforms, we propose that the expressivity (or translatability) of genes is the more basic prerequisite for exerting the proper functions of genes.
Materials and Methods
Data collection
We downloaded the SARS-CoV-2 genome from the NCBI website (https://www.ncbi.nlm.nih.gov/genome/). The RaTG13 sequence was retrieved from previous literature [28]. The millions of worldwide SARS-CoV-2 sequences were downloaded from GISAID [23]. To the last time point (TP) of our data collection (15 February 2022), 6.72-million SARS-CoV-2 sequences were available.
RNA structure analysis
MFE (minimum free energy) is an in silico estimation of RNA secondary structure calculated by RNAfold [29]. MFE is always a negative value. Lower MFE represents stronger RNA structure. icSHAPE score is an in vivo measurement of RNA structure [30]. icSHAPE score ranges from 0 to 1. Lower icSHAPE score represents stronger RNA structure. The 30 Kb SARS-CoV-2 genome is divided by sliding windows (step = 100 bp, window size = 500 bp) and calculated for MFE and icSHAPE score.
Mutation calling and annotation
Each downloaded SARS-CoV-2 sequence was aligned to reference genome using CLUSTALW [31]. For each target sequence, there would be mismatches between the sequence and the reference genome. The mismatch sites are recorded by position (genomic coordinate) and mutation type (from what nucleotide to what nucleotide, e.g. from C to G). The information of each mutation site is provided as Supplementary Table 1. From the reference genome sequences and the annotated regions of genes and ORFs, we would know whether a site (given by genomic coordinates) is located in 5ʹUTR or CDS. If in CDS, then the frame of a site is also known, which is, the codon position of this site. According to the 64-codon table, if a mutation alters amino acids, then it is defined as a missense mutation. If a mutation in CDS does not alter amino acids, then it is defined as a synonymous mutation.
Allele frequency
For each mutation site, the AF is calculated as the number of sequences carrying this mutation divided by the total number of sequence available at that TP. Mutation refers to the alternative nucleotide in a strain compared to the reference sequence of SARS-CoV-2 (accession ID: NC_045512).
Mutation that alters the GC content
Among the 12 types of mutations (the 4 × 3 permutations of A, C, G, T), 4 mutations increase GC content (A/T > C/G), 4 mutations decrease GC content (C/G > A/T) and the remaining 4 mutations do not change GC content (C/G > G/C, A/T > T/A).
Standing variation and novel mutations
We have 16 evenly distributed TPs during this 8-month time. The data were collected every 15 days. We defined standing variations as the mutation sites with AF > 0 at TP1. We defined novel mutations as the mutation sites with AF1 = 0 and AF2 = 0 (AF1 and AF2 refer to the values of AF at TPs 1 and 2, respectively). Note that our definition is completely based on the 8-month time that we investigated. For example, the standing variations defined by us may be a novel mutation if one looks at earlier time. The novel mutations defined by us may be a standing variation if one looks at later time. Therefore, we only focus on the period of interest.
Adaptive and deleterious mutation
Spearman correlation coefficient Rho was calculated between AF against TP.
Rho = , where xi is the rank of a number in vector X, and yi is the rank of a number in vector Y. and are the mean values of X and Y. The Rho value between two vectors X and Y (of equal length) could be easily obtained in R language by command line cor.test(X, Y, method = ‘spearman’), where cor.test is a function in R.
For standing variations, we defined adaptive mutations as Rho(AF1:AF16 ~ 1:16) > 0.95, and deleterious mutations as Rho(AF1:AF16 ~ 1:16) < −0.95. For novel mutations, adaptive was defined as Rho(AF3:AF16 ~ 3:16) > 0.95, and deleterious was defined as Rho(AF3:AF16 ~ 3:16) < −0.95. These criteria are arbitrary and stringent, and should be ‘sufficient but not necessary’ that might miss many other potentially adaptive or deleterious mutations. Nevertheless, we only aim to see whether we could observe our expected enrichment (see Results for details) instead of finding out all the adaptive or deleterious mutations from the sea of total mutations.
Results
GC content and RNA structure are highly connected
To show the association between GC content and RNA structure, we display the GC content, MFE (minimum free energy) and icSHAPE score along the 30Kb SARS-CoV-2 genome by sliding window (step = 100 bp, window size = 500 bp) (Figure 2, also see Methods). We observed that MFE is significantly negatively correlated with GC content (Figure 2(b)), suggesting that higher local GC content leads to stronger local RNA structure (in silico). We also observed a significant negative correlation between GC content and icSHAPE score (Figure 2(c)), suggesting that higher local GC content is connected to stronger RNA structure (in vivo).
Figure 2.

The relationship between GC content, minimum free energy (MFE, in silico) and RNA structure (icSHAPE score, in vivo). (a) The GC content, MFE and icSHAPE score across the 30K SARS-CoV-2 genome. 500 bp sliding window with step size = 100 bp are used. The locations of the 11 SARS-CoV-2 genes and the annotations of 5ʹUTR and CDS are shown. Lower MFE or lower icSHAPE score represent stronger RNA structure. (b) Spearman correlation between MFE and GC content, and between icSHAPE score and GC content.
Definition of standing variation and novel mutation
We collected millions of SARS-CoV-2 sequences in the past year and calculated the AFs of mutations at totally 16 TPs during a 8-month time, termed TP1 to TP16 (Figure 3(a), also see Methods).
Figure 3.

Characteristics of standing variations and novel mutations. (a) The 16 time points (TPs) are equally distributed during an 8-month period. The AF of mutations is calculated at each TP. (b) Definition of standing variation and novel mutation. We require a novel mutation to have AF = 0 at both TP1 and TP2, and a standing variation to have AF > 0 at TP1. (c) The mean AF of all mutations within each gene. Standing variations obviously have higher AF than novel mutations. (d) Novel mutations have higher fraction of missense mutations than standing variations. ***p-value < 0.001 by Chi-square test.
Our thoughts on adaptive and deleterious mutations are straightforward. The AF going up along time represents adaptive mutations while the AF going down represents deleterious mutations. However, before looking into the trajectory of AF, we first need to clarify whether a mutation existed before our first collection at TP1 (standing variation) or it arose during our collection (novel mutation). This classification is necessary because these two types of mutations may undergo different selection patterns.
We defined standing variations as the mutations existing at TP1 and novel mutations as the mutations absent at TP1 and TP2 (Figure 3(b)). Under these criteria, 71,153 standing variations and 17,833 novel mutations were found. Not surprisingly, standing variation obviously have higher AF than novel mutations (Figure 3(c)). More importantly, standing variations have generally lower fraction of missense sites compared to novel mutations (Figure 3(d)) due to the fact that missense mutations are largely deleterious so that the distribution of standing variation is already the relic purged by earlier nature selection. This difference supports our notion that these two types of mutations are subjected to distinct selection pressure. Notably, although the mutation dynamics of different SARS-CoV-2 genes are variable (Figure 3(c)), we know that this variability is mainly contributed by the large numbers of missense mutations (Figure 3(d)), which are not the core part in our following analysis.
Standing variations that unravel RNA structures are generally elevating AF along time
We aim to test our hypothesis that the selection on RNA TE is strong so that the complex RNA structures near start codon are not favourable. We first determined whether a given mutation decrease or increase the GC content, which is, A/T > C/G mutations increase GC content and C/G > A/T mutations are the opposite, while the remaining mutations do not change GC content. Remarkably, in the SARS-CoV-2 data, only a small part of standing variations (19,950/71,153 = 28.0%) does not change the GC content, while for novel mutations, this proportion is 54.0% (9631/17,833) (Figure 4(a)).
Figure 4.

Mutations that decrease or increase the GC content. (a) The percentages of mutations that increase, decrease, or do not change the GC content. (b) For the standing variations in 5ʹUTRs, the ones that decrease GC content (orange) are increasing their AF along time. (c) For synonymous mutations among the standing variations, only the ones located in the 5-prime of CDS have the same pattern as 5ʹUTR mutations (where decreasing GC is favourable and increasing GC is unfavourable). Because synonymous mutations in the gene body are also affected by codon usage bias, only the most 5-prime part could be used to analyse RNA structure.
Next, we focused on standing variation to see the dynamics of AF in worldwide SARS-CoV-2 population. For the 5ʹUTR mutations, it is evident that the mutations decrease GC content have been rising their AF along time, while those mutations increase GC content gradually went down (Figure 4(b)). This suggests that unravelling the RNA structure in 5ʹUTR constantly provides a selective advantage so that the mutations decrease GC content are continuously positively selected. This trend could also be reflected by the fact that those ‘GC-down’ mutations have considerably higher AF than those ‘GC-up’ mutations regardless of their dynamics (Figure 4(b)).
Notably, 5ʹUTR could also pair with CDS to form RNA structure near start codons, which would also impair efficient translation. In theory, any mutations that unravel RNA structure would be favourable, and therefore the preference on ‘GC-down’ mutations should exist in CDS as well. However, analysis on CDS mutations is complicated by the nature of missense mutations whose major selection pressure comes from the amino acid sequence. Even one only focuses on synonymous mutations, the selection on optimal codon usage would counteract with low GC content [18]. As a consequence, only the synonymous mutations at the 5-prime end of CDS are free from codon selection, a well-established phenomenon called codon ramp at the beginning of CDS [32]. To be prudent, we divided CDS into 10 equal bins and analyse synonymous mutations in each bin separately. We found that only the 5-prime most bin of CDS (the beginning of CDS) behaves like 5ʹUTR, which is, the ‘GC-down’ mutations are constantly rise their AF and the ‘GC-up’ mutations go down (Figure 4(c)). For the other bins in the middle or 3-prime end of CDS, the synonymous mutations are largely affected by selection on codon usage, where the ‘GC-up’ mutations (increase codon optimality) are selected for (Figure 4(c)). Accordingly, we also looked at missense mutations in CDS, and no constant patterns were observed regarding the GC content as the main selection force acting on missense sites is the amino acid sequence.
In this part, by analysing standing variations, we conclude that the positive selection for an unravelled RNA structure near start codon mainly exists in 5ʹUTR and the 5-prime part of CDS (for synonymous sites only), and this selection pressure would force the local region to decrease GC content.
Novel mutations that unravel RNA structures rapidly increase AF
We questioned whether novel mutations exhibit the same preference on ‘GC-down’ mutations near start codon. The AF dynamics of novel mutations should be investigated after the appearance of mutation at TP3. For 5ʹUTR mutations, the ‘GC-down’ mutations went up and the ‘GC-up’ mutations went down (Figure 5(a)). This highly agrees with our prediction that the mutations that unravel the RNA structure near start codon would be favoured.
Figure 5.

Novel mutations also prefer less RNA structure near start codon. All mutations are classified into GC-down, GC-up, and GC-unchanged. (a) Dynamics of novel mutations in 5ʹUTR. (b) Synonymous mutations in the first 1/10 of CDS. (c) Synonymous mutations in the last 1/10 of CDS. (d) Dynamics of novel missense mutations.
For novel synonymous mutations, both RNA structure and codon bias are the selection forces shaping the AF. We suppose that the synonymous mutations on the most 5-prime part are most affected by RNA structure and those on the most 3-prime part are least affected by RNA structure (and thus most affected by codon bias). Expectedly, synonymous mutations located in the first bin of CDS behaved just like 5ʹUTR mutations (where ‘GC-down’ mutations are favourable and ‘GC-up’ mutations are unpreferred) (Figure 5(b)); synonymous mutations located in the last bin of CDS showed the typical selection pattern on codon optimality (where higher GC content is preferred) (Figure 5(c)). This observation not only demonstrates the complicated selection force acting on synonymous sites but also reflects a general rule in evolution that the observed sequence of any extant species is the final result after multiple rounds of genomic conflicts.
For novel missense mutations, we also divided them into three group according to the impact on GC content. However, the AF of all three categories went down shortly after their emergence (Figure 5(d)). This result again recalls the classic evolutionary theory that most novel missense mutations are deleterious and are rapidly eliminated by purifying selection [20]. Indeed, our observation supports this classic notion. The major selection force acting on missense mutations is the essentiality of amino acid sequences, and the alteration of GC content has such a minor effect on the fate of missense mutations.
So far, we have obtained the following results and conclusions. (1) Mutations that decrease the GC content near start codon would unravel the RNA structure and facilitate translation initiation, and therefore are positively selected. (2) 5ʹUTR mutations and the synonymous mutations at the 5-prime end of CDS show the expected patterns while the synonymous mutations at the end of CDS do not. (3) Both standing variation and novel mutations obey this rule. (4) The fate of missense mutations is mainly controlled by the effect of amino acids.
The expected pattern refers to the positive selection on those mutations that decrease GC content around start codons, which would potentially increase translation initiation efficiency. However, the sequence at the end of CDS hardly affects the structure near start codons, so that decreasing GC content at the end of CDS adds no good to translation initiation (and does not benefit the virus). Therefore, mutations decreasing GC content are not favoured at the end of CDS. Instead, selection on codon bias (translation elongation) would favour those mutations that increase GC content. As a consequence, if the mutations at the end of CDS do benefit the virus, then those mutations naturally should increase GC content. The point is, the mutational pattern near start codon is shaped by natural selection on translation initiation, while the mutations far from start codon (e.g. at the end of CDS) are shaped by natural selection on codon bias (translation elongation).
Artificial classification of adaptive and deleterious mutations supports our assumption
We have already observed the preference on those mutations that unravel RNA structures near start codon (GC-down mutations). Next, we wonder whether we could arbitrarily define a set of adaptive or deleterious mutations, and see if the ‘GC-down’ mutations are enriched in adaptive ones.
To do so, we calculated the Spearman correlation coefficient (Rho) between the AF of a mutation and the order of TPs. We only focused on the AF data after the first appearance of a mutations. For example, for standing variations, the Rho between 16 AFs (AF1–AF16) and 16 TPs (TP1–TP16) was calculated, while for novel mutations appearing at TP3, only AF3–AF16 were calculated (Figure 6(a)). The distributions of Rho values are slightly different between standing variations and novel mutations, but both of which have a peak around zero (Figure 6(b)), suggesting the prevalence of nearly neutral mutations. We defined that mutations with Rho > 0.95 were adaptive mutations and those with Rho < −0.95 were deleterious mutations (Figure 6(b)). We lowered the threshold for novel mutations by regarding Rho > 0.5 as adaptive and Rho < −0.5 as deleterious, so that the same analysis was also performed for novel mutations.
Figure 6.

Defining adaptive and deleterious mutations and their selection patterns regarding GC content. (a) Diagram showing the scheme of calculating Spearman correlation coefficient (Rho) of each mutation site based on AF at different time points. Standing variations and novel mutations were calculated separately. (b) The density distribution of Rho and the definition of adaptive and deleterious mutations. (c and d) The numbers and percentages of each category of mutations. The percentages are calculated within each colour in the same plot, the purpose of which is to show that GC-down mutations near start codons are adaptive (due to selection on translation initiation) while GC-up mutations are favoured at the end of CDS (possibly due to selection on codon usage bias). *p-value < 0.05; **p-value < 0.01; ***p-value < 0.001 by Chi-square tests.
Note that our definition of adaptive or deleterious mutations should be ‘sufficient but not necessary’ since we have used the most stringent criterion that might miss many other potentially adaptive or deleterious mutations. Here, we only aim to see whether we could observe our expected enrichment instead of finding out all the adaptive or deleterious mutations from the sea of total mutations. In total, 3057/17,833 (17.1%) novel mutations were adaptive and 3719/17,833 (20.9%) novel mutations were deleterious, while 3911/71,153 (5.5%) standing variations were adaptive and 12,067/71,153 (17.0%) standing variations were deleterious. As claimed, these numbers did not accurately reflect the nature of each mutation type since the criteria were stringent. Moreover, the numbers of adaptive and deleterious novel mutations were too few to be further classified into different categories, so we only focused on standing variations in this part.
For standing variations in 5ʹUTR (Figure 6(c)), we found 28, 9 and 18 adaptive mutations that cause GC-down, unchanged and GC-up, respectively. The percentage of each class is 51%, 16% and 33%. In contrast, we found 84, 101 and 125 deleterious mutations that cause GC-down, unchanged and GC-up. The percentage of each class is 27%, 33% and 40% (Figure 6(c)). To show that the GC-down mutations are enriched in adaptive mutations (or adaptive mutations are enriched in GC-down mutations), we performed a Chi-square test between the two sets of mutations and obtained p-value = 0.0012 (Figure 6(c)). The same methodology was applied to standing variations in the first or last bin of CDSs (Figure 6(c)), and to novel mutations in 5ʹUTR or the first or last bin of CDS (Figure 6d).
The point is, those mutations near start codons are subjected to selection on RNA structure so that GC-down mutations are favourable, while in the regions that do not affect RNA structure near start codon (like the last bin of CDS), GC-down mutations are no longer beneficial, instead, the selection on codon optimality favours the GC-up mutations. Therefore, for the mutations in 5ʹUTR or the first bin of CDS, we highlight the GC-down mutations and compare their percentages in adaptive versus deleterious mutations, respectively (Figure 6(c–d), upper and middle panels). For the mutations in the last bin of CDS, we highlight the GC-up mutations and compare their percentages in adaptive versus deleterious mutations, respectively (Figure 6(c–d), lower panel).
Adaptive mutations near start codons indeed unravel RNA structure
We have clarified the relationship between GC content, MFE, and icSHAPE score (Figure 2). To further prove that the mutations we found have impacted the local RNA structure, we selected a set of adaptive mutations near start codons (e.g. in 5ʹUTR and the first bin of CDS), and verify that these mutations indeed loosen the RNA structure. Since the post-mutation version of the virus sequence does not have in vivo measurement data, we chose to perform in silico estimation of the MFE of the virus sequences before and after mutations. We extracted the 5ʹUTR plus the first bin of CDS and concatenated them into one sequence (Figure 7(a)). Then we replaced the sequence with one mutation each time. A full replacement sequence is used as positive control (Figure 7(a)). We compared the MFE of the original sequence and mutation sequence. The MFE of the mutation sequence is significantly higher than the original MFE (Figure 7(b)), suggesting that the mutations indeed unravel the RNA structure new start codon.
Figure 7.
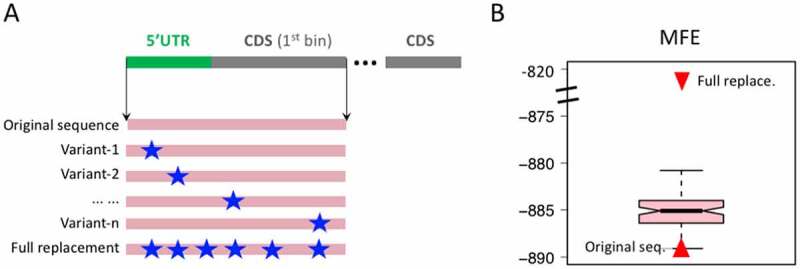
MFE before and after mutations. (a) 5ʹUTR and the first bin of CDS are concatenated. The MFE of each variant sequence is calculated. The adaptive and GC-down mutations are used. A full replacement sequence is also created. (b) Distribution of the MFE of the variant sequences. The MFE values of original sequence and full replacement sequence are highlighted as red triangles.
Excluding the confounding factor: baseline GC content along SARS-CoV-2 genome
We have already showed the GC content along the 30 kb SARS-CoV-2 genome (Figure 2). Here, another confounding factor is, if the baseline GC content of a region is very high, then a random mutation in this region is more likely to decrease the GC content, and vice versa. Consider an extreme situation of a ‘full GC’ region, then any purine-pyrimidine transversions would definitely decrease the GC content of this region. Therefore, it is necessary to show that the 5ʹUTR and 10 divisions of CDS do not show much difference in baseline GC content. Otherwise, the favourable GC-down mutations near start codons might be caused by the intrinsically higher GC content in 5ʹUTR of the firstt bin of CDS. Interestingly, when we plotted the baseline GC content in 5ʹUTR and divisions of CDS for each gene, we did not see a decrease or increase in baseline GC content along the genomic locations (Figure 8). This result suggests that the baseline GC content does not account for our observed pattern that GC-down mutations are generally favourable near start codons.
Figure 8.

GC content of 5ʹUTR and each division of CDS. CDS bins are divided with equal length within each gene. Each gene has a unique colour in the plot. For each bin, a box-whisker is drawn to show the distribution of 11 genes.
Discussion
While most SARS-CoV-2 studies are interested in the ‘qualitative’ changes in the amino acid sequences (missense mutations) like the well-known D614G [24,25] and N501Y [26,27], we claim that the ‘quantitative’ changes caused by 5ʹUTR and synonymous mutations are also essential. The strong selection on these silent mutations indicates that the regulation of gene expression is also the driving force of SARS-CoV-2 evolution. RNA viruses like SARS-CoV-2 must find a way to compete with host mRNAs for efficient translation. The cis features of host genes (mRNAs) have already adapted to the trans environment of host cells and therefore they should intrinsically have high TEs. For SARS-CoV-2, its codon usage does not perfectly match the host’s tRNA pool, so that the virus could only enhance the TE at the initiation step. Optimizing the RNA structure near start codon is a smart strategy to promote viral gene expression, and adjusting the GC content is the most feasible way. Understanding the molecular basis behind the gene expressional changes might help us find the key to fight against SARS-CoV-2 and control the pandemic. It also hints that during the evolutionary arms race between human and SARS-CoV-2, the virus is trying to keep up with the host cell system by elevating the TE to compete with endogenous RNAs.
The ‘time course’ data of worldwide SARS-CoV-2 strains are the most valuable clues to deduce the adaptiveness, deleteriousness, or neutrality of each single mutation site. The dynamic change of AF is the unprecedented resource. As introduced, traditional evolutionary analysis is a snapshot of AF at a time (Figure 1(d)). It is only able to ‘horizontally’ compare the AF distributions of different sets of mutations (and performs statistical tests), and concludes that a particular set of mutations is relatively more favourable than another set. However, given a single mutation site with a single AF value, one could not judge the fitness of this mutation. The analysis on the selection force on single mutation site is only feasible when the ‘time course’ dynamic data is available (Figure 1(d)). We fully took advantage of the worldwide SARS-CoV-2 data in the past year and developed our own methods to judge the fitness of each mutation site.
A question remaining is the relative selection strength on translation initiation: how strong is this selection force? As discussed, both qualitative changes (missense mutations) and quantitative changes (silent mutations as regulatory elements) are influential. However, we have observed a global pattern that the AF of novel missense mutations went down regardless of the GC content (Figure 4(d)), suggesting that the main pressure acting on novel missense sites is still the property of amino acid.
We should state that our analysis did not distinguish the source of the mutation. Mutations in SARS-CoV-2 come from either replication errors or RNA modifications [33–40]. However, the selection force acting on the mutations is irrelevant to their origins. Our analysis and conclusion should be robust. During this evolutionary arms race between human and virus, SARS-CoV-2 tries to improve its cis elements to compete with host RNAs for rapid translation.
Supplementary Material
Acknowledgments
We thank the members in our group that have given suggestions to our project. At this SARS-CoV-2 time, we should especially thank all the medical workers fighting against SARS-CoV-2.
Funding Statement
This study was supported by the National Natural Science Foundation of China (NSFC) [No. 81970660].
Supplemental data
Supplemental data for this article can be accessed online at https://doi.org/10.1080/15476286.2022.2092351
Disclosure statement
No potential conflict of interest was reported by the author(s).
Author contributions
LZ, QW, WZ and HH analyzed the data and drafted this manuscript. KX supervised this work and revised the manuscript. All authors approved the final submission of this manuscript.
Availability of data and materials
We downloaded the SARS-CoV-2 genome from the NCBI website (https://www.ncbi.nlm.nih.gov/labs/virus/vssi/#/virus?SeqType_s=Nucleotide&VirusLineage_ss=Wuhan%20seafood%20market%20pneumonia%20virus,%20taxid:2697049) under accession ID NC_045512. The millions of worldwide SARS-CoV-2 sequences were downloaded from GISAID [23].
References
- [1].Crick F. Central dogma of molecular biology. Nature. 1970;227(5258):561–563. [DOI] [PubMed] [Google Scholar]
- [2].Wang Y, Gai Y, Li Y, et al. SARS-CoV-2 has the advantage of competing the iMet-tRNAs with human hosts to allow efficient translation. Mol Genet Genomics. 2021;296(1):113–118. [DOI] [PMC free article] [PubMed] [Google Scholar]
- [3].Li Y, Yang X, Wang N, et al. GC usage of SARS-CoV-2 genes might adapt to the environment of human lung expressed genes. Mol Genet Genomics. 2020;295(6):1537–1546. [DOI] [PMC free article] [PubMed] [Google Scholar]
- [4].Chu D, Wei L.. Direct in vivo observation of the effect of codon usage bias on gene expression in Arabidopsis hybrids. J Plant Physiol. 2021;265:153490. [DOI] [PubMed] [Google Scholar]
- [5].Yu YY, Li Y, Dong Y, et al. Natural selection on synonymous mutations in SARS-CoV-2 and the impact on estimating divergence time. Future Virol. 2021;16(7):447–450. [Google Scholar]
- [6].Quax TEF, Claassens NJ, Soll D, et al. Codon bias as a means to fine-tune gene expression. Mol Cell. 2015;59(2):149–161. [DOI] [PMC free article] [PubMed] [Google Scholar]
- [7].Zhao S, Song S, Qi Q, et al. Cost-efficiency tradeoff is optimized in various cancer types revealed by genome-wide analysis. Mol Genet Genomics. 2021;296(2):369–378. [DOI] [PubMed] [Google Scholar]
- [8].Chu D, Wei L. Characterizing the heat response of Arabidopsis thaliana from the perspective of codon usage bias and translational regulation. J Plant Physiol. 2019;240:153012. [DOI] [PubMed] [Google Scholar]
- [9].Akirtava C, McManus CJ. Control of translation by eukaryotic mRNA transcript leaders-Insights from high-throughput assays and computational modeling. Wiley Interdiscip Rev RNA. 2021;12(3):e1623. [DOI] [PMC free article] [PubMed] [Google Scholar]
- [10].Hata T, Satoh S, Takada N, et al. Kozak sequence acts as a negative regulator for de novo transcription initiation of newborn coding sequences in the plant genome. Mol Biol Evol. 2021;38(7):2791–2803. [DOI] [PMC free article] [PubMed] [Google Scholar]
- [11].Wang Y, Wang F, Xu S, et al. Optimization of a 2A self-cleaving peptide-based multigene expression system for efficient expression of upstream and downstream genes in silkworm. Mol Genet Genomics. 2019;294(4):849–859. [DOI] [PubMed] [Google Scholar]
- [12].Xu G, Yuan M, Ai C, et al. uORF-mediated translation allows engineered plant disease resistance without fitness costs. Nature. 2017;545(7655):491–494. [DOI] [PMC free article] [PubMed] [Google Scholar]
- [13].Leppek K, Das R, Barna M. Functional 5′ UTR mRNA structures in eukaryotic translation regulation and how to find them. Nat Rev Mol Cell Biol. 2018;19(3):158–174. [DOI] [PMC free article] [PubMed] [Google Scholar]
- [14].Zhang Y, Jin X, Wang H, et al. SARS-CoV-2 competes with host mRNAs for efficient translation by maintaining the mutations favorable for translation initiation. J Appl Genet. 2022;63(1):159–167. [DOI] [PMC free article] [PubMed] [Google Scholar]
- [15].Hall MN, Gabay J, Debarbouille M, et al. A role for mRNA secondary structure in the control of translation initiation. Nature. 1982;295(5850):616–618. [DOI] [PubMed] [Google Scholar]
- [16].Yu CH, Dang Y, Zhou Z, et al. Codon usage influences the local rate of translation elongation to regulate co-translational protein folding. Mol Cell. 2015;59(5):744–754. [DOI] [PMC free article] [PubMed] [Google Scholar]
- [17].Li Q, Li J, Yu C-P, et al. Synonymous mutations that regulate translation speed might play a non-negligible role in liver cancer development. BMC Cancer. 2021;21(1):388. [DOI] [PMC free article] [PubMed] [Google Scholar]
- [18].Wei L. Selection on synonymous mutations revealed by 1135 genomes of Arabidopsis thaliana. Evol Bioinform Online. 2020;16:1176934320916794. [DOI] [PMC free article] [PubMed] [Google Scholar]
- [19].Eyre-Walker A. The genomic rate of adaptive evolution. Trends Ecol Evol. 2006;21(10):569–575. [DOI] [PubMed] [Google Scholar]
- [20].Kimura M. The neutral theory of molecular evolution. Sci Am. 1979;241(5):98–100. [DOI] [PubMed] [Google Scholar]
- [21].Chang S, Li J, and Li Q, et al. Retrieving the deleterious mutations before extinction: genome-wide comparison of shared derived mutations in liver cancer and normal population. Postgrad Med J. 2021. 10.1136/postgradmedj-2021-139993 [DOI] [PubMed] [Google Scholar]
- [22].Zhang YP, Jiang W, Li Y, et al. Fast evolution of SARS-CoV-2 driven by deamination systems in hosts. Future Virol. 2021;16(9):587–590. [DOI] [PMC free article] [PubMed] [Google Scholar]
- [23].Shu Y, and McCauley J. GISAID: global initiative on sharing all influenza data - from vision to reality. Euro Surveill. 2017;22(13). 10.2807/1560-7917.ES.2017.22.13.30494 [DOI] [PMC free article] [PubMed] [Google Scholar]
- [24].Plante JA, Liu Y, Liu J, et al. Spike mutation D614G alters SARS-CoV-2 fitness. Nature. 2021;592(7852):116–121. [DOI] [PMC free article] [PubMed] [Google Scholar]
- [25].Volz E, Hill V, McCrone JT, et al. Evaluating the effects of sars-cov-2 spike mutation d614g on transmissibility and pathogenicity. Cell. 2021;184(1):64–75 e11. [DOI] [PMC free article] [PubMed] [Google Scholar]
- [26].Lu L, Chu AW, Zhang RR, et al. The impact of spike N501Y mutation on neutralizing activity and RBD binding of SARS-CoV-2 convalescent serum. EBioMedicine. 2021;71:103544. [DOI] [PMC free article] [PubMed] [Google Scholar]
- [27].Tian F, Tong B, and Sun L, et al. N501Y mutation of spike protein in SARS-CoV-2 strengthens its binding to receptor ACE2. Elife. 2021;10. 10.7554/eLife.69091 [DOI] [PMC free article] [PubMed] [Google Scholar]
- [28].Li Y, Yang XN, Wang N, et al. The divergence between SARS-CoV-2 and RaTG13 might be overestimated due to the extensive RNA modification. Future Virol. 2020;15(6):341–347. [Google Scholar]
- [29].Hofacker IL. Vienna RNA secondary structure server. Nucleic Acids Res. 2003;31(13):3429–3431. [DOI] [PMC free article] [PubMed] [Google Scholar]
- [30].Sun L, Li P, Ju X, et al. In vivo structural characterization of the SARS-CoV-2 RNA genome identifies host proteins vulnerable to repurposed drugs. Cell. 2021;184(7):1865–1883. e1820. [DOI] [PMC free article] [PubMed] [Google Scholar]
- [31].Thompson JD, Higgins DG, Gibson TJ. CLUSTAL W: improving the sensitivity of progressive multiple sequence alignment through sequence weighting, position-specific gap penalties and weight matrix choice. Nucleic Acids Res. 1994;22(22):4673–4680. [DOI] [PMC free article] [PubMed] [Google Scholar]
- [32].Miller JB, Brase LR, Ridge PG. ExtRamp: a novel algorithm for extracting the ramp sequence based on the tRNA adaptation index or relative codon adaptiveness. NAR. 2019;47(3):1123–1131. [DOI] [PMC free article] [PubMed] [Google Scholar]
- [33].Martignano F, Di Giorgio S, Mattiuz G, et al. Commentary on “poor evidence for host-dependent regular RNA editing in the transcriptome of SARS-CoV-2”. J Appl Genet. 2022;63(2):423–428. [DOI] [PMC free article] [PubMed] [Google Scholar]
- [34].Zong J, Zhang Y, Guo F, et al. Poor evidence for host-dependent regular RNA editing in the transcriptome of SARS-CoV-2. J Appl Genet. 2022;63(2):413–421. [DOI] [PMC free article] [PubMed] [Google Scholar]
- [35].Li Y, Yang XN, Wang N, et al. Pros and cons of the application of evolutionary theories to the evolution of SARS-CoV-2. Future Virol. 2020;15(6):369–372. [Google Scholar]
- [36].Liu X, Liu X, Zhou J, et al. Rampant C-to-U deamination accounts for the intrinsically high mutation rate in SARS-CoV-2 spike gene. RNA. 2022. DOI: 10.1261/rna.079160.122 [DOI] [PMC free article] [PubMed] [Google Scholar]
- [37].Di Giorgio S, Martignano F, Torcia MG, et al. Evidence for host-dependent RNA editing in the transcriptome of SARS-CoV-2. Sci Adv. 2020;6(25):eabb5813. [DOI] [PMC free article] [PubMed] [Google Scholar]
- [38].Li Y, Yang X, Wang N, et al. Mutation profile of over 4500 SARS-CoV-2 isolations reveals prevalent cytosine-to-uridine deamination on viral RNAs. Future Microbiol. 2020;15:1343–1352. [DOI] [PubMed] [Google Scholar]
- [39].Cai H, Liu X, Zheng X. RNA editing detection in SARS-CoV-2 transcriptome should be different from traditional SNV identification. J Appl Genet. 2022. DOI: 10.1007/s13353-022-00706-y [DOI] [PMC free article] [PubMed] [Google Scholar]
- [40].Wei L. Reconciling the debate on deamination on viral RNA. J Appl Genet. 2022. DOI: 10.1007/s13353-022-00698-9 [DOI] [PMC free article] [PubMed] [Google Scholar]
Associated Data
This section collects any data citations, data availability statements, or supplementary materials included in this article.
Supplementary Materials
Data Availability Statement
We downloaded the SARS-CoV-2 genome from the NCBI website (https://www.ncbi.nlm.nih.gov/labs/virus/vssi/#/virus?SeqType_s=Nucleotide&VirusLineage_ss=Wuhan%20seafood%20market%20pneumonia%20virus,%20taxid:2697049) under accession ID NC_045512. The millions of worldwide SARS-CoV-2 sequences were downloaded from GISAID [23].