Abstract
Diabetes is a major disease and known to impair microvascular recruitment due to insulin resistance. Previous quantifications of the changes in microvascular networks at the capillary level were being performed with either full or manually selected region-of-interests (ROIs) from super-resolution ultrasound (SR-US) images. However, these approaches were imprecise, time-consuming, and unsuitable for automated processes. Here we provided a custom software solution for automated multiscale analysis of SR-US images of tissue microvascularity patterns. An Acuson Sequoia 512 ultrasound (US) scanner equipped with a 15L8-S linear array transducer was used in a nonlinear imaging mode to collect all data. C57BL/6J male mice fed standard chow and studied at age 13–16 wk comprised the lean group (N = 14), and 24–31 wk-old mice who received a high-fat diet provided the obese group (N = 8). After administration of a microbubble (MB) contrast agent, the proximal hindlimb adductor muscle of each animal was imaged (dynamic contrast-enhanced US, DCE-US) for 10 min at baseline and again at 1 h and towards the end of a 2 h hyperinsulinemic-euglycemic clamp. Vascular structures were enhanced with a multiscale vessel enhancement filter and binary vessel segments were delineated using Otsu’s global threshold method. We then computed vessel diameters by employing morphological image processing methods for quantitative analysis. Our custom software enabled automated multiscale image examination by defining a diameter threshold to limit the analysis at the capillary level. Longitudinal changes in AUC, IPK, and MVD were significant for lean group (p < 0.02 using Full-ROI and p < 0.01 using 150 μm-ROI) and for obese group (p < 0.02 using Full-ROI, p < 0.03 using 150 μm-ROI). By eliminating large vessels from the ROI (above 150 μm in diameter), perfusion parameters were more sensitive to changes exhibited by the smaller vessels, that are known to be more impacted by disease and treatment.
Keywords: diabetes, microvascular networks, morphological image processing, multiscale vessel enhancement, perfusion parameters, restricted ROI, SR-US imaging, skeletal muscle tissue
1. INTRODUCTION
Considering the high mortality and morbidity rate as well as the high costs related to the treatment, diabetes is one of the diseases with the greatest impact across the world. Type 2 diabetes occupies 90 percent of 400 million individuals diagnosed with diabetes1. Type 2 diabetes and its relation to skeletal muscle microvascular environment have long been one of the important topics in diabetes research2–5,5. Microvascular blood supply is found to be critical in many diseases including, but not limited to, reduction of the lower extremity muscle strength6, hyperinsulinemia, and cardiovascular diseases7.DCE-US imaging was employed successfully for the investigation of the microvascular changes8. With its real-time, low-cost, and non-ionizing capabilities, ultrasound (US) was the imaging modality of choice. The resolution of DCE-US images was increased by 10x with the recently introduced technique of SR-US9. Increased resolution enabled ultrasound imaging at the capillary level where the microvascular recruitment occurs in vivo. Different parameters, such as microbubble size, dose, imaging frame rate, and data acquisition time were examined to optimize in vivo SR-US imaging for the analysis of type 2 diabetes10. The quantification of tissue perfusion was performed not only from intensity values but also from the number of microbubbles11–16.
Manual selection of the region-of-interest (ROI) is a subject-dependent and time-consuming process. It is also not suitable for automated analysis. Given the fact that the larger vessels are not affected by microvascular recruitment4,17, it is crucial to develop an automated strategy for eliminating large vessels from the data analysis. The purpose of this research project was to develop a custom software tool for improving the sensitivity of the microvascular recruitment analysis by eliminating the larger vessels selectively. This approach helped to provide the individual contribution of vessel groups at different scales to the temporal changes. Specifically, larger vessels have more blood flow which would minimize the estimation variance. Using a diameter threshold, longitudinal changes in perfusion parameters were more precise which can help to reduce the sample size for the study. Furthermore, the automated ROI selection granted the objectivity for understanding the regulation of the glucose uptake in vivo microvascular networks.
2. METHODS
2.1. Animal preparation and SR-US imaging
Studies were performed in male C57BL/6J mice (The Jackson Laboratory, Bar Harbor, ME). Lean mice (N=14) were fed standard chow for their entire post-weaning life and studied at 13–16 wk of age. For obese group (N=8), to promote obesity and invoke insulin resistance, at 5 wk of age additional mice were placed on a high-fat diet (D1233i, Research Diets Inc, New Brunswick, NJ) until the time of study at age 24–31 wk. Following an overnight fasting period, mice were anesthetized using isoflurane inhalation and normal body temperature (36.5 ±0.5°C) was maintained throughout the procedure using a rectal probe and heating pad temperature monitor and homeothermic controller (Kent Scientific Corp, Torrington, CT). The proximal hindlimb adductor muscle group (adductor magnus and semimembranosus) were shaved to minimize any US imaging artifacts. The animals were instrumented with a jugular venous catheter and a 4-way connector which insulin, glucose, and a MB contrast agent were administered. After a 60-min delay to allow stabilization, baseline SR-US imaging was performed for 10 min before and following a slow bolus injection of a custom MB contrast agent (2.5 × 10⁷ MBs diluted to 100 μL with saline)18. MB concentrations were measured prior to injection using established methods (Multisizer 3 Coulter Counter, Beckman Coulter, Brea, CA). The US imaging transducer was positioned and secured on the proximal hindlimb adductor muscle group to help capture any microvascular changes along the same image plane. A grayscale US scan was collected before MB injection. These imaging sessions were performed at baseline and in response to insulin (20 mU·kg-1·min-1) at 1h and towards the end of a 2 h hyperinsulinemic-euglycemic clamp, which is the most widely used experimental procedure for the determination of insulin sensitivity. During the clamp procedure, blood glucose levels were monitored every 5 min by a glucometer and maintained at 120 ± 5 mg/dL.
Using a clinical US scanner (Acuson Sequoia 512, Siemens Healthcare, Mountain View, CA) equipped with a 15L8 linear transducer array and operating in a nonlinear contrast mode, DCE-US images were collected for 10 min at 15 frames per second for each cine. Potential microbubble (MB) destructions were minimized using a mechanical index less than 0.2. The proposed image processing pipeline illustrated in Figure 1 started with a temporal sequence of DCE-US images. The first frame of each DCE-US dataset was subtracted from its subsequent frames. After this normalization step, tissue and MB signals were separated using a singular value decomposition filter10,11,19. After localization of individual MBs, a maximum intensity projection image (MIP) was created as a cumulative MB count map over the whole stack of frames10,11,20. Custom MATLAB software (Release 2018a, Mathworks Inc, Natick, MA) installed on an Alien Aurora desktop computer (Dell Inc, Round Roc, TX) was used for parallel processing to reduce computational time.
Figure 1.
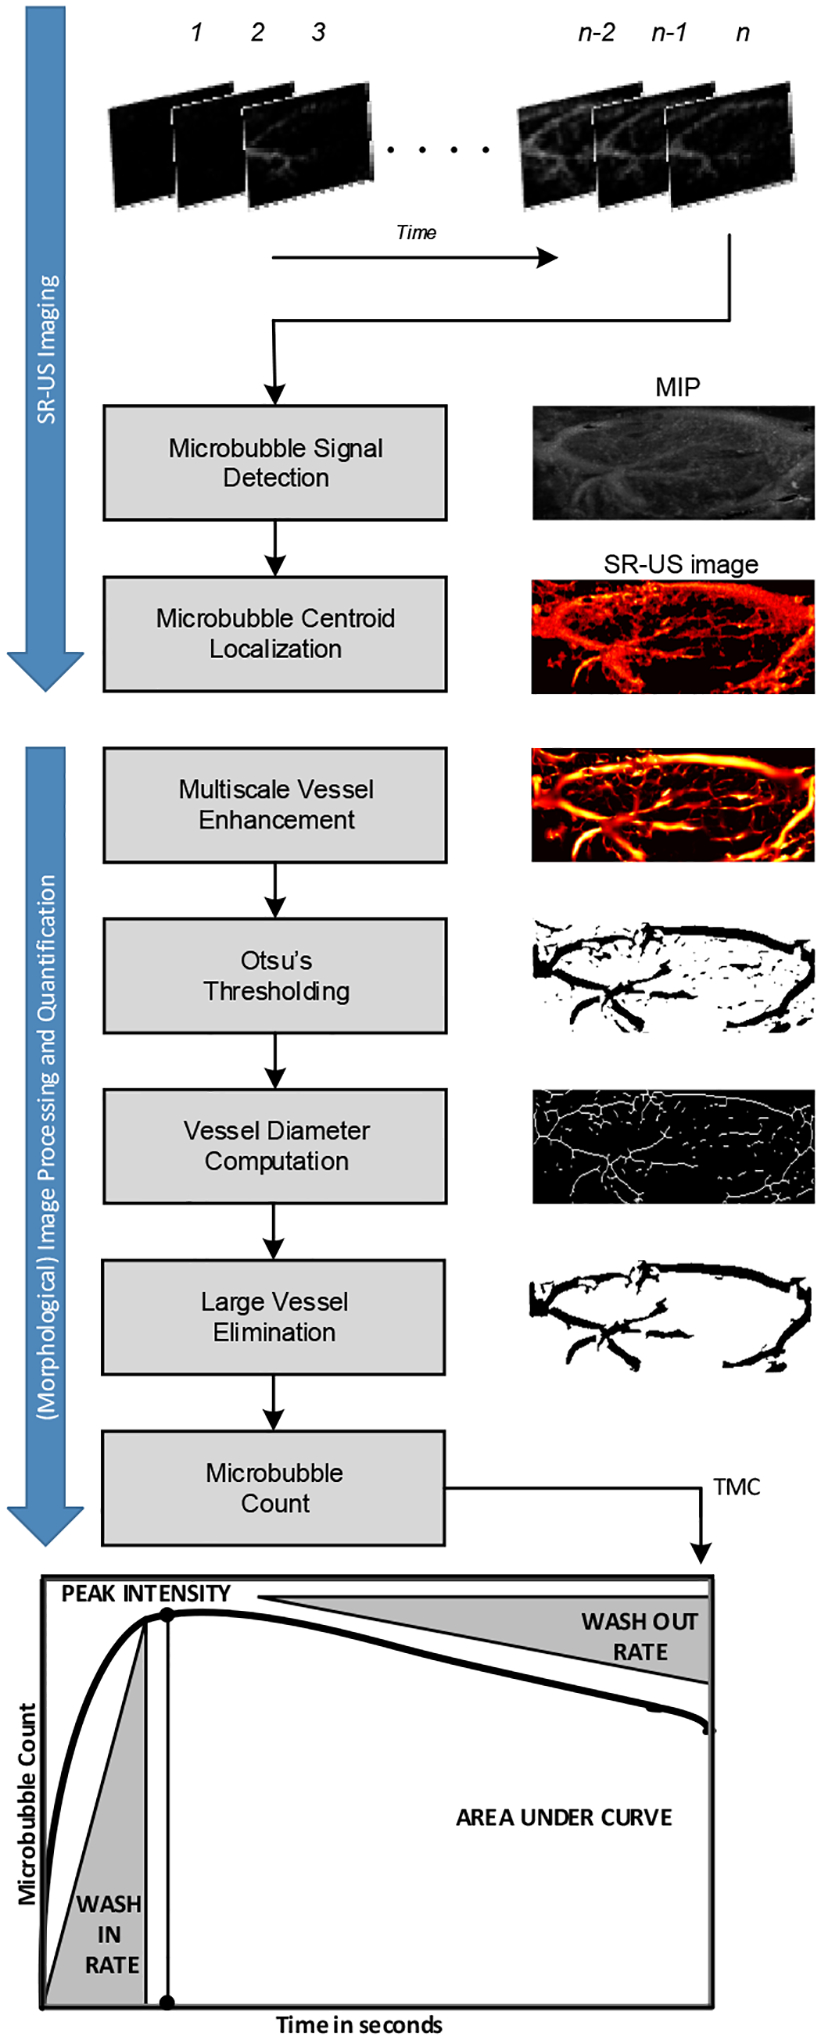
Summary of the image processing steps and resulting images from each step for analysis of perfusion parameters area under the curve (AUC), peak intensity (IPK), wash-in rate (WIR), and wash-out rate (WOR) derived from the time microbubble count curve.
2.2. Multiscale Vessel Enhancement
A multiscale vessel enhancement filter was applied to detect the larger vessels in the ROI from MIP with MB count values. Known as Frangi filter, it was widely used to improve the diagnostic quality of X-ray angiography images21. This method considered vessels as tubular structures in 2D images. The proportional relation between the eigenvalues of the Hessian matrix for a specific point and the curvature at that point was used to detect the tubular shapes. Specifically, high curvature in one direction and low curvature in the orthogonal direction was defined as a vessel. The derivatives of the image were obtained using derivatives of Gaussian convolutions. Having applied Gaussian kernels with different standard deviations, vessels from a range of diameters were found. The vesselness function21 responded with a high value to the vessel-like pixels and minimized the impact of the image noise. After enhancing the tubular structures of the image, Otsu’s clustering-based global threshold method22 was used to create the binary images as a preparation of morphological image processing steps as seen in Figure 1.
2.3. Morphological image processing
Based on mathematical set theory, morphological image processing was applied to extract image components for representing and describing region shape23. Operating with binary images that consist exclusively from foreground and background values 1 and 0, morphological image processing methods were intensity invariant and they rely on pixel locations. The connectivity of the pixels that embody an object in the image, contained the information about its geometrical shape. We used 8 connectivity which requires two pixels to share either an edge or a vertex in its direct and indirect neighborhood as shown in Figure 2.
Figure 2.
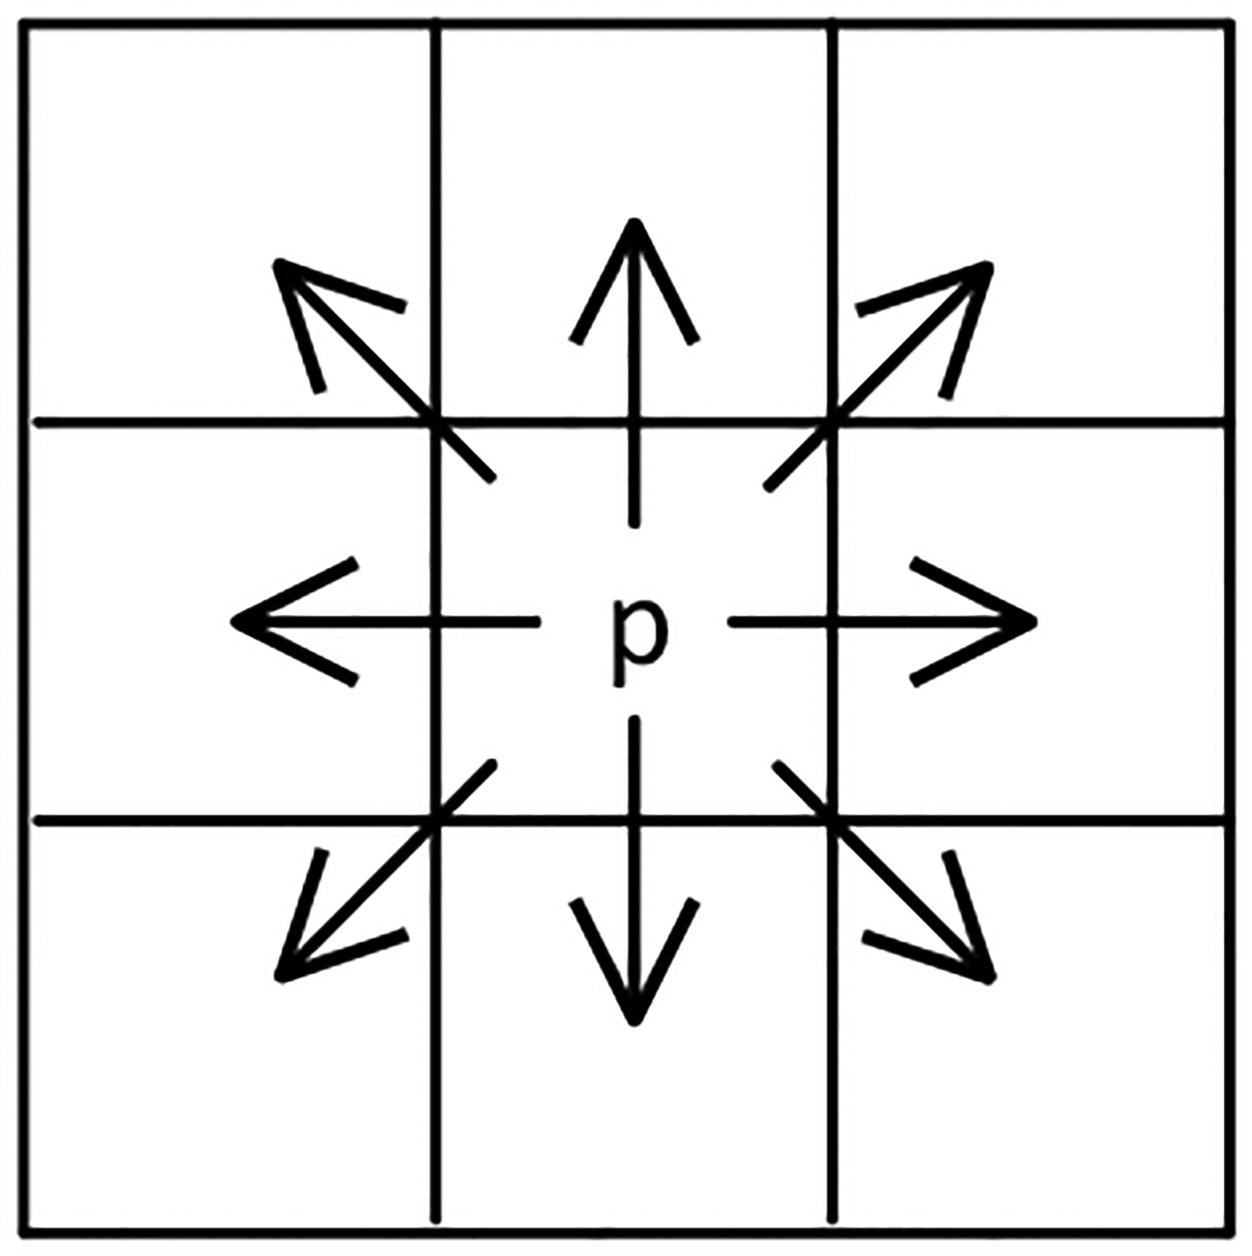
8-Connectivity is depicted for pixel p. Arrows point the connected pixels of p
Vessel segments were identified as connected components, and their centerlines were found using a thinning algorithm while preserving their topology as shown in Figure 1. For each foreground pixel on the centerline, the nearest background pixel was searched. Figure 3 depicted how the Euclidian distance (De) between the centerline pixel (p) and the edge pixel (q) with their coordinates (x, y) and (s, t) respectively, was computed as the radius at p.
Figure 3.
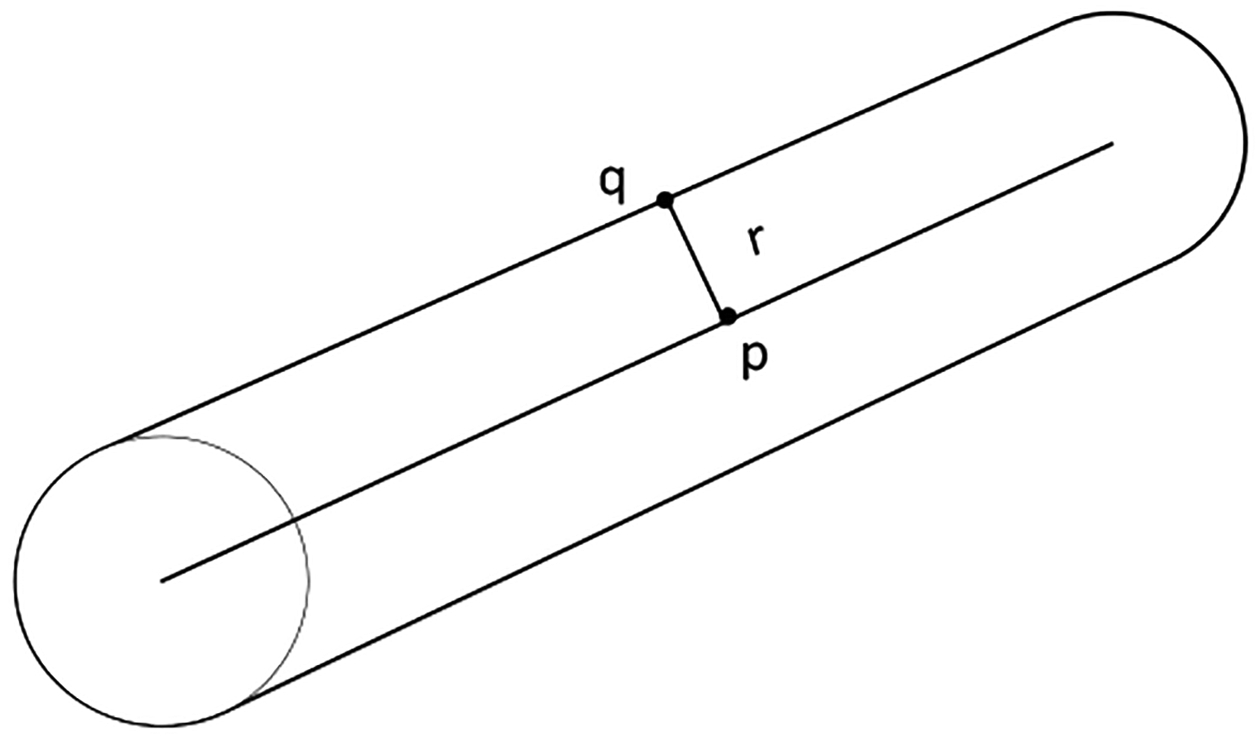
Distance transform between pixels on the centerline and pixels on the edge.
| (1) |
Multiplying this metric by two provided the ultimate estimation of the diameter for the respective vessel segment at the specific centerline point. Finally, taking all diameters from one vessel segment into account, the average diameter was computed. Once all the diameters were computed, we were able to restrict the ROI based on the vessel diameters using a diameter threshold.
2.4. Perfusion parametric analysis
Time-microbubble count (TMC) curve parametric analysis11 was performed as an improved version of the time-intensity curve (TIC) analysis14,15,20. TMC curve describes the temporal history of contrast agent flow dynamics. After approximating the TMC data as a gamma-variate function smooth curve, surrogate measurements derived from the shape of the curve were analyzed. As seen in Figure 1, peak intensity (IPK) which represents the peak microbubble count, area under the curve (AUC), wash-in rate (WIR), wash-out rate (WOR), and microvessel density (MVD) as the ratio of the number of vessel pixels over number of pixels in the ROI were analyzed for four different ROIs. Specifically, the full image was used for Full-ROI, and the three diameter thresholds were set to restrict the ROI for large vessels to be excluded from the analysis, such as all vessels above 300 μm, 200 μm, and 150 μm. For the remaining part of the paper, we will use the following naming for the respective ROIs: Full-ROI, 300 μm-ROI, 200 μm-ROI, and 150 μm-ROI.
2.5. Statistical tests
Perfusion parameters derived from the TMC curves of lean and obese group are summarized as mean ± standard error. Comparisons for the longitudinal measurements of individual parameters were performed using paired t-test for each group separately. Finally, the differences between the relative changes from baseline to 1h measurements for lean and obese group were tested using Wilcoxon rank-sum test. Since the distributions of relative changes were significantly different than the normal distribution, a non-parametric alternative of two-sample t-test was chosen.
3. RESULTS
Morphological image processing strategy for multiscale analysis of the SR-US images from tissue microvascular networks was evaluated using an animal model of type 2 diabetes. We showed our results in qualitative visualizations of a representative subject and in quantitative statistical outcomes from all subjects included in the study.
SR-US images before and after multiscale vessel enhancement filter were shown in Figure 4. The microvascular recruitment from two consecutive time points was observed in the SR-US images (A and B) while the large vessels stayed unaffected as it was observed in enhanced images (C and D). Multiscale vessel enhancement filter helped to delineate the large vessels and used as preprocessing step before segmentation.
Figure 4.
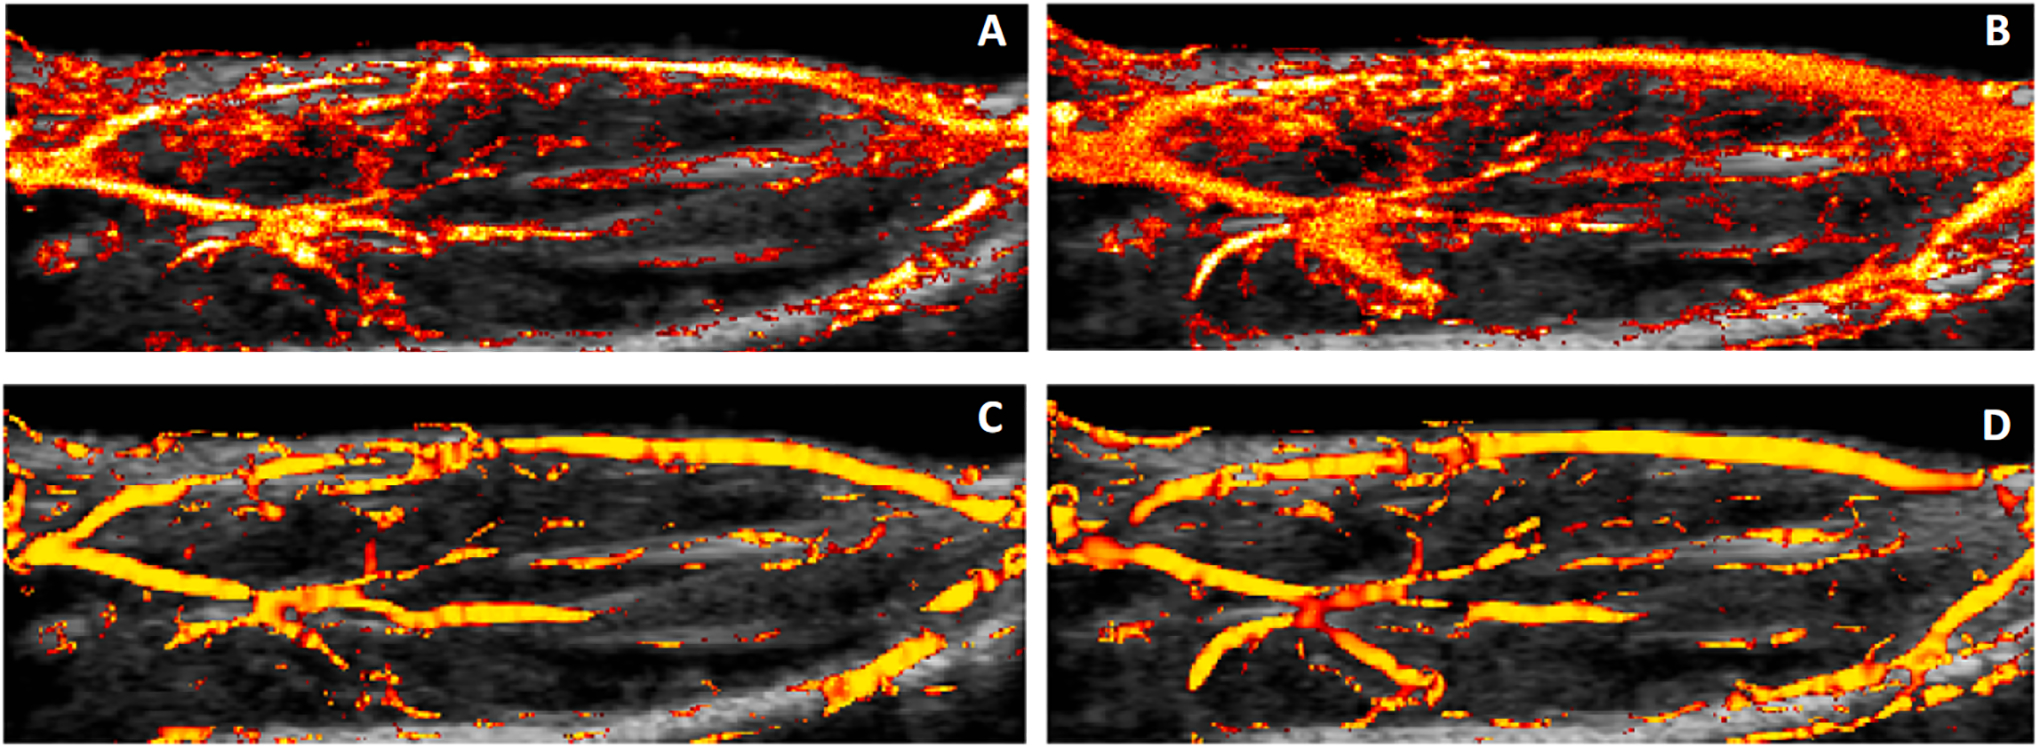
SR-US images of a representative lean subject at baseline (A) and 1h (B) after insulin/glucose injection. Image (C) and (D) show the detection of the large vessels from (A) and (B) respectively.
TMC curves for four different ROIs of the same representative subject were depicted in Figure 5. The results from parametric perfusion analysis demonstrated a shift in the MB count values as the ROI was restricted more in smaller vessels. TMC curve from Full-ROI started with a MB count greater than zero. MB count from 150 μm-ROI started and ended close to zero which reflects real-world expectations.
Figure 5.
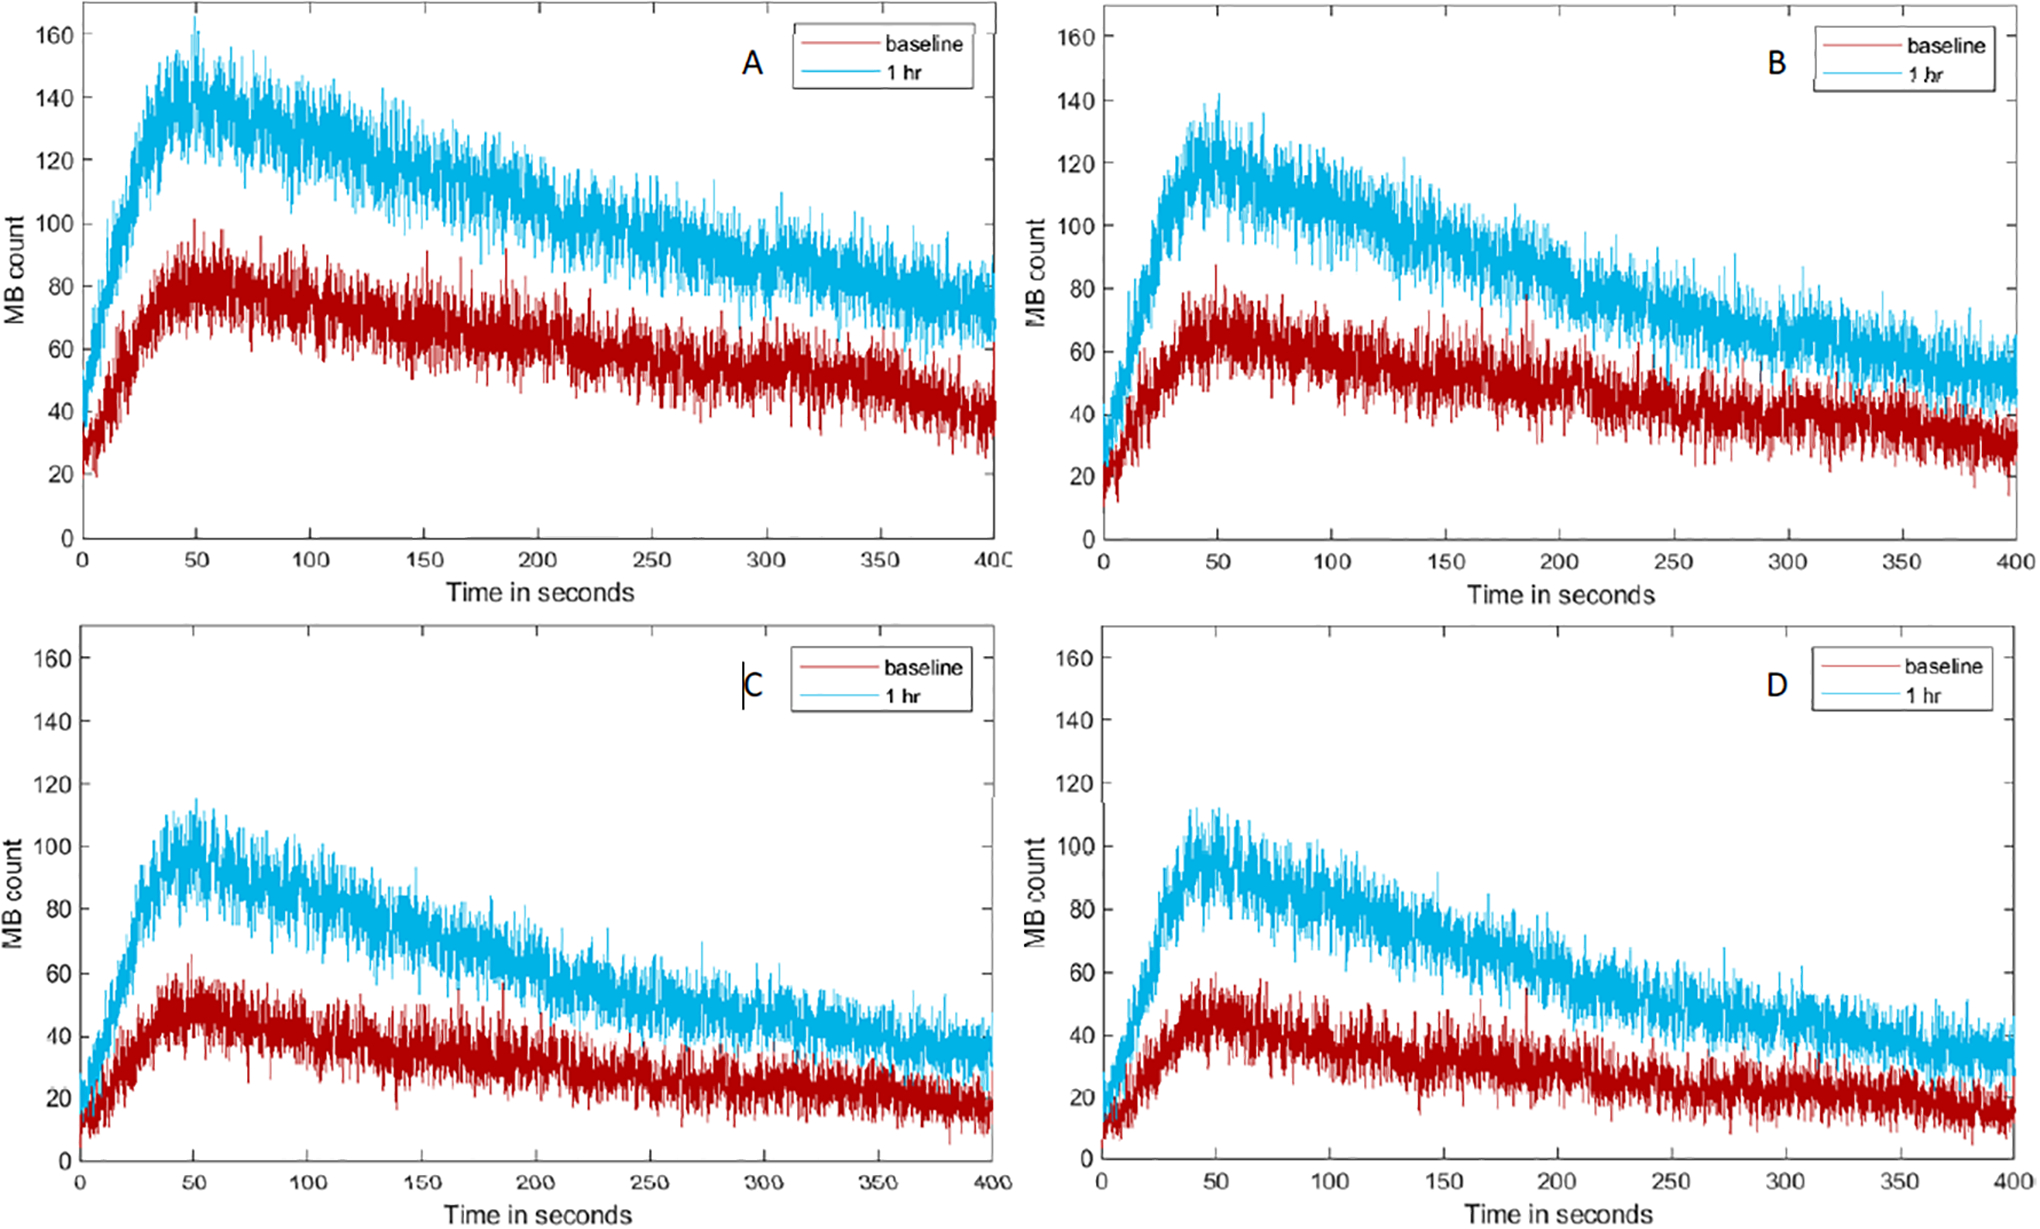
Representative TMC created using Full-ROI (A), a restricted ROI containing vessels smaller than 300 μm (B), 200 μm (C), and 150 μm (D) in diameter from lean animal where the higher increases in MB count are perceived (relative to baseline measure).
Absolute changes in longitudinal measurements for the obese group were significant for the AUC, IPK, and MVD parameters from baseline to 1h (p < 0.02 using Full-ROI or 300 μm-ROI and p < 0.03 using 200 μm-ROI or 150 μm-ROI). WIR values were significant (p < 0.03) only for the 150 μm-ROI and WOR values were significant (p < 0.03) only for 200 μm-ROI and 150 μm-ROI. The results for the obese group were shown in Figure 6.
Figure 6.
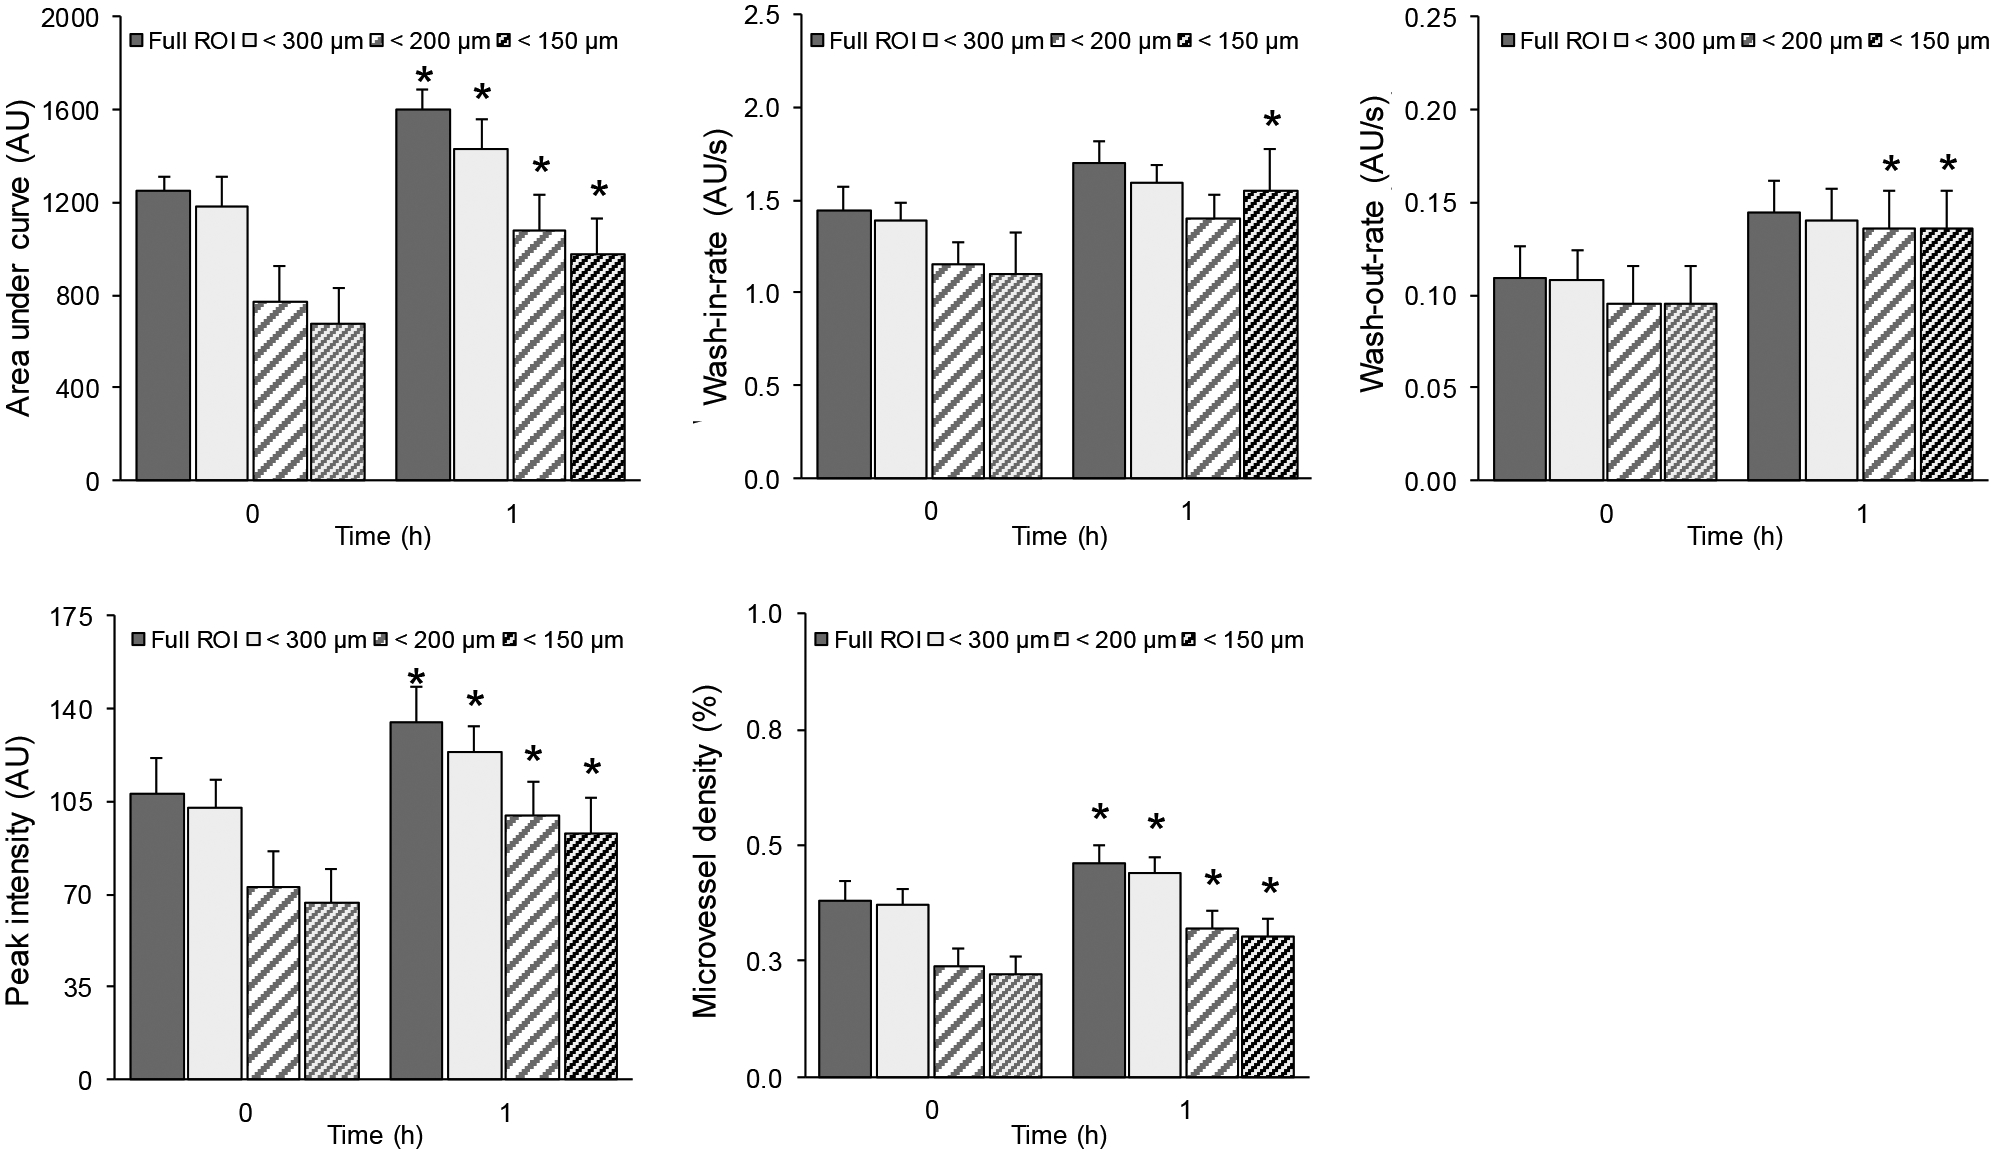
Summary of skeletal muscle parametric measurements characterizing the insulin-induced microvascular response or dysfunction derived from SR-US imaging data collected in obese animals. Absolute changes in perfusion parameters from the obese group when using full ROI, restricted ROI for vessels smaller 300 μm, 200 μm, and 150 μm in diameter. A * denotes p < 0.03.
Longitudinal measurements for the lean group were significant for the absolute changes in AUC, IPK, MVD, WIR, and WOR parameters from baseline to 1h (p < 0.01 using all different ROIs). The results for the lean group were shown in Figure 7. A * denotes p < 0.01.
Figure 7.
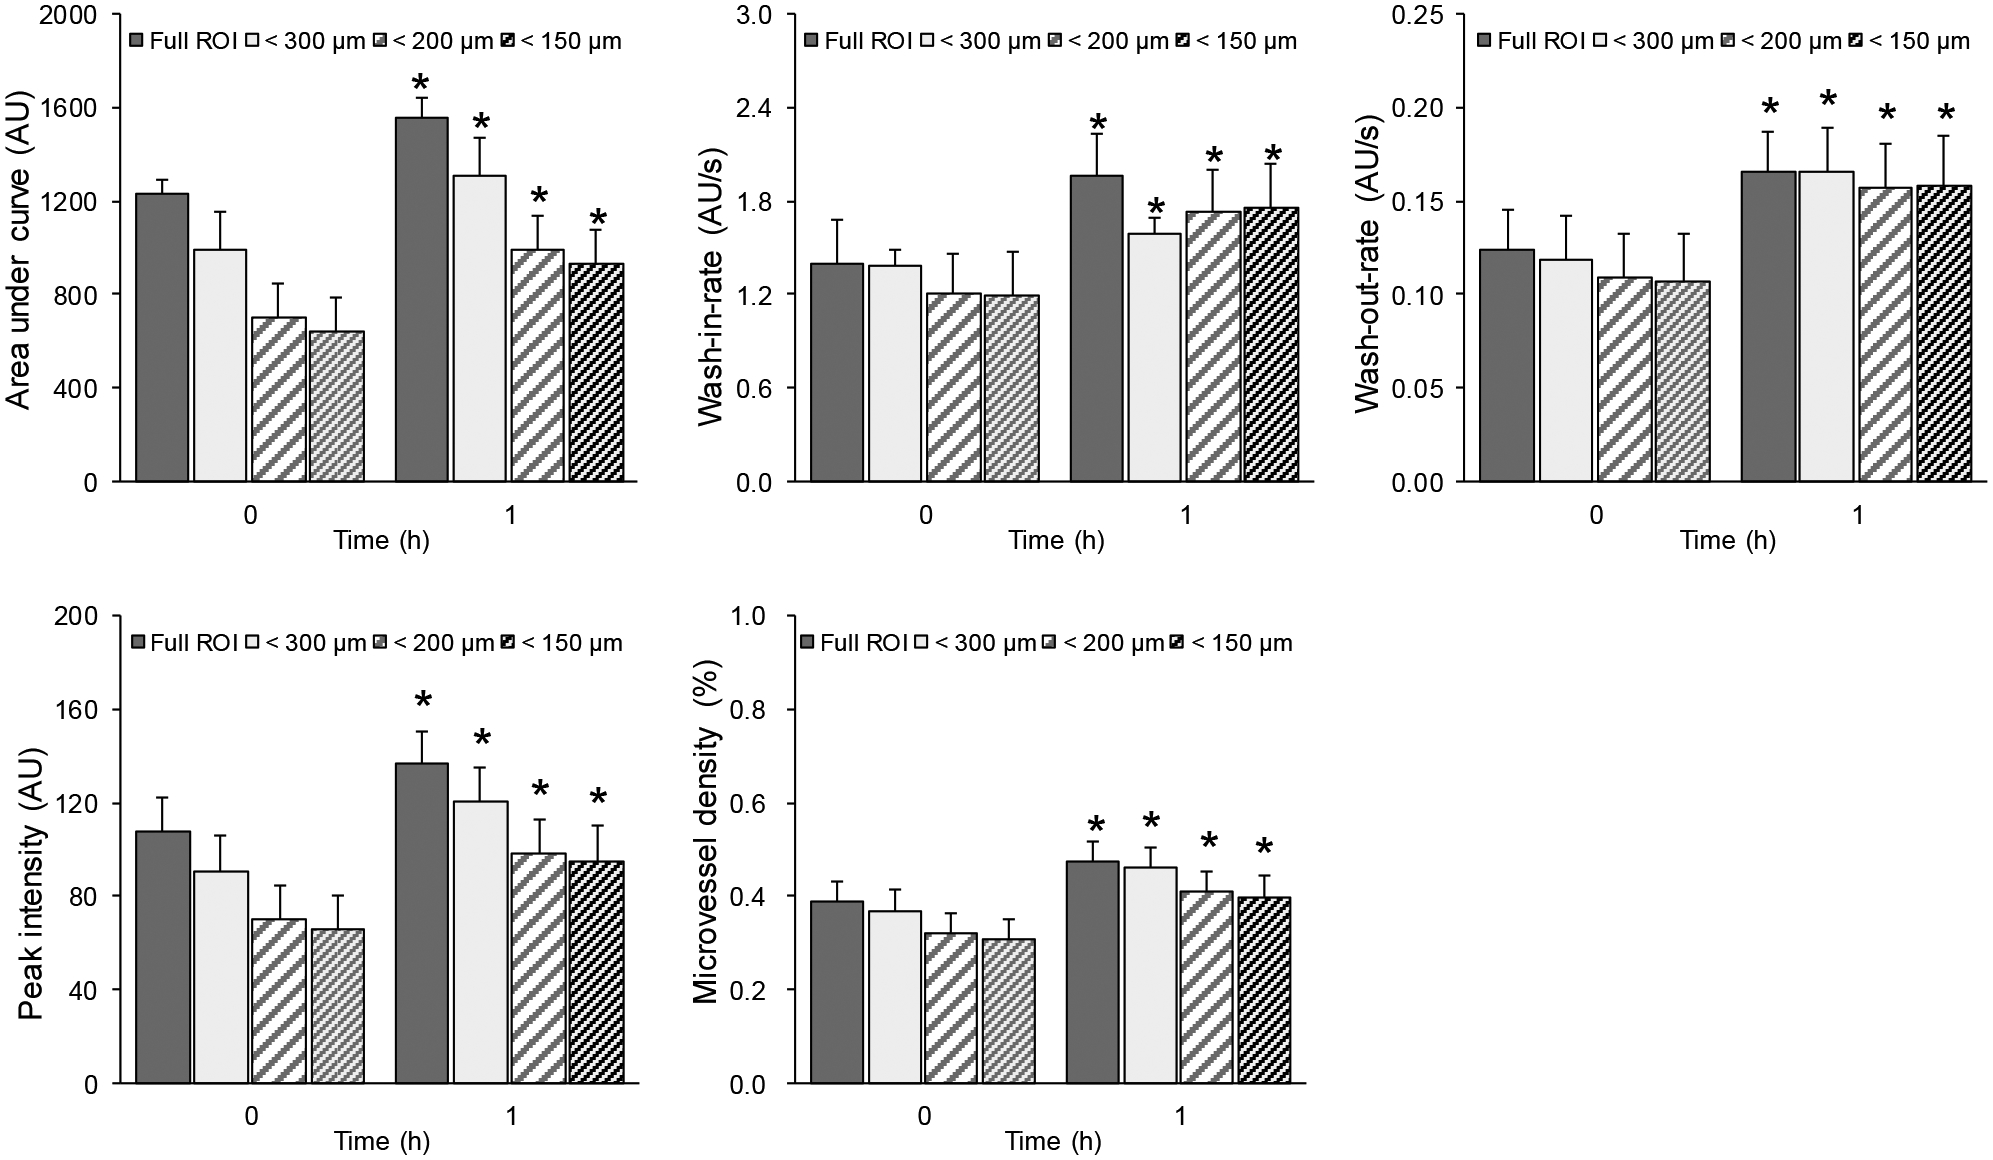
Summary of skeletal muscle parametric measurements characterizing the insulin-induced microvascular response or dysfunction derived from SR-US imaging data collected in lean animals. Absolute changes in perfusion parameters from the lean group when using full ROI, restricted ROI for vessels smaller than 300 μm, 200 μm, and 150 μm in diameter. A * denotes p < 0.01. Using restricted ROIs, significant changes in longitudinal measurements were preserved.
The changes at 1h relative to baseline were increased gradually for the lean group when we used the smaller diameter threshold, as seen in Figure 8. We demonstrated also the differences between the lean and obese group with regard to the changes relative to the baseline in Figure 8. A summary of the relative changes was presented in Table 1.
Figure 8.
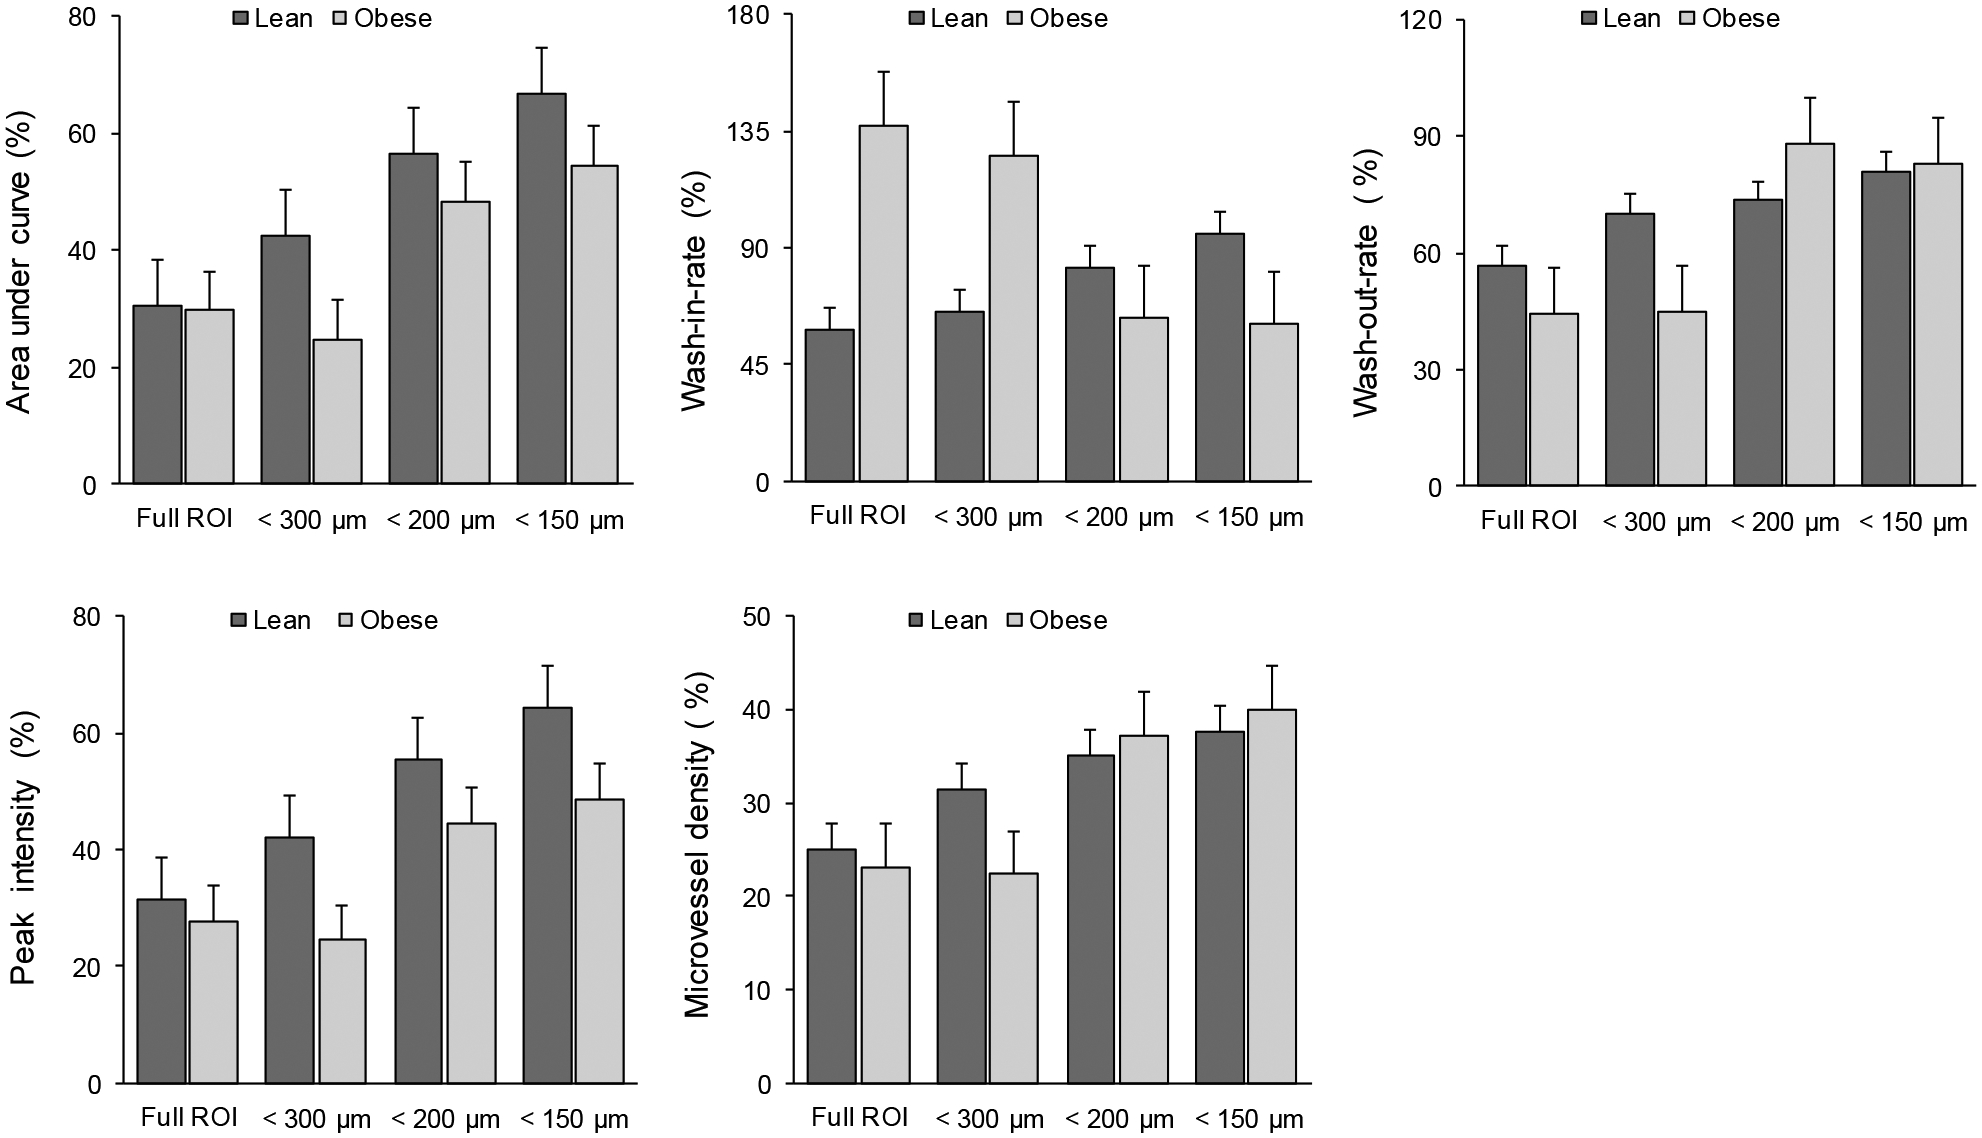
Relative changes in perfusion parameters compared with different mice groups (lean and obese) and using different ROIs. Bar graphs detail the percentage changes relative to baseline measures for AUC, WIR, WOR, IPK, and MVD parameters. Note the increased changes of AUC and IPK in lean group compared to obese group when using restricted ROIs.
Table 1.
Summary of relative changes in perfusion parameters using different ROIs for lean and obese group.
| ROI | AUC (%) | IPK (%) | MVD (%) | WIR (%) | WOR (%) | |||||
|---|---|---|---|---|---|---|---|---|---|---|
| Lean | Obese | Lean | Obese | Lean | Obese | Lean | Obese | Lean | Obese | |
| Full | 30.45 | 29.69 | 31.31 | 27.67 | 25.01 | 23.07 | 58.06 | 137.23 | 56.75 | 44.48 |
| 300 μm | 44.99 | 23.89 | 43.48 | 23.88 | 31.37 | 22.34 | 64.17 | 137.46 | 72.02 | 43.74 |
| 200 μm | 56.09 | 50.62 | 53.97 | 46.68 | 35.03 | 37.19 | 80.40 | 79.01 | 73.49 | 99.03 |
| 150 μm | 66.02 | 56.63 | 61.97 | 50.70 | 37.67 | 39.98 | 90.92 | 61.57 | 79.65 | 92.69 |
4. DISCUSSION
Morphological image processing for multiscale analysis of SR-US images was used for understanding insulin-mediated microvascular changes in skeletal muscle. Quantification of impairment of microvascular function in skeletal muscle was important for several studies2,3,5,7,11,17. As ROI for comparing temporal changes in microvasculature, either the full image or a subjective drawing was used. This method was time-consuming, imprecise, and not suited for automated image processing pipelines. Our method used a quantification of microvascular morphology information, vessel diameter, to enable a multiscale analysis by restricting ROI automatically based on a diameter threshold. It can easily be integrated into the automated image processing pipelines. Selection of small vessel regions based on diameter measures was faster and provided objectivity. For this reason, the results were reproducible when using the same diameter threshold.
Focusing our analysis into the relevant scale of microvascular recruitment in skeletal muscle, the significant differences between longitudinal SR-US images were preserved. Using restricted ROIs, TMC curve was shifted towards zero by its starting and ending point which depicts a realistic starting and ending MB count for a bolus injection. For that reason, our results suggested that removing larger vessels from the skeletal muscle parametric measurements characterizing the insulin-induced microvascular response or dysfunction, significant changes were maintained. In addition, absolute changes in WIR and WOR were not significant for Full-ROI while they were significant when using restricted ROIs with smaller diameter thresholds. Therefore, our method can increase the sensitivity of the analysis depending on the selected diameter threshold and reduce the sample size needed for the study. A comparison of relative changes between lean and obese group was not significant for any of the ROIs. Regarding the relative changes, a linearly increasing trend for the lean group was observed for all the parameters when using restricted ROIs which was not the case for the obese group.
The use of the Gaussian convolutions in multiscale vessel enhancement filter caused some smoothing on the vessel edges. As demonstrated in Figure 2, this did not affect the detection of large vessels. Also, the relation between large and small vessels was preserved in the binary images using Otsu’s global threshold method. Morphological image processing methods were suitable to measure the diameter of the vessels from the binary images.
5. CONCLUSION
Morphological image processing for multiscale analysis of SR-US images provided a reproducible, automated, and more sensitive analysis of functional characteristics and contributions of microvascular networks at different scales to the pathogenesis of type 2 diabetes. Future work should focus on improving the quantification methods by adding motion correction steps into the image processing pipeline.
ACKNOWLEDGEMENT
This work was supported in part by NIH grants K25EB017222 and R21CA212851 and Cancer Prevention Research Institute of Texas (CPRIT) grant RP180670.
REFERENCES
- [1].World Health Organization., [Global report on diabetes], World Health Organization; (2016). [Google Scholar]
- [2].Vincent MA, Clerk LH, Lindner JR, Klibanov AL, Clark MG, Rattigan S and Barrett EJ, “Microvascular Recruitment Is an Early Insulin Effect That Regulates Skeletal Muscle Glucose Uptake In Vivo,” Diabetes 53(6), 1418–1423 (2004). [DOI] [PubMed] [Google Scholar]
- [3].Chadderdon SM, Belcik JT, Bader L, Peters DM, Kievit P, Alkayed NJ, Kaul S, Grove KL and Lindner JR, “Temporal Changes in Skeletal Muscle Capillary Responses and Endothelial-Derived Vasodilators in Obesity-Related Insulin Resistance,” Diabetes 65(8), 2249–2257 (2016). [DOI] [PMC free article] [PubMed] [Google Scholar]
- [4].Porter TR, “Capillary Blood Flow Abnormalities in the Skeletal Muscle and Microvascular Complications in Diabetes: Lessons That Cannot Be Learned From Larger Vessels Editorials published in the Journal of the American College of Cardiology reflect the views of the authors and do not necessarily represent the views of JACCor the American College of Cardiology.,” Journal of the American College of Cardiology 53(23), 2184–2185 (2009). [DOI] [PubMed] [Google Scholar]
- [5].Womack L, Peters D, Barrett EJ, Kaul S, Price W and Lindner JR, “ABNORMAL SKELETAL MUSCLE CAPILLARY RECRUITMENT DURING EXERCISE IN PATIENTS WITH TYPE 2 DIABETES MELLITUS AND MICROVASCULAR COMPLICATIONS,” J Am Coll Cardiol 53(23), 2175–2183 (2009). [DOI] [PMC free article] [PubMed] [Google Scholar]
- [6].IJzerman TH, Schaper NC, Melai T, Meijer K, Willems PJB and Savelberg HHCM, “Lower extremity muscle strength is reduced in people with type 2 diabetes, with and without polyneuropathy, and is associated with impaired mobility and reduced quality of life,” Diabetes Res. Clin. Pract 95(3), 345–351 (2012). [DOI] [PubMed] [Google Scholar]
- [7].Martín-Timón I, Sevillano-Collantes C, Segura-Galindo A and del Cañizo-Gómez FJ, “Type 2 diabetes and cardiovascular disease: Have all risk factors the same strength?,” World J Diabetes 5(4), 444–470 (2014). [DOI] [PMC free article] [PubMed] [Google Scholar]
- [8].Lindner JR, “Microbubbles in medical imaging: current applications and future directions,” Nature Reviews Drug Discovery 3(6), 527–533 (2004). [DOI] [PubMed] [Google Scholar]
- [9].Errico C, Pierre J, Pezet S, Desailly Y, Lenkei Z, Couture O and Tanter M, “Ultrafast ultrasound localization microscopy for deep super-resolution vascular imaging,” Nature 527(7579), 499 (2015). [DOI] [PubMed] [Google Scholar]
- [10].Ghosh D, Xiong F, Sirsi SR, Shaul PW, Mattrey RF and Hoyt K, “Toward optimization of in vivo super resolution ultrasound imaging using size selected microbubble contrast agents,” Medical Physics 44(12), 6304–6313 (2017). [DOI] [PMC free article] [PubMed] [Google Scholar]
- [11].Ghosh D, Peng J, Sirsi SR, Mineo C, Mattrey R, Shaul P and Hoyt K, “Super-resolution ultrasound imaging of the microvasculature in skeletal muscle: A new tool in diabetes research,” 2017 IEEE International Ultrasonics Symposium (IUS), 1–4 (2017). [Google Scholar]
- [12].Hoyt K, Warram JM, Umphrey H, Belt L, Lockhart ME, Robbin ML and Zinn KR, “Determination of Breast Cancer Response to Bevacizumab Therapy Using Contrast-Enhanced Ultrasound and Artificial Neural Networks,” Journal of Ultrasound in Medicine 29(4), 577–585 (2010). [DOI] [PMC free article] [PubMed] [Google Scholar]
- [13].Saini R and Hoyt K, “Recent developments in dynamic contrast-enhanced ultrasound imaging of tumor angiogenesis,” Imaging Med 6(1), 41–52 (2014). [DOI] [PMC free article] [PubMed] [Google Scholar]
- [14].Hoyt K, Umphrey H, Lockhart M, Robbin M and Forero-Torres A, “Ultrasound imaging of breast tumor perfusion and neovascular morphology,” Ultrasound Med Biol 41(9), 2292–2302 (2015). [DOI] [PMC free article] [PubMed] [Google Scholar]
- [15].Hoyt K, Sorace A and Saini R, “Quantitative Mapping of Tumor Vascularity Using Volumetric Contrast Enhanced Ultrasound,” Invest Radiol 47(3), 167–174 (2012). [DOI] [PMC free article] [PubMed] [Google Scholar]
- [16].Hoyt K, “Parametric imaging of tumor perfusion and neovascular morphology using ultrasound,” presented at SPIE Medical Imaging, 17 March 2015, Orlando, Florida, United States, 941911. [Google Scholar]
- [17].Glotzbach JP, Wong VW and Gurtner GC, “Neovascularization in diabetes,” Expert Review of Endocrinology & Metabolism 5(1), 99–111 (2010). [DOI] [PubMed] [Google Scholar]
- [18].Sirsi S and Borden M, “Microbubble Compositions, Properties and Biomedical Applications,” Bubble Sci Eng Technol 1(1–2), 3–17 (2009). [DOI] [PMC free article] [PubMed] [Google Scholar]
- [19].Demené C, Deffieux T, Pernot M, Osmanski BF, Biran V, Gennisson JL, Sieu LA, Bergel A, Franqui S, Correas JM, Cohen I, Baud O and Tanter M, “Spatiotemporal Clutter Filtering of Ultrafast Ultrasound Data Highly Increases Doppler and fUltrasound Sensitivity,” IEEE Transactions on Medical Imaging 34(11), 2271–2285 (2015). [DOI] [PubMed] [Google Scholar]
- [20].Hoyt K, “Parametric imaging of tumor perfusion and neovascular morphology using ultrasound,” Medical Imaging (2015). [DOI] [PMC free article] [PubMed] [Google Scholar]
- [21].Frangi AF, Niessen WJ, Vincken KL and Viergever MA, “Multiscale vessel enhancement filtering,” [Medical Image Computing and Computer-Assisted Intervention — MICCAI’98], Wells WM, Colchester A, and Delp S, Eds., Springer Berlin Heidelberg, Berlin, Heidelberg, 130–137 (1998). [Google Scholar]
- [22].OTSU N, “A Tlreshold Selection Method from Gray-Level Histograms,” 5. [Google Scholar]
- [23].Gonzalez RC, Woods RE and Masters BR, “Digital Image Processing, Third Edition,” Journal of Biomedical Optics 14(2), 029901 (2009). [Google Scholar]


