

Key Points
Question
What are risk factors for severe breakthrough SARS-CoV-2 infections among vaccinated individuals?
Findings
In this cohort study of 110 760 vaccinated US veterans, increasing age was most strongly associated with severe disease, with risk increasing steadily among patients older than 50 years. Immunocompromising conditions and comorbidities indicating chronic heart, lung, kidney, or neurologic damage also increased risk, with a magnitude similar to or less than a 10-year age increase.
Meaning
Identification of the risk factors for severe breakthrough COVID-19 could be used to guide policies and decision-making about preventive measures for those who remain at risk of disease progression despite vaccination.
This cohort study characterizes risk factors for severe COVID-19 disease in a vaccinated population.
Abstract
Importance
With a large proportion of the US adult population vaccinated against SARS-CoV-2, it is important to identify who remains at risk of severe infection despite vaccination.
Objective
To characterize risk factors for severe COVID-19 disease in a vaccinated population.
Design, Setting, and Participants
This nationwide, retrospective cohort study included US veterans who received a SARS-CoV-2 vaccination series and later developed laboratory-confirmed SARS-CoV-2 infection and were treated at US Department of Veterans Affairs (VA) hospitals. Data were collected from December 15, 2020, through February 28, 2022.
Exposures
Demographic characteristics, comorbidities, immunocompromised status, and vaccination-related variables.
Main Outcomes and Measures
Development of severe vs nonsevere SARS-CoV-2 infection. Severe disease was defined as hospitalization within 14 days of a positive SARS-CoV-2 diagnostic test and either blood oxygen level of less than 94%, receipt of supplemental oxygen or dexamethasone, mechanical ventilation, or death within 28 days. Association between severe disease and exposures was estimated using logistic regression models.
Results
Among 110 760 patients with infections following vaccination (97 614 [88.1%] men, mean [SD] age at vaccination, 60.8 [15.3] years; 26 953 [24.3%] Black, 11 259 [10.2%] Hispanic, and 71 665 [64.7%] White), 10 612 (9.6%) had severe COVID-19. The strongest association with risk of severe disease after vaccination was age, which increased among patients aged 50 years or older with an adjusted odds ratio (aOR) of 1.42 (CI, 1.40-1.44) per 5-year increase in age, such that patients aged 80 years or older had an aOR of 16.58 (CI, 13.49-20.37) relative to patients aged 45 to 50 years. Immunocompromising conditions, including receipt of different classes of immunosuppressive medications (eg, leukocyte inhibitor: aOR, 2.80; 95% CI, 2.39-3.28) or cytotoxic chemotherapy (aOR, 2.71; CI, 2.27-3.24) prior to breakthrough infection, or leukemias or lymphomas (aOR, 1.87; CI, 1.61-2.17) and chronic conditions associated with end-organ disease, such as heart failure (aOR, 1.74; CI, 1.61-1.88), dementia (aOR, 2.01; CI, 1.83-2.20), and chronic kidney disease (aOR, 1.59; CI, 1.49-1.69), were also associated with increased risk. Receipt of an additional (ie, booster) dose of vaccine was associated with reduced odds of severe disease (aOR, 0.50; CI, 0.44-0.57).
Conclusions and Relevance
In this nationwide, retrospective cohort of predominantly male US Veterans, we identified risk factors associated with severe disease despite vaccination. Findings could be used to inform outreach efforts for booster vaccinations and to inform clinical decision-making about patients most likely to benefit from preexposure prophylaxis and antiviral therapy.
Introduction
The 2-dose mRNA vaccine series BNT162b2 (Pfizer/BioNTech) and mRNA-1273 (Moderna) and the adenoviral vaccine Ad26.COV2.S (Johnson & Johnson) are effective for reducing risk of severe COVID-19 disease and death. So-called breakthrough infections in vaccinated persons have been observed since mid-2021 and continued to increase following Omicron predominance. Substantial protection against severe outcomes following vaccination and boosting is maintained for most of the population1,2,3; however, some patients remain at risk of severe infections following vaccination, leading to hospitalizations for COVID-19 management and death.
Identifying patients who remain at risk for severe disease despite vaccination can help inform efforts to promote booster vaccination and guide distribution of antiviral drugs for early treatment or preexposure prophylaxis. Thus, the primary aim of this national, retrospective cohort study was to identify risk factors associated with severe disease among vaccinated US veterans who developed infections following vaccination. Secondary aims were to identify and quantify risk factors in subgroups that may have different risk profiles (stratifying by immunocompromised status, age, sex, and periods with Delta or Omicron variant predominance) and to evaluate whether associations with reductions in disease severity waned over time since the primary vaccination series and a single booster dose.
Methods
This article follows the Strengthening the Reporting of Observational Studies in Epidemiology (STROBE) reporting guideline (eMethods in the Supplement). This study was approved by the VA Boston Research and Development committee as an exempt study prior to data collection and analysis with a waiver of informed consent due to the use of existing data, per the Common Rule.
Cohort Creation
The cohort consisted of all patients who received a complete initial vaccination series (2 doses of an mRNA vaccine or 1 dose of Ad26.COV2.S) before December 1, 2021, and subsequently tested positive for SARS-CoV-2 infection (polymerase chain reaction or antigen) within the Veterans Affairs Healthcare System (VA) through February 28, 2022. The study period was December 15, 2020, to February 28, 2022, which includes intervals during which the original strain, Delta variant (July 1 to December 15, 2021), and Omicron variant (December 16, 2021, to February 8, 2022) were predominant. Full methods are outlined in eMethods in the Supplement.
Data Sources and Uses
Data were obtained from the VA COVID-19 shared data resource4 and the Corporate Data Warehouse (CDW). eTable 1 in the Supplement presents a complete listing of definitions and data sources.
The primary outcome was severe breakthrough infection, defined by death 2 to 28 days after a positive test or medical or surgical hospitalization within 14 days of the positive test with documented blood oxygen level of less than 94%, receipt of any supplemental oxygen, receipt of dexamethasone,5,6 or receipt of mechanical ventilation. The comparator was nonsevere breakthrough infection, defined as no hospitalization or hospitalization that did not meet criteria for severe disease.
Demographic data included age in years at the time of breakthrough infection (modeled in 5-year increments), biologic sex, race (VA-standard categories for voluntary self-reporting as American Indian or Alaska Native, Asian, Black or African American, Native Hawaiian or other Pacific Islander, or White) and ethnicity (Hispanic or Latino, yes or no), US region, and urban or rural residence defined by US Census criteria. Vaccination data included dates of each vaccination dose and the vaccine manufacturer. Occurrence of a previous SARS-CoV-2 infection before vaccination was defined as a positive test any time before day 14 after completing the initial vaccination series.
Comorbidities recorded in the patients’ records at the time of infection were assessed using the Chronic Conditions Warehouse during the 3 years prior to vaccination.7 Body mass index (BMI) was calculated as weight in kilograms divided by height in meters squared, with US averages used to estimate height if the variable was not available in the electronic health record.
Definitions of Immunocompromised Status
Drugs known to increase risk of infectious diseases were classified into 5 categories: cytotoxic chemotherapy, glucocorticoids (prednisone or methylprednisolone), cytokine-blocking drugs (eg, anti–tumor necrosis factor, anti–interleukin 6 receptor, anti–interleukin 17), leukocyte-inhibiting drugs (eg, methotrexate, azathioprine, JAK inhibitors, abatacept), and lymphocyte-depleting drugs (eg, rituximab). Receipt of immunosuppressive drugs was assessed shortly before vaccination and after vaccination but shortly before breakthrough infection. Different time intervals were used for different drug classes and based on their expected duration of impact. eTable 2 in the Supplement includes details of classifications and definitions. The immunocompromised subcohort also included patients with leukemia or lymphoma but not patients with HIV, based on results of the univariate analysis.
Time Since Vaccination
Interpreting time since vaccination as a risk factor for severe disease may be challenging because of high potential for residual confounding and effect modification due to earlier availability of vaccines for patients with higher risk, differential use and timing of boosting, and development of the Delta and then the Omicron variants. Thus, in addition to assessing risk of severe breakthrough infection as a function of time since initial vaccination and time since boosting, time since vaccination was also assessed among patients who did not receive boosters.
Statistical Analysis
The primary analysis evaluated exposures associated with the development of severe vs nonsevere SARS-CoV-2 infection despite vaccination. Secondary stratified analyses were conducted on subcohorts (Figure 1) to further explore the associations of an immunocompromised state, age, and time since vaccination with severe vs nonsevere breakthrough infection.
Figure 1. Cohorts and Subcohorts Included in the Study, With Results for Total Breakthrough Infections, Severe Breakthrough Infections, and Deaths 2 to 28 Days After Diagnosis of Infection.
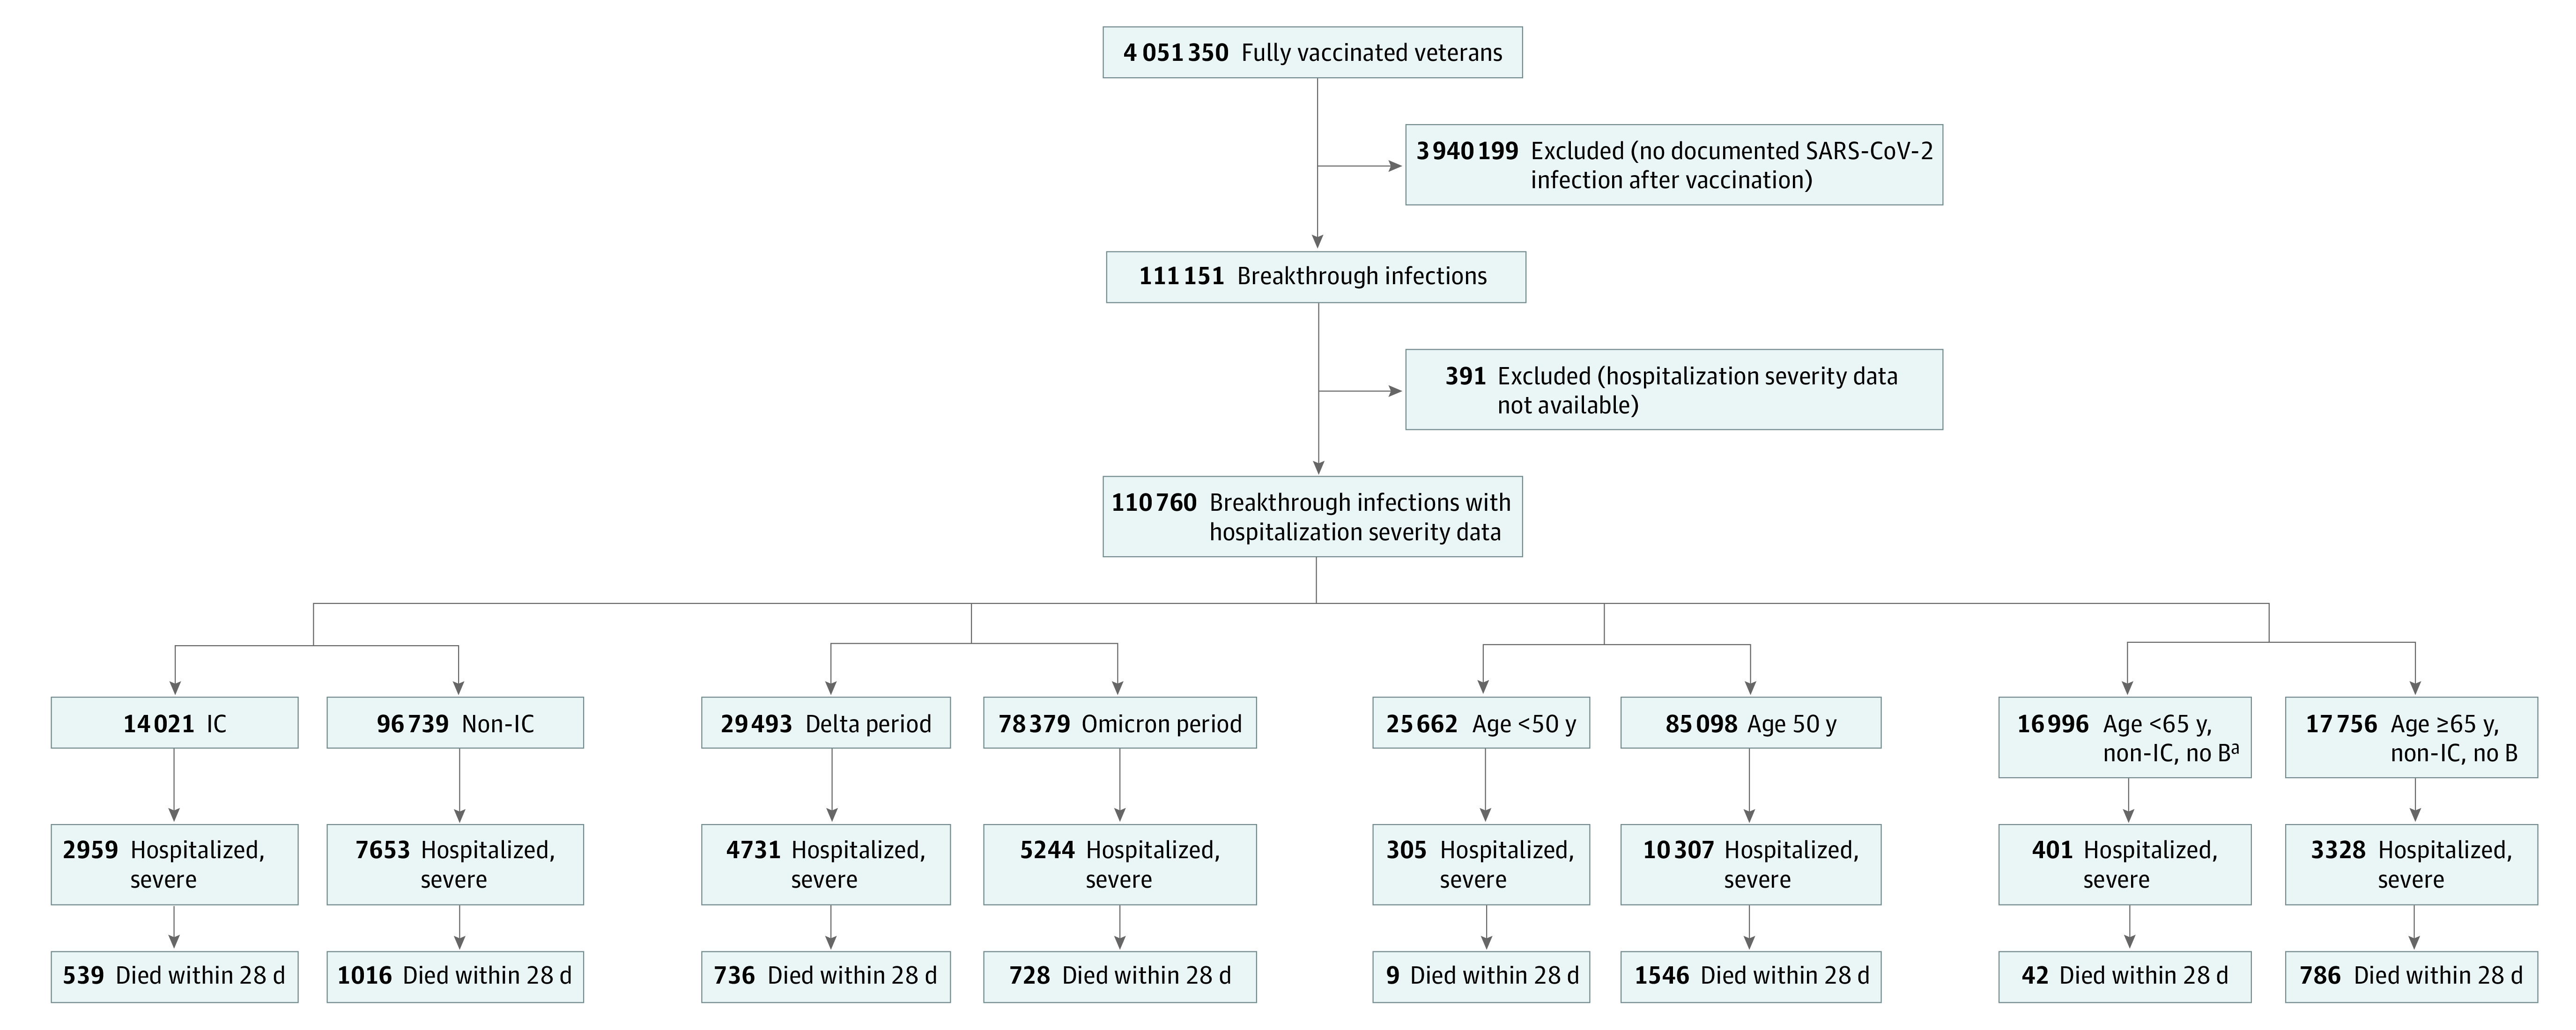
The Methods section and eMethods in the Supplement include the definition of immunocompromised (IC) status, time periods for Delta and Omicron periods, and time periods for US Food and Drug Administration approval of vaccination for the general adult population.
aIn addition to no booster (B), started initial vaccination on or after recommendation for all US adults (March 29, 2021).
Multivariable logistic regression was used to assess the association of the binary outcome (severe vs nonsevere breakthrough SARS-CoV-2 infection) with the set of independent variables incorporating demographic characteristics, vaccination status, immunocompromised states, and comorbidities, as described previously. Variables determined a priori to be of interest and those with adjusted odds ratios (aOR) of 1.50 or greater or 0.67 or less and statistical significance are presented in the main results; cutoffs were selected based on our goal of identifying associations of potential and likely clinical significance.8,9 Results that include all variables are provided in supplementary tables. Findings were considered statistically significant at a 2-tailed P < .05 after adjustment for multiple comparisons using the Benjamini-Hochberg method. All analyses were conducted with R version 4.0.2 (R Project for Statistical Computing).
Results
Description of Full Cohort
From December 15, 2020, to February 28, 2022, 111 151 patients had a SARS-CoV-2 infection following vaccination, with severity assessments available for 110 760 (97 614 [88.1%] male, mean [SD] age at vaccination, 60.8 [15.4] years, 26 953 [24.3%] Black, 11 259 [10.2%] Hispanic, and 71 665 [64.7%] White, evenly distributed throughout US regions). Data for all variables that were analyzed are in eTable 3 in the Supplement. Table 1 includes data for variables meeting predefined cutoffs and others of particular clinical interest. eTable 4 in the Supplement shows additional categorical separation of severities.
Table 1. Demographic, Clinical, and Vaccination-Related Data for Patients With Severe and Nonsevere COVID-19 Despite Vaccination.
| Characteristic | Patients, No. (%) | aOR (95% CI)a | ||
|---|---|---|---|---|
| Overall (N = 110 760) | Nonsevere (n = 100 148) | Severe (n = 10 612) | ||
| Sex | ||||
| Male | 97 614 (88.1) | 87 389 (87.3) | 10 225 (96.4) | 1 [Reference] |
| Female | 13 146 (11.9) | 22 759 (22.7) | 387 (3.6) | 0.67 (0.60-0.75) |
| Age ranges, y | ||||
| <40 | 13 114 (11.8) | 13 004 (13.0) | 110 (1.0) | 0.57 (0.44-0.75) |
| 40-44 | 6241 (5.6) | 6153 (6.1) | 88 (0.8) | 0.88 (0.66-1.18) |
| 45-49 | 6307 (5.7) | 6200 (6.2) | 107 (1.0) | 1 [Reference] |
| 50-54 | 9721 (8.8) | 9444 (9.4) | 277 (2.6) | 1.60 (1.27-2.01) |
| 55-59 | 10 934 (9.9) | 10 458 (10.4) | 476 (4.5) | 2.24 (1.80-2.78) |
| 60-64 | 12 971 (11.7) | 12 082 (12.1) | 889 (8.4) | 3.24 (2.64-3.99) |
| 65-69 | 12 353 (11.2) | 11 013 (11.0) | 1340 (12.6) | 4.82 (3.93-5.92) |
| 70-74 | 18 327 (16.5) | 15 703 (15.7) | 2624 (24.7) | 6.63 (5.42-8.11) |
| 75-79 | 11 562 (10.4) | 9546 (9.5) | 2016 (19.0) | 8.72 (7.10-10.7) |
| ≥80 | 9230 (8.3) | 6545 (6.5) | 2685 (25.3) | 16.58 (13.49-20.37) |
| Dominant variant | ||||
| Pre-Delta period | 2888 (2.6) | 2251 (2.2) | 637 (6.0) | 1 [Reference] |
| Delta period | 29 493 (26.6) | 24 762 (24.7) | 4731 (44.6) | 0.95 (0.83-1.08) |
| Omicron period | 78 379 (70.8) | 73 135 (73.0) | 5244 (49.4) | 0.49 (0.42-0.56) |
| Vaccine type | ||||
| Ad26.COV2.S | 11 066 (10.0) | 10 028 (10.0) | 1038 (9.8) | 1.30 (1.20-1.41) |
| mRNA-1273 | 45 530 (41.1) | 41 289 (41.2) | 4241 (40.0) | 0.79 (0.75-0.83) |
| BNT162b2 | 54 164 (48.9) | 48 831 (48.8) | 5333 (50.3) | 1 [Reference] |
| History of infection before vaccinated | 4373 (3.9) | 3959 (4.0) | 414 (3.9) | 0.69 (0.61-0.78) |
| Time since fully vaccinated at breakthrough, mo | ||||
| <4 | 12 497 (11.3) | 10 983 (11.0) | 1514 (14.3) | 1 [Reference] |
| 4 to <5 | 7216 (6.5) | 6355 (6.3) | 861 (8.1) | 1.06 (0.95-1.18) |
| 5 to <6 | 8148 (7.4) | 7039 (7.0) | 1109 (10.5) | 1.01 (0.91-1.12) |
| 6 to <7 | 8902 (8.0) | 7763 (7.8) | 1139 (10.7) | 1.08 (0.97-1.20) |
| 7 to <8 | 11 739 (10.6) | 10 665 (10.6) | 1074 (10.1) | 1.13 (1.02-1.26) |
| 8 to <9 | 19 118 (17.3) | 17 873 (17.8) | 1245 (11.7) | 1.15 (1.03-1.28) |
| 9 to <10 | 19 997 (18.1) | 18 570 (18.5) | 1427 (13.4) | 1.16 (1.03-1.30) |
| 10 to <11 | 15 731 (14.2) | 14 252 (14.2) | 1479 (13.9) | 1.34 (1.19-1.51) |
| 11 to <12 | 6519 (5.9) | 5853 (5.8) | 666 (6.3) | 1.47 (1.28-1.69) |
| ≥12 | 893 (0.8) | 795 (0.8) | 98 (0.9) | 1.57 (1.22-2.04) |
| Times since booster at breakthrough, mo | ||||
| Not boosted | 81 039 (73.2) | 72 483 (72.4) | 8556 (80.6) | 1 [Reference] |
| <1 | 5755 (5.2) | 5401 (5.4) | 354 (3.3) | 0.56 (0.49-0.63) |
| 1 to <2 | 7732 (7.0) | 7341 (7.3) | 391 (3.7) | 0.43 (0.38-0.48) |
| 2 to <3 | 8550 (7.7) | 7996 (8.0) | 554 (5.2) | 0.46 (0.41-0.51) |
| 3 to <4 | 4633 (4.2) | 4197 (4.2) | 436 (4.1) | 0.54 (0.48-0.61) |
| 4 to <5 | 1749 (1.6) | 1543 (1.5) | 206 (1.9) | 0.59 (0.50-0.70) |
| 5 to <6 | 370 (0.3) | 320 (0.3) | 50 (0.5) | 0.68 (0.48-0.95) |
| ≥6 | 932 (0.8) | 867 (0.9) | 65 (0.6) | 0.78 (0.59-1.03) |
| IS medications before breakthrough | ||||
| Chemotherapy | 1006 (0.9) | 696 (0.7) | 310 (2.9) | 2.71 (2.27-3.24) |
| Cytokine-blocking | 1601 (1.4) | 1401 (1.4) | 200 (1.9) | 1.66 (1.32-2.09) |
| Glucocorticoids | 7544 (6.8) | 5723 (5.7) | 1821 (17.2) | 2.34 (2.18-2.50) |
| Leukocyte-inhibitory | 1924 (1.7) | 1438 (1.4) | 486 (4.6) | 2.80 (2.39-3.28) |
| Lymphocyte-depleting | 585 (0.5) | 406 (0.4) | 179 (1.7) | 2.07 (1.57-2.72) |
| IS medications before initial vaccination | ||||
| Chemotherapy | 430 (0.4) | 316 (0.3) | 114 (1.1) | 0.86 (0.65-1.15) |
| Cytokine-blocking | 1211 (1.1) | 1096 (1.1) | 115 (1.1) | 0.60 (0.45-0.80) |
| Glucocorticoids | 2754 (2.5) | 2124 (2.1) | 630 (5.9) | 1.38 (1.23-1.54) |
| Leukocyte-inhibitory | 1368 (1.2) | 1099 (1.1) | 269 (2.5) | 0.80 (0.65-0.98) |
| Lymphocyte-depleting | 223 (0.2) | 153 (0.2) | 70 (0.7) | 1.07 (0.69-1.65) |
| BMI class | ||||
| Underweight, <18.5 | 677 (0.6) | 496 (0.5) | 181 (1.7) | 1.53 (1.24-1.87) |
| Normal, 18 to <25 | 14 394 (13.0) | 12 299 (12.3) | 2095 (19.7) | 1 [Reference] |
| Overweight, 25 to <30 | 32 707 (29.5) | 29 792 (29.7) | 2915 (27.5) | 0.71 (0.67-0.76) |
| Obesity I, 30 to <35 | 31 156 (28.1) | 28 557 (28.5) | 2599 (24.5) | 0.78 (0.73-0.84) |
| Obesity II, 35 to <40 | 16 862 (15.2) | 15 335 (15.3) | 1527 (14.4) | 0.94 (0.87-1.02) |
| Severe obesity, ≥40 | 10 641 (9.6) | 9510 (9.5) | 1131 (10.7) | 1.23 (1.12-1.35) |
| Unknown | 4323 (3.9) | 4159 (4.2) | 164 (1.5) | 0.88 (0.74-1.06) |
| Comorbidities | ||||
| Alzheimers disease and related disorders or senile dementia | 3050 (2.8) | 1915 (1.9) | 1135 (10.7) | 2.01 (1.83-2.20) |
| Chronic kidney disease | 11 832 (10.7) | 9071 (9.1) | 2761 (26.0) | 1.59 (1.49-1.69) |
| COPD and bronchiectasis | 8337 (7.5) | 6103 (6.1) | 2234 (21.1) | 1.65 (1.54-1.76) |
| Diabetes | 26 083 (23.5) | 21 919 (21.9) | 4164 (39.2) | 1.25 (1.19-1.32) |
| Heart failure | 5444 (4.9) | 3681 (3.7) | 1763 (16.6) | 1.74 (1.61-1.88) |
| HIV or AIDS | 874 (0.8) | 791 (0.8) | 83 (0.8) | 1.30 (1.01-1.68) |
| Leukemias and lymphomas | 1336 (1.2) | 993 (1.0) | 343 (3.2) | 1.87 (1.61-2.17) |
| Lung cancer | 824 (0.7) | 573 (0.6) | 251 (2.4) | 1.61 (1.36-1.92) |
| Mobility impairments | 1030 (0.9) | 728 (0.7) | 302 (2.8) | 1.92 (1.63-2.26) |
| Multiple sclerosis and transverse myelitis | 454 (0.4) | 362 (0.4) | 92 (0.9) | 2.86 (2.17-3.78) |
| Pressure and chronic ulcers | 1347 (1.2) | 872 (0.9) | 475 (4.5) | 1.58 (1.37-1.81) |
| Schizophrenia and other psychotic disorders | 2755 (2.5) | 2320 (2.3) | 435 (4.1) | 1.71 (1.51-1.93) |
Abbreviations: aOR, adjusted odds ratio; BMI, body mass index class (calculated as weight in kilograms divided by height in meters squared); COPD, chronic obstructive pulmonary disease; IS, immune-suppressive.
Results of multivariable logistic regression are also shown. Results for all variables used in the multivariable analysis are shown in eTable 3 in the Supplement.
Overall, 29 493 breakthrough infections (26.6%) occurred during the Delta period (July 1 to December 15, 2021) and 78 379 (70.8%) during the Omicron period (December 16, 2021, to February 28, 2022), 4373 patients (3.9%) had evidence of prior SARS-CoV-2 infection before vaccination, and 29 721 (26.8%) were boosted prior to breakthrough infection. The 110 760 breakthrough infections were associated with 10 612 severe cases (9.6%) and 1555 deaths (1.4%). In the Delta period, 4731 cases (16.0%) were severe and 736 (2.5%) were associated with death, compared with 5244 (6.7%) and 728 (0.9%) during the Omicron period.
Full Cohort Analysis
Multivariable-adjusted estimates of associations with severe disease are presented in Table 1 and Figure 2. eTable 3 in the Supplement includes all variables, regardless of magnitude of effect size, and results of univariable and multivariable logistic regressions. The variable with the strongest association with severe COVID-19 outcomes was age; risk rose steadily at least above age 50 years (aOR per 5-year increase, 1.42; 95% CI, 1.40-1.44), such that the aOR was 16.58 (CI, 13.49-20.37) for patients aged 80 years or older compared with patients aged 45 to 50 years. Associations with severe disease were somewhat higher among Native American than White patients (aOR, 1.33; 95% CI, 1.04-1.71). Female sex was associated with lower odds of severe outcomes than male sex (aOR, 0.67; 95% CI, 0.60-0.75). Compared with receipt of the BNTb162b2 vaccine, receipt of the mRNA-1273 vaccine was associated with lower odds of severe disease (aOR, 0.79; 95% CI, 0.75-0.83). Receipt of 1 dose of Ad26.COV2.S was associated with higher odds (aOR, 1.30; 95% CI, 1.20-1.41).
Figure 2. Risk of Severe vs Nonsevere Breakthrough Infection.

All variables that met significance criteria (P < .05 after adjustment for multiple comparisons, and adjusted odds ratio [aOR] ≥1.50 or ≤0.67) and selected additional variables (eg, diabetes and HIV infection) chosen a priori for comparison.
Comorbidities in many different organ systems (cardiac, pulmonary, renal, and neurologic/psychiatric) were associated with a similar magnitude of increased odds (aORs between 1.59 and 2.86 for the 8 highest-risk conditions). Comorbidities that reflected permanent organ damage (eg, heart failure [aOR, 1.74; CI, 1.61-1.88], chronic obstructive pulmonary disease [COPD; aOR, 1.65; 95% CI, 1.54-1.76], chronic kidney disease [aOR, 1.59; CI, 1.49-1.69], dementia [aOR, 2.01; CI, 1.83-2.20]) were associated with greater magnitudes of increased risk of disease than predisposing conditions, such as diabetes and hypertension.
Patients Younger Than 50 Years
In the subcohort limited to patients younger than 50 years, overall risk of severe disease was low (305 of 25 662 patients [1.2%]), and death was rare (9 patients [0.04%]). The low number of severe cases in this group limits interpretability; however, a small set of severe chronic health problems met criteria for statistical significance (eTable 5 and eAppendix in the Supplement).
Immunocompromised Cohort
Overall, 14 021 patients with breakthrough infections met criteria for being immunocompromised at the time of vaccination or breakthrough. HIV infection was not included due to a nonsignificant and modest-magnitude association with severe breakthrough COVID-19. Demographic and clinical data for the immunocompromised cohort, stratified by severity, are shown in Table 2 and eTable 6 in the Supplement. Immunocompromised patients who developed breakthrough infections had higher absolute unadjusted risk of severe disease (2959 [21.1%]) or death (539 [3.8%]) than patients without immunocompromising conditions or medications (7653 [7.9%] and 1016 [1.1%], respectively, of 96 739). Rates of severe disease and death among immunocompromised patients were 1276 of 4422 (28.9%) and 250 (5.7%), respectively, in the Delta period and 1481 of 9098 (16.3%) and 245 (2.7%), respectively, in the Omicron period. Additional risk factors for severe disease among immunocompromised patients (eg, age and specific comorbidities) were very similar to those for the whole population (Table 2; eTable 6 in the Supplement).
Table 2. Demographic, Clinical, and Vaccination-Related Data, and Results of Multivariable Logistic Regression for Immunocompromised Patients With Severe and Non-Severe COVID-19 Despite Vaccination.
| Characteristic | Patients, No. (%) | aOR (95% CI)a | ||
|---|---|---|---|---|
| Overall (n = 14 021) | Nonsevere infection (n = 11 062) | Severe infection (n = 2959) | ||
| Sex | ||||
| Male | 12 505 (89.2) | 9653 (87.3) | 2852 (96.4) | 1 [Reference] |
| Female | 1516 (10.8) | 1409 (12.7) | 107 (3.6) | 0.59 (0.47-0.74) |
| Age range, y | ||||
| <40 | 848 (6.0) | 829 (7.5) | 19 (0.6) | 0.69 (0.37-1.29) |
| 40-44 | 524 (3.7) | 506 (4.6) | 18 (0.6) | 0.98 (0.52-1.86) |
| 45-49 | 636 (4.5) | 613 (5.5) | 23 (0.8) | 1 [Reference] |
| 50-54 | 1004 (7.2) | 925 (8.4) | 79 (2.7) | 2.06 (1.27-3.36) |
| 55-59 | 1228 (8.8) | 1093 (9.9) | 135 (4.6) | 2.52 (1.58-4.02) |
| 60-64 | 1733 (12.4) | 1467 (13.3) | 266 (9.0) | 3.51 (2.24-5.51) |
| 65-69 | 1874 (13.4) | 1452 (13.1) | 422 (14.3) | 5.01 (3.21-7.83) |
| 70-74 | 2955 (21.1) | 2122 (19.2) | 833 (28.2) | 6.79 (4.37-10.6) |
| 75-79 | 1841 (13.1) | 1274 (11.5) | 567 (19.2) | 7.71 (4.93-12.1) |
| ≥80 | 1378 (9.8) | 781 (7.1) | 597 (20.2) | 12.66 (8.04-19.93) |
| Dominant variant | ||||
| Pre-Delta period | 501 (3.6) | 299 (2.7) | 202 (6.8) | 1 [Reference] |
| Delta period | 4422 (31.5) | 3146 (28.4) | 1276 (43.1) | 0.74 (0.57-0.96) |
| Omicron period | 9098 (64.9) | 7617 (68.9) | 1481 (50.1) | 0.44 (0.33-0.58) |
| Vaccine type | ||||
| Ad26.COV2.S | 1172 (8.4) | 940 (8.5) | 232 (7.8) | 1.11 (0.93-1.33) |
| mRNA-1273 | 6098 (43.5) | 4860 (43.9) | 1238 (41.8) | 0.78 (0.71-0.86) |
| BNT162b2 | 6751 (48.1) | 5262 (47.6) | 1489 (50.3) | 1 [Reference] |
| History of infection before vaccinated | 636 (4.5) | 515 (4.7) | 121 (4.1) | 0.61 (0.48-0.78) |
| Time since fully vaccinated at breakthrough, mo | ||||
| <4 | 1672 (11.9) | 1225 (11.1) | 447 (15.1) | 1 [Reference] |
| 4 to <5 | 975 (7.0) | 743 (6.7) | 232 (7.8) | 1.09 (0.86-1.37) |
| 5 to <6 | 1159 (8.3) | 831 (7.5) | 328 (11.1) | 1.14 (0.91-1.41) |
| 6 to <7 | 1140 (8.1) | 845 (7.6) | 295 (10.0) | 1.04 (0.83-1.30) |
| 7 to <8 | 1336 (9.5) | 1083 (9.8) | 253 (8.6) | 0.93 (0.74-1.17) |
| 8 to <9 | 2069 (14.8) | 1759 (15.9) | 310 (10.5) | 0.99 (0.79-1.24) |
| 9 to <10 | 2488 (17.7) | 2070 (18.7) | 418 (14.1) | 1.13 (0.90-1.42) |
| 10 to <11 | 2160 (15.4) | 1709 (15.4) | 451 (15.2) | 1.33 (1.04-1.70) |
| 11 to <12 | 915 (6.5) | 710 (6.4) | 205 (6.9) | 1.39 (1.05-1.85) |
| ≥12 | 107 (0.8) | 87 (0.8) | 20 (0.7) | 0.94 (0.53-1.68) |
| Time since boosted at breakthrough, mo | ||||
| Not boosted | 9408 (67.1) | 7234 (65.4) | 2174 (73.5) | 1 [Reference] |
| 1 or less | 663 (4.7) | 541 (4.9) | 122 (4.1) | 0.78 (0.62-0.99) |
| 1 to <2 | 878 (6.3) | 734 (6.6) | 144 (4.9) | 0.63 (0.51-0.78) |
| 2 to <3 | 1107 (7.9) | 903 (8.2) | 204 (6.9) | 0.69 (0.57-0.83) |
| 3 to <4 | 1040 (7.4) | 883 (8.0) | 157 (5.3) | 0.51 (0.41-0.63) |
| 4 to <5 | 670 (4.8) | 563 (5.1) | 107 (3.6) | 0.54 (0.42-0.70) |
| 5 to <6 | 141 (1.0) | 109 (1.0) | 32 (1.1) | 0.78 (0.49-1.23) |
| ≥6 | 114 (0.8) | 95 (0.9) | 19 (0.6) | 0.81 (0.47-1.41) |
| IS medications before breakthrough | ||||
| Chemotherapy | 1006 (7.2) | 696 (6.3) | 310 (10.5) | 2.21 (1.83-2.67) |
| Cytokine-blocking | 1601 (11.4) | 1401 (12.7) | 200 (6.8) | 1.41 (1.12-1.78) |
| Glucocorticoids | 7544 (53.8) | 5723 (51.7) | 1821 (61.5) | 1.91 (1.70-2.14) |
| Leukocyte-inhibitory | 1924 (13.7) | 1438 (13.0) | 486 (16.4) | 2.42 (2.05-2.85) |
| Lymphocyte-depleting | 585 (4.2) | 406 (3.7) | 179 (6.0) | 1.94 (1.47-2.54) |
| IS medications before initial vaccination | ||||
| Chemotherapy | 430 (3.1) | 316 (2.9) | 114 (3.9) | 0.87 (0.66-1.15) |
| Cytokine-blocking | 1211 (8.6) | 1096 (9.9) | 115 (3.9) | 0.59 (0.45-0.79) |
| Glucocorticoids | 2754 (19.6) | 2124 (19.2) | 630 (21.3) | 1.22 (1.08-1.38) |
| Leukocyte-inhibitory | 1368 (9.8) | 1099 (9.9) | 269 (9.1) | 0.78 (0.64-0.95) |
| Lymphocyte-depleting | 223 (1.6) | 153 (1.4) | 70 (2.4) | 1.12 (0.73-1.70) |
| BMI class | ||||
| Underweight | 119 (0.8) | 60 (0.5) | 59 (2.0) | 1.67 (1.11-2.53) |
| Normal | 1994 (14.2) | 1372 (12.4) | 622 (21.0) | 1 [Reference] |
| Overweight | 4085 (29.1) | 3271 (29.6) | 814 (27.5) | 0.65 (0.57-0.75) |
| Obesity I | 3883 (27.7) | 3155 (28.5) | 728 (24.6) | 0.69 (0.60-0.80) |
| Obesity II | 2204 (15.7) | 1798 (16.3) | 406 (13.7) | 0.76 (0.64-0.90) |
| Severe obesity | 1568 (11.2) | 1252 (11.3) | 316 (10.7) | 0.93 (0.77-1.12) |
| Unknown | 168 (1.2) | 154 (1.4) | 14 (0.5) | 0.55 (0.30-1.01) |
| Comorbidities | ||||
| Alzheimers disease and related disorders or senile dementia | 450 (3.2) | 228 (2.1) | 222 (7.5) | 1.51 (1.21-1.88) |
| Chronic kidney disease | 2285 (16.3) | 1441 (13.0) | 844 (28.5) | 1.57 (1.38-1.78) |
| COPD and bronchiectasis | 2489 (17.8) | 1539 (13.9) | 950 (32.1) | 1.71 (1.52-1.92) |
| Diabetes | 3931 (28.0) | 2800 (25.3) | 1131 (38.2) | 1.22 (1.10-1.36) |
| Heart failure | 1205 (8.6) | 675 (6.1) | 530 (17.9) | 1.51 (1.29-1.77) |
| HIV and/or AIDS | 103 (0.7) | 83 (0.8) | 20 (0.7) | 0.98 (0.56-1.70) |
| Leukemias and lymphomas | 1336 (9.5) | 993 (9.0) | 343 (11.6) | 1.58 (1.33-1.88) |
| Lung cancer | 289 (2.1) | 173 (1.6) | 116 (3.9) | 1.38 (1.05-1.80) |
| Mobility impairments | 166 (1.2) | 94 (0.8) | 72 (2.4) | 1.73 (1.20-2.51) |
| Multiple sclerosis and transverse myelitis | 207 (1.5) | 166 (1.5) | 41 (1.4) | 2.02 (1.31-3.11) |
| Pressure and chronic ulcers | 235 (1.7) | 117 (1.1) | 118 (4.0) | 1.68 (1.24-2.29) |
| Schizophrenia and other psychotic disorders | 327 (2.3) | 236 (2.1) | 91 (3.1) | 1.41 (1.06-1.88) |
Abbreviations: aOR, adjusted odds ratio; BMI, body mass index (calculated as weight in kilograms divided by height in meters squared); COPD, chronic obstructive pulmonary disease; IS, immune-suppressive.
Results for all variables used in the analysis are shown in eTable 6 in the Supplement.
No specific class of immunosuppressive drugs was clearly associated with a higher magnitude of increased odds, but leukocyte inhibitor before breakthrough infection conferred more risk than the drug class with lowest risk (leukocyte inhibitor: aOR, 2.80; 95% CI, 2.39-3.28; cytokine blocking: aOR, 1.66; 95% CI, 1.32-2.09). In multivariable analyses, receipt of immunosuppressive drugs after vaccination (before breakthrough) was associated with severe COVID-19, whereas magnitude of risk associated with receipt before vaccination was much lower (Tables 1 and 2; eTables 3 and 6 in the Supplement); among 1950 patients receiving immunosuppressive drugs only prior to initial vaccination, 263 (13.5%) had severe disease, in contrast to 1767 of 7896 patients (22.4%) immunosuppressed only at the time of the breakthrough infection, and 730 of 3264 patients (22.4%) immunosuppressed both before and after vaccination (eTable 7 in the Supplement). Overall, 1053 of 14 021 immunocompromised patients (7.5%) were receiving at least 2 different classes of immunosuppressive drugs between vaccination and breakthrough. When compared with those receiving only 1 immunosuppressive drug class, receipt of multiple immunosuppressive drugs was associated with higher odds of severe disease (2 drugs: aOR, 1.92; 95% CI, 1.64-2.26; 3 drugs: aOR, 2.53; 95% CI, 1.69-3.80) (eTable 8 in the Supplement).
Time Since Vaccination or Booster
Boosting was associated with a decreased risk of severe breakthrough in the main analysis (aOR, 0.50; 95% CI, 0.44-0.57) and in all subsets, as was prior SARS-CoV-2 infection (aOR, 0.69; 95% CI, 0.61-0.78). In the unstratified full-cohort analysis, time since vaccination and time since booster appeared to be associated with small but steady increases in risk of severe disease, suggesting waning vaccine effectiveness (Table 1; eTable 3 in the Supplement), but these findings varied among subsets (Figure 3; eTables 5, 6, 9 and 10 in the Supplement). However, when interpretability was improved by stratification by boosting status and indication for early vaccination, decreasing effectiveness was not observed, neither in patients younger or older than 65 years nor in immunocompromised patients (Figure 3; eTables 6, 11, and 12 in the Supplement), suggesting residual confounding in the full-cohort analysis.
Figure 3. Risk of Severe vs Nonsevere Breakthrough Infection as a Function of Time Since Vaccination in Subcohorts Defined by Age, Vaccine Eligibility, and Immunocompromise.

The focus of the plots is on time since initial vaccination, but results are derived from multivariable logistic regression. aOR indicates adjusted odds ratio.
Analyses of Additional Subsets
Female patients were younger (eFigure in the Supplement) and had lower incidence of severe breakthrough infection, even after adjusting for age (Table 1; eTable 3 in the Supplement). In an analysis limited to female patients, risk factors were similar to those in male patients (eTables 13-15 in the Supplement). Similarly, risk factors for severe disease were similar during the Delta and Omicron periods (eTables 16-18 in the Supplement) and did not appear to differ based on whether patients initially received the BNT162b2 or mRNA-1273 vaccine (eTables 19 and 20 in the Supplement) or resided in urban vs rural locations (eTables 21 and 22 and eAppendix in the Supplement).
Discussion
This nationwide retrospective cohort study of US veteran patients with documented SARS-CoV-2 infection after vaccination identified clinical and demographic variables associated with risk of severe disease, defined as either death within 28 days or hospitalization with evidence of respiratory failure or hypoxemia. We took a high-altitude approach to a broad range of possible risk factors in a large population, rather than attempting to dissect the details of individual comorbidities, immunocompromised states, or factors specific to vaccine products and variants. Risk was reduced among booster vaccine recipients and those with a history of infection before vaccination and was lower during the Omicron period. Increasing age had the most substantial association with risk, which increased steadily at least among patients older than 50 years, but a large number of comorbidities remained associated with risk of severe disease in the adjusted model. In light of high rates of vaccination and prior infection, research on these details in breakthrough infection and reinfection, focused on severity and sequelae, has the most potential to inform clinical practice through risk-stratification of individual patients.10 Recent data suggest that low-risk vaccinated patients receive little or no benefit from antiviral therapies, and thus improving identification of patients at high risk for progression is important for informing clinical practice and directing distribution of antivirals to those most likely to benefit.11
Immunization during periods of immunocompromise has been theorized to negatively affect vaccine response rates and predispose to risk of infection and severe outcomes. In this large cohort, an immunocompromised state conferred increased risk of severe outcomes; the association between the immunosuppressive drugs and risk was stronger if present after vaccination (ie, producing an immunocompromised state at the time of exposure and subsequent infection) than if present only prior to vaccination. These data suggest that many patients receiving immunosuppressive medications at the time of vaccine develop durable protection, and the causal risk factor is immune status at the time of exposure.
The comorbidities most strongly associated with odds of severe disease include those identified early in the pandemic as the key risk factors for severe disease before vaccines were available.12,13,14 Comorbidities indicating preexisting organ disease (eg, heart failure, chronic kidney disease, COPD, dementia) or a globally tenuous or frail state (eg, pressure ulcers, mobility impairments, low BMI) had stronger associations with risk than factors that contribute to future organ dysfunction (eg, hypertension). However, age was so much stronger as a risk factor for severe outcomes that the magnitudes of risk associated with any source of immunocompromise, or the most important comorbidities, were similar to the difference in risk between vaccinated persons aged 60 vs 50 years. We cannot explain the apparent higher risk among the small number (890) of Native American individuals in the cohort, but the similar risks among White, Black and African American, and Hispanic and Latino groups likely reflects the VA providing similar access in most regions.15
We also identified factors that were protective against severe outcomes; consistent with prior studies, boosters or a history of infection prior to initial vaccination significantly reduced (to a similar degree) but did not eliminate risk of severe breakthrough in all subcohorts. Although increasing time since initial vaccination appeared to be associated with severe outcomes in the unstratified analyses, different effect estimates in the subcohorts suggested residual confounding. Among nonimmunocompromised patients who did not receive boosters (at low risk or moderate to high risk depending on age) no reduction in risk of severe disease during the limited follow-up period was observed, although boosting did provide additional protection against severe disease. This study does not provide insight into optimal timing for repeated boosting or if repeated boosting is necessary for all individuals, as only 5 months of data on risk were available after boosters were recommended for nonimmunocompromised patients with other risk factors and even shorter follow-up was available for the general population.
Few studies have addressed the severity of breakthrough infection. Inclusion of objective metrics to assess severity5,6 is a strength compared with studies that do not account for in-hospital screening practices that affect the hospitalization plus a positive test definition used by COVID-NET.16 Limitation to patients with documented vaccination and documented breakthrough infection avoids bigger problems with missing data and unmeasurable confounders that can affect population-based studies trying to compare patients who are vaccinated with infection (our cohort) with either patients unvaccinated with infection or patients vaccinated without infection, including test-negative designs.17 The CDC published a report of 189 severe cases among 2246 breakthrough infections and found that risk factors for hospitalization and death among vaccinated patients included age 65 years or older, immunocompromised status, and heart, liver, kidney, neurologic disease and diabetes; all patients who died had multiple comorbidities.18 Most studies of patients in immunocompromised states have focused on laboratory-based studies rather than clinical outcomes.19 A recent study of breakthrough infection in immunocompromised patients focused on comparing the conditions causing immune dysfunction and did not attempt to determine risk factors for severity.20 Multiple studies have shown decline in protection after initial vaccination in the general population, with some incorporating severity3,21,22 and others showing improvement after boosting.1,2
Limitations
This study has important limitations. As with all VA studies, the population was predominantly male and older (mean age 62 years, and >70 years among patients with severe disease) and had a high burden of chronic medical problems. The study is not generalizable to female patients nor to younger patients with substantial comorbidities, although in our subcohort analyses, we did not find significant differences in risk factors in these groups. Our use of a nationwide database curated from electronic health records produces additional limitations: uncertainty about the accuracy of COVID-19 as the reason for hospitalization, imperfect algorithms for comorbidities, and missing data, most likely regarding prior infection, boosters, hospitalization at facilities not contracted for reimbursement by the VA, and use of monoclonal antibodies. To address these limitations, we focused on questions that would not depend on data that might be missing. Missing data that could affect our results include boosting, prior infection, and admission to some non-VA hospitals in the outpatient group. Misclassification for boosting or prior infection would attenuate their benefit, which continued to be apparent in our analyses. Misclassification on the basis of inpatient utilization could magnify the effect of any variable more common among patients classified as having severe infection. However, the predominance of the Omicron variant and the relatively high rate of boosting—both widely accepted as being associated with lower risk of severe disease—in the outpatient group argue that this younger, healthier group of patients does not include large numbers of severely ill patients who sought non-VA care more than older patients with more comorbidities. The use of a cohort rather than a matched case-control design, which has been commonly used in studies to estimate vaccine effectiveness, with 90% of patients having nonsevere disease, is less likely to pick up uncommon risk factors and may be more susceptible to residual confounding considering differences such as younger age and fewer comorbidities. Our prespecified analysis of patients with immunocompromising conditions addresses a group that has been widely discussed but understudied with regard to clinical protection via vaccination.19,20,23 A limitation in that analysis is that these drugs are highly diverse, which necessitated grouping drugs with very different mechanisms of action, eg, into leukocyte-inhibiting or cytokine-blocking drugs, and more granular analysis is needed to further risk stratify these patients. In addition, our ability to assess the association of immunosuppressive medications with risk of severe disease was limited by our inability to identify systemic use of certain medications (eg, tacrolimus) and inability to determine glucocorticoid doses. With the caveat of these limitations, the accuracy of VA data on medication dispensing and our ability to evaluate the association between timing of medication receipt and timing of vaccination is a major strength of this study.
Conclusions
This study provides insight into the demographic, clinical, and vaccination-related risk factors for severe compared with nonsevere breakthrough SARS-CoV-2 infection in a predominantly male cohort. These results could be used to bolster guidelines for administration of preexposure prophylaxis and to identify patients most likely to benefit from antiviral therapy. Development of models to estimate the probability of a patient progressing to severe disease for individual risk assessment and to guide treatment and prophylaxis planning and outreach will require more sophisticated approaches, such as machine-learning models to continue to inform best clinical practices for COVID-19 management.
eMethods. Methods With Additional Details
eTable 1. Data Dictionary
eTable 2. List of Immunosuppressive Medications, With Classification
eTable 3. Full Cohort, Data and Analysis, Univariable and Multivariable
eTable 4. Full Cohort Data, 4 Levels of Severity
eTable 5. Subcohorts, Data for Patients Younger and Older Than 50 Years, Analysis for Patients Younger Than 50 Years
eAppendix. Additional Results
eTable 6. Subcohort Immunocompromised, Data and Analysis
eTable 7. Immunosuppressive Medications Before and/or After Vaccination
eTable 8. Subcohort of Immunocompromised Patients, Analysis by Number of Medication Classes
eTable 9. Subcohort of Nonimmunocompromised Patients, Data and Analysis
eTable 10. Subcohort of Patients Aged 50 or Older, Data and Analysis
eTable 11. Subcohort of Nonimmunocompromised Patients Younger Than 65 Years With No Booster, Data and Analysis
eTable 12. Subcohort of Nonimmunocompromised Patients Aged 65 Years or Older With No Booster, Data and Analysis
eFigure. Age Distributions of Male and Female Patients
eTable 13. Subcohort of Female Patients, Data and Analysis
eTable 14. Subcohort of Male Patients, Data and Analysis
eTable 15. Subcohorts of Female and Male, Comparison of Analyses
eTable 16. Subcohort During Delta Period, Data and Analysis
eTable 17. Subcohort During Omicron Period, Data and Analysis
eTable 18. Subcohorts During Delta and Omicron, Comparison of Analyses
eTable 19. Subcohort of Patients Who Received the Pfizer Vaccine, Data and Analysis
eTable 20. Subcohort of Patients Who Received the Moderna Vaccine, Data and Analysis
eTable 21. Subcohort of Patients With Rural Residence, Data and Analysis
eTable 22. Subcohort of Patients With Urban Residence, Data and Analysis
References
- 1.Andrews N, Stowe J, Kirsebom F, et al. Effectiveness of COVID-19 booster vaccines against COVID-19-related symptoms, hospitalization and death in England. Nat Med. 2022;28(4):831-837. doi: 10.1038/s41591-022-01699-1 [DOI] [PMC free article] [PubMed] [Google Scholar]
- 2.Bar-On YM, Goldberg Y, Mandel M, et al. Protection of BNT162b2 vaccine booster against COVID-19 in Israel. N Engl J Med. 2021;385(15):1393-1400. doi: 10.1056/NEJMoa2114255 [DOI] [PMC free article] [PubMed] [Google Scholar]
- 3.Feikin DR, Higdon MM, Abu-Raddad LJ, et al. Duration of effectiveness of vaccines against SARS-CoV-2 infection and COVID-19 disease: results of a systematic review and meta-regression. Lancet. 2022;399(10328):924-944. doi: 10.1016/S0140-6736(22)00152-0 [DOI] [PMC free article] [PubMed] [Google Scholar]
- 4.VA Informatics and Computing Infrastructure. COVID-19 Shared Data Resource. US Department of Veterans Affairs ; 2020. [Google Scholar]
- 5.Fillmore NR, La J, Zheng C, et al. The COVID-19 hospitalization metric in the pre- and post-vaccination eras as a measure of pandemic severity: a retrospective, nationwide cohort study. Infect Control Hosp Epidemiol. Published online January 11, 2022. doi: 10.1017/ice.2022.13 [DOI] [PMC free article] [PubMed] [Google Scholar]
- 6.Corrigan JK, La J, Fillmore NR, et al. Coronavirus disease 2019 (COVID-19) hospitalization metrics that do not account for disease severity underestimate protection provided by severe acute respiratory coronavirus virus 2 (SARS-CoV-2) vaccination and boosting: a retrospective cohort study. Infect Control Hosp Epidemiol. Published online May 23, 2022. doi: 10.1017/ice.2022.79 [DOI] [PMC free article] [PubMed] [Google Scholar]
- 7.Centers for Medicare & Medicaid Services . Chronic Conditions Data Warehouse. Accessed November 30, 2021. https://www2.ccwdata.org/web/guest/condition-categories
- 8.University of Toronto Department of Statistics . Odds ratios and relative risk. Accessed July 25, 2022. https://www.utstat.utoronto.ca/reid/odds.pdf
- 9.Chen H, Cohen P, Chen S. How big is a big odds ratio? interpreting the magnitudes of odds ratios in epidemiological studies. Commun Stat Simul Comput. 2010;39(4):860-864. doi: 10.1080/03610911003650383 [DOI] [Google Scholar]
- 10.Monach P, Branch-Elliman W. From pandemic to endemic. Contagion. 2022;7(1). Accessed September 20, 2022. https://www.contagionlive.com/view/from-pandemic-to-endemic
- 11.Arbel R, Wolff Sagy Y, Hoshen M, et al. Nirmatrelvir use and severe COVID-19 outcomes during the Omicron surge. N Engl J Med. 2022;387(9):790-798. doi: 10.1056/NEJMoa2204919 [DOI] [PMC free article] [PubMed] [Google Scholar]
- 12.Yang J, Zheng Y, Gou X, et al. Prevalence of comorbidities and its effects in patients infected with SARS-CoV-2: a systematic review and meta-analysis. Int J Infect Dis. 2020;94:91-95. doi: 10.1016/j.ijid.2020.03.017 [DOI] [PMC free article] [PubMed] [Google Scholar]
- 13.Garg S, Kim L, Whitaker M, et al. Hospitalization rates and characteristics of patients hospitalized with laboratory-confirmed coronavirus disease 2019—COVID-NET, 14 States, March 1–30, 2020. MMWR Morb Mortal Wkly Rep. 2020;69(15):458-464. doi: 10.15585/mmwr.mm6915e3 [DOI] [PMC free article] [PubMed] [Google Scholar]
- 14.CDC COVID-19 Response Team . Preliminary estimates of the prevalence of selected underlying health conditions among patients with coronavirus disease 2019—United States, February 12–March 28, 2020. MMWR Morb Mortal Wkly Rep. 2020;69(13):382-386. doi: 10.15585/mmwr.mm6913e2 [DOI] [PMC free article] [PubMed] [Google Scholar]
- 15.Fillmore NR, Yellapragada SV, Ifeorah C, et al. With equal access, African American patients have superior survival compared to white patients with multiple myeloma: a VA study. Blood. 2019;133(24):2615-2618. doi: 10.1182/blood.2019000406 [DOI] [PMC free article] [PubMed] [Google Scholar]
- 16.US Centers for Disease Control and Prevention . Coronavirus Disease 2019 (COVID-19)-Associated Hospitalization Surveillance Network (COVID-NET). Accessed June 1, 2022. https://www.cdc.gov/coronavirus/2019-ncov/covid-data/covid-net/purpose-methods.html
- 17.Dean NE, Hogan JW, Schnitzer ME. COVID-19 vaccine effectiveness and the test-negative design. N Engl J Med. 2021;385(15):1431-1433. doi: 10.1056/NEJMe2113151 [DOI] [PMC free article] [PubMed] [Google Scholar]
- 18.Yek C, Warner S, Wiltz JL, et al. Risk factors for severe COVID-19 outcomes among persons aged ≥18 years who completed a primary COVID-19 vaccination series—465 health care facilities, United States, December 2020-October 2021. MMWR Morb Mortal Wkly Rep. 2022;71(1):19-25. doi: 10.15585/mmwr.mm7101a4 [DOI] [PMC free article] [PubMed] [Google Scholar]
- 19.Galmiche S, Luong Nguyen LB, Tartour E, et al. Immunological and clinical efficacy of COVID-19 vaccines in immunocompromised populations: a systematic review. Clin Microbiol Infect. 2022;28(2):163-177. doi: 10.1016/j.cmi.2021.09.036 [DOI] [PMC free article] [PubMed] [Google Scholar]
- 20.Sun J, Zheng Q, Madhira V, et al. ; National COVID Cohort Collaborative (N3C) Consortium . Association between immune dysfunction and COVID-19 breakthrough infection after SARS-CoV-2 vaccination in the US. JAMA Intern Med. 2022;182(2):153-162. doi: 10.1001/jamainternmed.2021.7024 [DOI] [PMC free article] [PubMed] [Google Scholar]
- 21.Goldberg Y, Mandel M, Bar-On YM, et al. Waning immunity after the BNT162b2 vaccine in Israel. N Engl J Med. 2021;385(24):e85. doi: 10.1056/NEJMoa2114228 [DOI] [PMC free article] [PubMed] [Google Scholar]
- 22.Andrews N, Tessier E, Stowe J, et al. Duration of protection against mild and severe disease by COVID-19 vaccines. N Engl J Med. 2022;386(4):340-350. doi: 10.1056/NEJMoa2115481 [DOI] [PMC free article] [PubMed] [Google Scholar]
- 23.Bhurwal A, Mutneja H, Bansal V, et al. Effectiveness and safety of SARS-CoV-2 vaccine in inflammatory bowel disease patients: a systematic review, meta-analysis and meta-regression. Aliment Pharmacol Ther. 2022;55(10):1244-1264. doi: 10.1111/apt.16913 [DOI] [PMC free article] [PubMed] [Google Scholar]
Associated Data
This section collects any data citations, data availability statements, or supplementary materials included in this article.
Supplementary Materials
eMethods. Methods With Additional Details
eTable 1. Data Dictionary
eTable 2. List of Immunosuppressive Medications, With Classification
eTable 3. Full Cohort, Data and Analysis, Univariable and Multivariable
eTable 4. Full Cohort Data, 4 Levels of Severity
eTable 5. Subcohorts, Data for Patients Younger and Older Than 50 Years, Analysis for Patients Younger Than 50 Years
eAppendix. Additional Results
eTable 6. Subcohort Immunocompromised, Data and Analysis
eTable 7. Immunosuppressive Medications Before and/or After Vaccination
eTable 8. Subcohort of Immunocompromised Patients, Analysis by Number of Medication Classes
eTable 9. Subcohort of Nonimmunocompromised Patients, Data and Analysis
eTable 10. Subcohort of Patients Aged 50 or Older, Data and Analysis
eTable 11. Subcohort of Nonimmunocompromised Patients Younger Than 65 Years With No Booster, Data and Analysis
eTable 12. Subcohort of Nonimmunocompromised Patients Aged 65 Years or Older With No Booster, Data and Analysis
eFigure. Age Distributions of Male and Female Patients
eTable 13. Subcohort of Female Patients, Data and Analysis
eTable 14. Subcohort of Male Patients, Data and Analysis
eTable 15. Subcohorts of Female and Male, Comparison of Analyses
eTable 16. Subcohort During Delta Period, Data and Analysis
eTable 17. Subcohort During Omicron Period, Data and Analysis
eTable 18. Subcohorts During Delta and Omicron, Comparison of Analyses
eTable 19. Subcohort of Patients Who Received the Pfizer Vaccine, Data and Analysis
eTable 20. Subcohort of Patients Who Received the Moderna Vaccine, Data and Analysis
eTable 21. Subcohort of Patients With Rural Residence, Data and Analysis
eTable 22. Subcohort of Patients With Urban Residence, Data and Analysis