

ABSTRACT
Background
One limitation of the use of 24-hour collection is impracticality. We analysed the performance of spot urine measurements to estimate 24-hour excretion in patients with kidney stones.
Methods
A total of 74 adult patients from two centres performed a 24-hour urine collection. A sample of the last micturition was sent for spot urine analysis. Twenty patients were asked to collect two additional spot urine samples, one before dinner and the other after dinner. Urinary concentrations of creatinine, calcium, oxalate, uric acid, citrate and magnesium were measured in the 24-hour and each of the spot urine samples. Four approaches were used to estimate 24-hour urinary excretion, multiplying the ratio of the spot urinary analyte to creatinine concentration by (i) measured 24-hour urinary creatinine excretion (Prediction 1), (ii) estimated 24-hour urinary creatinine excretion (Prediction 2), (iii) assumed 1-g 24-hour urinary creatinine excretion (Prediction 3) or (iv) assumed 1.5-g 24-hour urinary creatinine excretion (Prediction 4). For each parameter we computed Lin's concordance correlation coefficients (CCCs), Bland–Altman plots and 95% limits of agreement.
Results
The performance of estimates obtained with Prediction 1 and Prediction 2 was similar, except for citrate and uric acid, for which Prediction 2 performed worse. Both approaches performed moderately well: citrate CCC {0.82 [95% confidence interval (CI) 0.75–0.90]}, oxalate [0.66 (95% CI 0.55–0.78)], magnesium [0.66 (95% CI 0.54–0.77)], calcium [0.63 (95% CI 0.50–0.75)] and uric acid [0.52 (95% CI 0.36–0.68)]. The performance of Predictions 3 and 4 was worse.
Conclusions
Although spot urine samples may hold promise for clinical and population-based research, at present they have limited utility in clinical practice. Measuring or estimating 24-hour creatinine, rather than assuming a given creatinine excretion, will be necessary in future studies of spot urine samples.
Keywords: calcium, nephrolithiasis, oxalate, potassium, uric acid, urine composition
Graphical Abstract
Graphical Abstract.

KEY LEARNING POINTS.
What is already known about this subject?
A full metabolic investigation including at least one 24-hour urine collection is recommended for optimal management of kidney stone disease.
A 24-hour urine collection is often not performed due to impracticality.
The role of spot urines in the management of kidney stone disease is not known.
What this study adds?
We compared three approaches to predict 24-hour urine excretion based on spot urines.
Correlations varied across individual urine parameters.
The use of measured or estimated urine creatinine was superior to assuming a given urine creatinine excretion.
What impact this may have on practice or policy?
Our data do not support the use of spot urine in the management of kidney stone disease.
Spot urine samples may be useful for clinical and population-based research.
Measuring or estimating 24-hour creatinine, rather than assuming 1 g creatinine excretion, will be necessary in future studies.
INTRODUCTION
Kidney stone disease is a common condition, with an estimated prevalence of 8–9% [1, 2] and substantial recurrence rates [3, 4]. Kidney stone formation, although not yet completely understood, can be attributed to both genetic and environmental factors [5, 6]. One key element that is endorsed by major international guidelines [7, 8] in the diagnostic workup as well as in the clinical management of patients affected with kidney stones is the metabolic evaluation, which includes 24-hour urine collection for the determination of parameters such as volume, pH, calcium, oxalate, citrate, uric acid, potassium and magnesium. A full metabolic evaluation provides a number of advantages, including the possibility to diagnose or suspect certain conditions that could benefit from specific treatment (such as cystinuria or primary hyperoxaluria), to assess the patient's adherence to medical/dietary advice and to obtain summary estimates of the urinary supersaturations through dedicated software [9–12], which in turn may be used to inform the risk of stone recurrence [13, 14]. Nevertheless, data regarding actual implementation of 24-hour urine collections in clinical practice are conflicting [15–18] and one of the perceived limitations for its use, in addition to imprecision and incompleteness, is the impracticality of collecting urine throughout the day [19]. Another potential limitation of 24-hour urine collections is in the field of clinical and epidemiological research, where collections are seldom implemented but spot urine samples are often available. To examine whether all urine has to be collected during the 24-hour period, we analysed the performance of spot urine measurements to estimate 24-hour excretion in patients with KS.
MATERIALS AND METHODS
Study population
Adult patients (age ≥18 years) with urinary stone disease were recruited from two centres (BioHealth Italia, Torino, Italy and Tufts University School of Medicine, Maine Medical Center, Portland, ME, USA) from October 2013 to September 2014. In both centres, patients were instructed to perform a complete 24-hour urine collection on their free diet, starting from the second micturition of a given day and including the first of the subsequent day. A sample of the latter, which was collected in the fasting state, was taken for spot urine analysis. In the Tufts study population, patients were also asked to collect two additional spot urine samples, one before dinner (preprandial) and the other after dinner (postprandial). Demographic and clinical data, including age, sex, weight and height, were obtained for each patient. All study participants were white. Institutional review board approval was obtained locally from each study centre.
Laboratory methods
Urinary concentrations of creatinine, calcium, oxalate, uric acid, citrate and magnesium were measured on both 24-hour and spot urine samples. Daily urinary excretions were computed by multiplying the urinary concentration of each analyte by the urine volume over 24 hour. Urine samples from the Tufts population were analysed by Litholink, whereas those from the Torino group were analysed at the laboratory of Mauriziano Hospital [20].
Statistical analysis
Variables were summarized as mean [standard deviation (SD)] or median [interquartile range (IQR)] and categorical variables as frequencies (percentages). Three approaches were used to estimate 24-hour urinary excretion, multiplying the ratio of the spot urinary analyte to creatinine concentration by (i) measured 24-hour urinary creatinine excretion (Prediction 1), (ii) estimated 24-hour urinary creatinine excretion (Prediction 2), (iii) assumed 1-g 24-hour urinary creatinine excretion (Prediction 3) or (iv) assumed 1.5-g 24-hour urinary creatinine excretion (Prediction 4). Of note, Prediction 1 represents the highest information that could be obtained from spot urine samples, since it employs measured urinary creatinine excretion. Estimated 24-hour urinary creatinine was obtained from the equation developed by Ix et al. (equation ‘D’) [21], which was previously found to have the best performance among published equations for estimation of urinary creatinine excretion [22].
To explore the performance of each approach in estimating 24-hour urinary excretion, for each urinary parameter, we computed Lin's concordance correlation coefficients (CCCs) with 95% confidence intervals (CIs). The Lin's CCC, compared with other approaches such as Pearson's correlation coefficient, provides a metric of both covariation and correspondence, hence it is a superior approach to quantify the performance of an estimation method against a continuous gold standard [23, 24]. CCCs obtained from different approaches were compared for statistical differences by bootstrapping with 500 replications. Bland–Altman plots and 95% limits of agreement (LoAs) were also generated, as well as an accuracy of 30% (P30; percentage of predicted excretion within 30% of measured excretion). Bias was computed as the difference between the estimated and the measured value for each parameter. The same approach was applied to establish the performance of morning fasting, preprandial and postprandial samples and combinations thereof in the Tufts sample. For this subanalysis, 24-hour urinary excretions were estimated using Prediction 1.
For all analyses, a two-tailed P-value <0.05 was considered statistically significant. All analyses were performed using Stata 16.0 (StataCorp, College Station, TX, USA). The CONCORD module was used to obtain Lin's CCC.
RESULTS
The final study sample included 74 patients, whose characteristics are reported in Table 1. Overall, the two samples were relatively homogeneous, except for a larger proportion of females and higher body weight and body mass index (BMI) in the Tufts sample. Urine chemistries were comparable across samples, except for higher urinary creatinine in the Tufts sample.
Table 1.
Characteristics of the study population
| Characteristics | Overall (N = 74) | Torino sample (n = 54) | Tufts sample (n = 20) |
|---|---|---|---|
| Age (years), mean (SD) | 46.7 (12.3) | 44.5 (12.0) | 52.7 (11.2) |
| Female, n (%) | 25 (34) | 15 (28) | 10 (50) |
| Weight (kg), mean (SD) | 77.7 (21.4) | 74.4 (18.5) | 86.5 (26.2) |
| BMI (kg/m2), mean (SD) | 26.3 (6.1) | 25.1 (4.9) | 29.8 (7.6) |
| Potassium citrate, n (%) | 14 (19) | 10 (19) | 4 (20) |
| Thiazides, n (%) | 10 (14) | 0 (0) | 10 (50) |
| Stone composition, n (%) | |||
| CaOx | 18 (24) | 8 (15) | 8 (40) |
| CaP | 4 (5) | 2 (4) | 1 (5) |
| Mixed CaOx/CaP | 18 (24) | 10 (19) | 7 (35) |
| Other | 4 (5) | 4 (7) | 0 (0) |
| Not known | 50 (68) | 30 (56) | 4 (20) |
| Creatinine (mg/24 hour), median (IQR) | 1511 (1210–1933) | 1455 (1210–1933) | 1706 (1178–1908) |
| Oxalate (mg/24 hour), median (IQR) | 34.7 (24.8–44.5) | 35.5 (27.5–45.3) | 33.1 (23.0–41.0) |
| Calcium (mg/24 hour), median (IQR) | 165 (101–219) | 163 (89–242) | 171 (134–203) |
| Magnesium (mg/24 hour), median (IQR) | 94 (68–121) | 94 (68–119) | 92 (69–141) |
| Citrate (mg/24 hour), median (IQR) | 507 (338–718) | 507 (357–702) | 501 (327–750) |
| Uric acid (mg/24 hour), median (IQR) | 551 (437–696) | 527 (437–683) | 599 (450–728) |
| SS CaOx–median (IQR) | 4.6 (2.6–7.0) | 4.8 (2.2–7.8) | 4.3 (3.1–5.9) |
| SS CaP, median (IQR) | 0.7 (0.2–1.7) | 0.7 (0.2–2.5) | 0.7 (0.3–1.1) |
| SS UA, median (IQR) | 0.4 (0.2–1.0) | 0.4 (0.3–0.9) | 0.4 (0.1–1.1) |
BMI, body mass index; CaOx, calcium oxalate; CaP, calcium phosphate; SS, supersaturation; UA, uric acid.
Estimated urinary creatinine excretion exhibited a Lin's CCC of 0.62 (95% CI 0.49–0.75), bias −132 mg (95% CI −828–564 mg) and P30 79.7%. In contrast, assuming a daily excretion of 1 g was rather imprecise: the median difference between measured and assumed urinary creatinine excretion was 511 mg (IQR 210–933), with 49 patients (65.3%) showing values of measured creatinine excretion below [1 patient (1.4%)] or above [48 patients (64.9%)] the 30% assumed creatinine excretion.
Values and comparisons of Lin's CCC across different estimation approaches are reported in Table 2. Overall, the performance of estimates obtained with Predictions 1 and 2 was similar for all parameters, except for citrate and uric acid, for which Prediction 2 performed significantly worse. In general, both estimation approaches performed adequately well in predicting 24-hour urinary excretion, especially for citrate (CCC 0.82 and 0.67 for Prediction 1 and 2, respectively) and with the exception of uric acid (CCC 0.52 and 0.30 for Prediction 1 and 2, respectively). The performance of Prediction 3 was consistently worse compared with the other approaches, whereas Prediction 4 had similar performance for some parameters and worse for others. Analysis of bias and P30 was generally consistent with the CCC analysis, showing larger absolute differences and accuracy between estimated and measured values for the Prediction 3 approach, whereas when using Prediction 2 the bias for oxalate was 4.9 mg, for calcium 4 mg, for magnesium 3 mg, for citrate 77 mg and for uric acid 94 mg. The correspondence between estimated and measured excretions is shown in Figure 1 and the Bland–Altman plots are shown in Figures 2–6.
Table 2.
Performance of different approaches to predict 24-hour urine excretion based on spot urine samples
| Variable | Lin's CCC | 95% CI | Bias (mg/24 hour) | 95% LoA (mg/24 hour) | P30 |
|---|---|---|---|---|---|
| Oxalate | |||||
| Prediction 1 | 0.66 | 0.55–0.78 | −3.0 | −48.7–42.6 | 58.1 |
| Prediction 2 | 0.63 | 0.52–0.74 | −4.9 | −56.1–46.2 | 50.0 |
| Prediction 3 | 0.48*, **, *** | 0.35–0.62 | −15.6 | −50.7–19.6 | 29.7 |
| Prediction 4 | 0.62 | 0.48–0.76 | −4.0 | −46.6–38.7 | 47.3 |
| Calcium | |||||
| Prediction 1 | 0.63 | 0.50–0.75 | 19 | −191–229 | 44.6 |
| Prediction 2 | 0.63*** | 0.49–0.77 | −4 | −184–176 | 44.6 |
| Prediction 3 | 0.47*, ** | 0.31–0.62 | −52 | −227–123 | 36.5 |
| Prediction 4 | 0.54 | 0.38–0.70 | 12 | −201–226 | 37.8 |
| Magnesium | |||||
| Prediction 1 | 0.66 | 0.54–0.77 | 15 | −79–109 | 51.4 |
| Prediction 2 | 0.66*** | 0.52–0.78 | 3 | −80–87 | 51.4 |
| Prediction 3 | 0.31*, ** | 0.15–0.47 | −28 | −119–63 | 35.1 |
| Prediction 4 | 0.41 | 0.22–0.60 | 8 | −97–113 | 37.8 |
| Citrate | |||||
| Prediction 1 | 0.82 | 0.75–0.90 | −38 | −374–297 | 73.0 |
| Prediction 2 | 0.67* | 0.54–0.79 | −77 | −497–344 | 55.4 |
| Prediction 3 | 0.48*, **, *** | 0.35–0.61 | −200 | −616–216 | 40.5 |
| Prediction 4 | 0.64* | 0.51–0.77 | −25 | −525–474 | 47.3 |
| Uric acid | |||||
| Prediction 1 | 0.52 | 0.36–0.68 | −52 | −484–380 | 60.8 |
| Prediction 2 | 0.30* | 0.10–0.49 | −94 | −587–398 | 59.5 |
| Prediction 3 | 0.05*, ** | 0–0.16 | −237 | −709–234 | 24.3 |
| Prediction 4 | 0.09* | 0–0.31 | −61 | −623–501 | 55.4 |
*P < 0.05 versus Prediction 1; **P < 0.05 versus Prediction 2; ***P < 0.05 versus Prediction 4.
Figure 1:

Correspondence between estimated and measured excretions. The black solid line represents the line of identity. All values expressed in mg/24 hour.
Figure 2:

Bland–Altman plots showing the difference between measured and estimated urinary oxalate excretion plotted against the mean.
Figure 6:
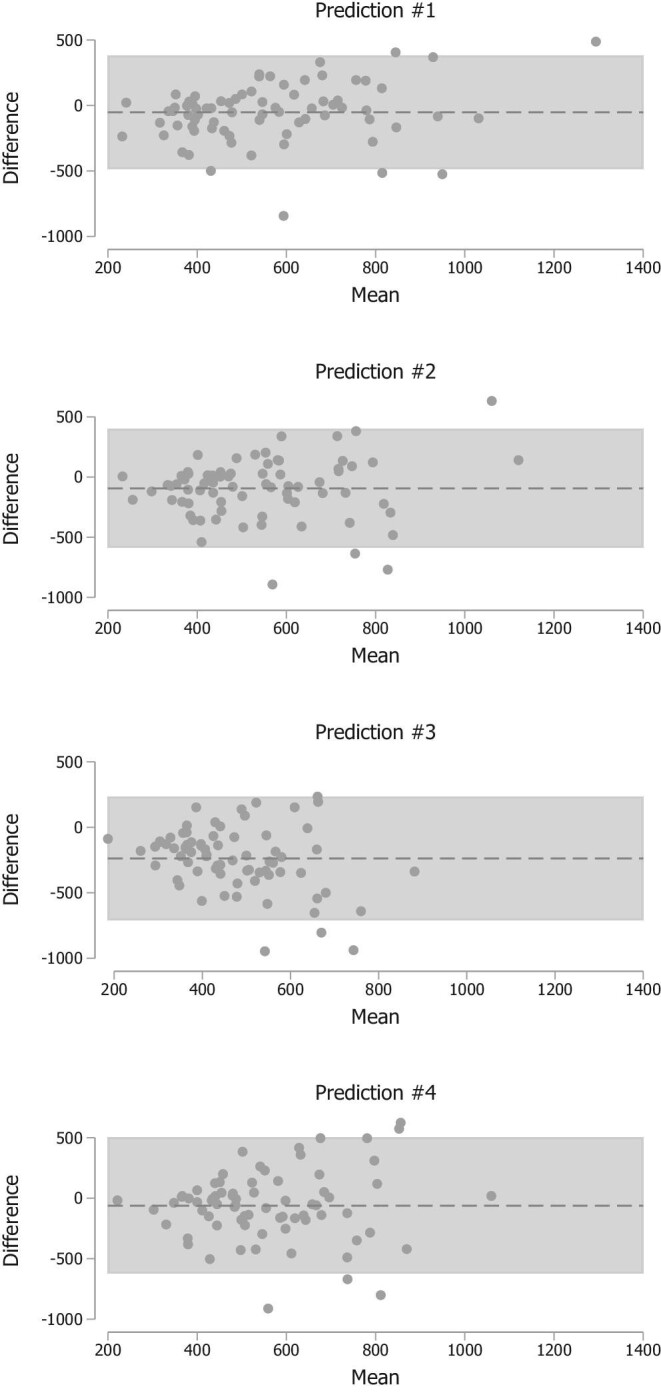
Bland–Altman plots showing the difference between measured and estimated urinary uric acid excretion plotted against the mean.
Figure 3:

Bland–Altman plots showing the difference between measured and estimated urinary calcium excretion plotted against the mean.
Figure 4:

Bland–Altman plots showing the difference between measured and estimated urinary magnesium excretion plotted against the mean.
Figure 5:

Bland–Altman plots showing the difference between measured and estimated urinary citrate excretion plotted against the mean.
Table 3.
Performance of spot urine samples taken at different times to predict 24-hour urine excretions (Tufts sample; n = 20 participants)
| Variables | Lin's CCC | 95% CI | Bias (mg/24 hour) | 95% LoA (mg/24 hour) | P30 |
|---|---|---|---|---|---|
| Oxalate | |||||
| Morning fasting | 0.71 | 0.50–0.92 | −1.7 | −24.8–21.5 | 75.0 |
| Preprandial | 0.96 | 0.92–0.99 | 1.0 | −9.6–11.5 | 95.0 |
| Postprandial | 0.40# | 0.09–0.72 | −7.5 | −37.9–23.0 | 70.0 |
| Calcium | |||||
| Morning fasting | 0.80 | 0.66–0.95 | −18 | −116–79 | 75.0 |
| Preprandial | 0.63 | 0.39–0.87 | −7 | −163–150 | 60.0 |
| Postprandial | 0.44 | 0.11–0.77 | −6 | −210–158 | 35.0 |
| Magnesium | |||||
| Morning fasting | 0.87 | 0.75–0.98 | −13 | −63–37 | 60.0 |
| Preprandial | 0.84 | 0.71–0.97 | −6 | −68–56 | 65.0 |
| Postprandial | 0.78 | 0.62–0.95 | 1 | −78–80 | 60.0 |
| Citrate | |||||
| Morning fasting | 0.90 | 0.81–0.98 | −10 | −237–217 | 85.0 |
| Preprandial | 0.86 | 0.74–0.97 | 27 | −281–334 | 95.0 |
| Postprandial | 0.81# | 0.66–0.96 | −98 | −383–187 | 65.0 |
| Uric acid | |||||
| Morning fasting | 0.67 | 0.42–0.92 | −14 | −329–301 | 75.0 |
| Preprandial | 0.74 | 0.54–0.93 | −64 | −293–166 | 85.0 |
| Postprandial | 0.78 | 0.64–0.93 | −85 | −326–155 | 70.0 |
*P < 0.05 versus morning fasting. Prediction 1 was used to estimate 24-hour urinary excretions.
The analysis of performance of spot urine samples taken at different times in the Tufts sample is reported in Table 3 (24-hour urinary excretions all estimated using Prediction 1, measured 24-hour urinary creatinine excretion). Overall, there were no major differences except for postprandial oxalate and citrate, which performed worse; in general, postprandial samples tended to perform numerically worse compared with fasting morning and preprandial samples except for uric acid. No noticeable differences were observed in performance when using various combinations or averages of the three spot samples.
DISCUSSION
In our study we examined the performance of spot urine samples in providing information usually obtained from 24-hour urine collections in stone formers. We found that indexing spot urine concentrations to a known or estimated value of 24-hour urinary creatinine excretion substantially increased performance for most parameters compared with assuming a 24-hour urinary creatinine excretion of 1 g. The improved performance was observed for some parameters assuming 1.5-g 24-hour urinary creatinine excretion compared with 1 g; since the average urine creatinine excretion in our population was closer to 1.5 g than to 1 g, the increase in performance for Prediction 4 compared with Prediction 3 shows that a more accurate estimation of urine creatinine (Prediction 2) is a superior approach to assuming a given excretion (Predictions 3 and 4).
The rationale for our effort stems from the fact that a full metabolic investigation, despite being recommended by major international guidelines [7, 8], is often not requested by treating physicians or not performed by patients because of the difficulty in collecting urine for a 24-hour period. Furthermore, if 24-hour urines are under- or overcollected, results become unreliable. The magnitude of the CCCs and the Bland–Altman data do not suggest that the approach used in our study would be able to be used in direct clinical care of patients with kidney stones. However, these CCCs suggest that spot urine samples scaled to measured or estimated 24-hour urinary creatinine may be a useful resource in large population-based studies examining lithogenic factors such as exposure or outcome.
Given the potential impact of using spot urines in lieu of a complete metabolic evaluation in clinical practice, it is not surprising that previous attempts have been made to investigate the topic. For example, our group investigated the correlation between urinary supersaturations obtained from timed urine samples and 24-hour urine collections in healthy subjects, finding differential diurnal variations for calcium oxalate, uric acid and brushite [25]. With regard to spot urine analysis, Itami et al. [26] analysed the correlation between spot oxalate:creatinine ratio and 24-hour oxalate excretion in the urine of children with and without primary hyperoxaluria, reporting a high correlation. Conversely, Hashmi et al. [27] found a poor correlation between those parameters in adult patients with kidney stones. Urine calcium measured in spot samples, especially from a fasting first morning sample, was found to correlate relatively well with daily excretions in a sample of healthy children [28], whereas in adult healthy women, Ilich et al. [29] analysed the correlations for calcium, magnesium, sodium, potassium, zinc and creatinine and found correlation coefficients ranging from 0.22 for creatinine to 0.64 for zinc. However, our study is the first comprehensive exploration in stone formers—who have been reported to have peculiar fasting, postprandial, and/or circadian patterns of urinary excretions compared with non-stone formers [30–32]—and we could also examine the differential value of spot urines obtained at different times of day.
A potential field of application of our findings is in clinical and epidemiological research. Whereas the potential benefits and harms of applying one of the proposed equations to the individual patient warrant further studies with larger samples, we believe that applying Prediction 2 to cohort studies without available 24-hour collections would yield more accurate estimates compared with assuming 1 g/day urinary creatinine excretion. The prediction could also be used in clinical trials as an enrichment tool to select participants who should undergo a 24-hour urine collection.
Our study has several strengths, including the enrolment of patients from two centres with different types of stones (calcium, uric acid and mixed stones), all elements expected to improve the generalizability of our findings. Rather than simply indexing for urine creatinine assuming a daily excretion of 1 g, we compared different indexing techniques based on known 24-hour urine values or estimation by validated equations [22]. Furthermore, we could leverage information from multiple spot urine samples, at least in a subgroup of the study. Finally, we used a rigorous approach with the use of an optimal metric of comparison: Lin's CCC [23]. Of note, most previous studies used either the Pearson or Spearman correlation coefficient.
Our study also has limitations, including the relatively small sample size, especially for the analysis of multiple spot urines, and the lack of patients from ancestries other than Caucasian. Finally, we did not have repeated measurements for the same participant over time, which could be useful to determine whether absolute or relative changes in 24-hour urine excretion can be adequately captured by spot urines.
In conclusion, spot urine samples combined with specific indexing techniques may be useful in population-based studies of urinary stone disease. Our data do not suggest at present that spot urine samples can replace 24-hour collections for direct patient care. Future studies in this area will need to employ measured or estimated 24-hour urinary creatinine rather than assuming a given creatinine excretion.
ACKNOWLEDGEMENTS
P.M.F. is a member of the European Reference Network for Rare Kidney Diseases (ERKNet; Project ID 739532).
Contributor Information
Pietro Manuel Ferraro, U.O.S. Terapia Conservativa della Malattia Renale Cronica, U.O.C. Nefrologia, Dipartimento di Scienze Mediche e Chirurgiche, Fondazione Policlinico Universitario A. Gemelli IRCCS, Rome, Italy; Dipartimento Universitario di Medicina e Chirurgia Traslazionale, Università Cattolica del Sacro Cuore, Rome, Italy.
Fernando Lopez, Tufts University School of Medicine, Department of Nephrology and Transplantation, Maine Medical Center, Portland, ME, USA.
Michele Petrarulo, Laboratorio Calcolosi Renale Ospedale Mauriziano, Torino, Italy.
Silvia Barbarini, Dipartimento Universitario di Medicina e Chirurgia Traslazionale, Università Cattolica del Sacro Cuore, Rome, Italy.
Gary C Curhan, Channing Division of Network Medicine, Department of Medicine, Brigham and Women's Hospital, Harvard Medical School, Boston, MA, USA.
Martino Marangella, Fondazione Scientifica Ospedale Mauriziano Onlus, Torino, Italy.
Eric N Taylor, Channing Division of Network Medicine, Department of Medicine, Brigham and Women's Hospital, Harvard Medical School, Boston, MA, USA; Section of Nephrology, VA Maine Healthcare System, Augusta, ME, USA.
FUNDING
The Maine Medical Center Research Institute provided funding through the Mentored Research Grant Program for the Tufts study. G.C.C. is supported by K24-DK091417.
AUTHORS’ CONTRIBUTIONS
P.M.F. was responsible for conceptualization. M.M., F.L., M.P. and S.B. were responsible for data curation. Formal analysis was carried by P.M.F. S.B. and E.N.T. were responsible for methodology. P.M.F. was responsible for software and writing the original draft. E.N.T., M.M. and G.C. were responsible for reviewing and editing the manuscript. All authors have read and agreed to the published version of the manuscript.
DATA AVAILABILITY STATEMENT
Data described in the article, code book and analytic code will be made available upon request pending application, approval and payment.
CONFLICT OF INTEREST STATEMENT
P.M.F. received consultant fees and grant support from Allena Pharmaceuticals, Alnylam, AstraZeneca, BioHealth Italia and Vifor Fresenius and royalties as an author for UpToDate. G.C.C. is an employee of OM1, has received consulting fees from Allena Pharmaceuticals and receives royalties as a section editor and author for UpToDate. The results presented in this article have not been published previously in whole or part, except in abstract format. The authors report no conflict of interests.
REFERENCES
- 1. Chen Z, Prosperi M, Bird VY. Prevalence of kidney stones in the USA: the National Health and Nutrition Evaluation Survey. J Clin Urol 2019; 12: 296–302 [Google Scholar]
- 2. Croppi E, Ferraro PM, Taddei Let al. Prevalence of renal stones in an Italian urban population: a general practice-based study. Urol Res 2012; 40: 517–522 [DOI] [PubMed] [Google Scholar]
- 3. Ferraro PM, Curhan GC, D'Addessi Aet al. Risk of recurrence of idiopathic calcium kidney stones: analysis of data from the literature. J Nephrol 2017; 30: 227–233 [DOI] [PubMed] [Google Scholar]
- 4. Vaughan LE, Enders FT, Lieske JCet al. Predictors of symptomatic kidney stone recurrence after the first and subsequent episodes. Mayo Clin Proc 2019; 94: 202–210 [DOI] [PMC free article] [PubMed] [Google Scholar]
- 5. Goldfarb DS, Fischer ME, Keich Yet al. A twin study of genetic and dietary influences on nephrolithiasis: a report from the Vietnam Era Twin (VET) Registry. Kidney Int 2005; 67: 1053–1061 [DOI] [PubMed] [Google Scholar]
- 6. Ferraro PM, Taylor EN, Gambaro Get al. Dietary and lifestyle risk factors associated with incident kidney stones in men and women. J Urol 2017; 198: 858–863 [DOI] [PMC free article] [PubMed] [Google Scholar]
- 7. Pearle MS, Goldfarb DS, Assimos DGet al. Medical management of kidney stones: AUA guideline. J Urol 2014; 192: 316–324 [DOI] [PubMed] [Google Scholar]
- 8. Skolarikos A, Straub M, Knoll Tet al. Metabolic evaluation and recurrence prevention for urinary stone patients: EAU guidelines. Eur Urol 2015; 67: 750–763 [DOI] [PubMed] [Google Scholar]
- 9. Rodriguez A, Cunha T da S, Rodgers ALet al. Comparison of supersaturation outputs from different programs and their application in testing correspondence with kidney stone composition. J Endourol 2021; 35: 687–694 [DOI] [PubMed] [Google Scholar]
- 10. Marangella M, Petrarulo M, Vitale Cet al. LITHORISK.COM: the novel version of a software for calculating and visualizing the risk of renal stone. Urolithiasis 2021; 49: 211–217 [DOI] [PMC free article] [PubMed] [Google Scholar]
- 11. Werness PG, Brown CM, Smith LHet al. EQUIL2: a BASIC computer program for the calculation of urinary saturation. J Urol 1985; 134: 1242–1244 [DOI] [PubMed] [Google Scholar]
- 12. May P. JESS, a joint expert speciation system—I. Raison d’être. Talanta 1991; 38: 1409–1417 [DOI] [PubMed] [Google Scholar]
- 13. Prochaska M, Taylor E, Ferraro PMet al. Relative supersaturation of 24-hour urine and likelihood of kidney stones. J Urol 2018; 199: 1262–1266 [DOI] [PMC free article] [PubMed] [Google Scholar]
- 14. Ferraro PM, Ticinesi A, Meschi Tet al. Short-Term changes in urinary relative supersaturation predict recurrence of kidney stones: a tool to guide preventive measures in urolithiasis. J Urol 2018; 200: 1082–1087 [DOI] [PubMed] [Google Scholar]
- 15. Ferraro PM, Arrabal-Polo MÁ, Capasso Get al. A preliminary survey of practice patterns across several European kidney stone centers and a call for action in developing shared practice. Urolithiasis 2019; 47: 219–224 [DOI] [PubMed] [Google Scholar]
- 16. Ferraro PM, Unwin R, Bonny Oet al. Practice patterns of kidney stone management across European and non-European centers: an in-depth investigation from the European Renal Stone Network (ERSN). J Nephrol 2021; 34: 1337–1346 [DOI] [PMC free article] [PubMed] [Google Scholar]
- 17. Milose JC, Kaufman SR, Hollenbeck BKet al. Prevalence of 24-hour urine collection in high risk stone formers. J Urol 2014; 191: 376–380 [DOI] [PubMed] [Google Scholar]
- 18. Song S, Thomas I-C, Ganesan Cet al. Twenty-four hour urine testing and prescriptions for urinary stone disease-related medications in veterans. Clin J Am Soc Nephrol 2019; 14: 1773–1780 [DOI] [PMC free article] [PubMed] [Google Scholar]
- 19. Hsi RS, Stoller ML. Complete metabolic evaluation is indicated after a first stone event: con. J Urol 2017; 197(3 Pt 1): 545–547 [DOI] [PubMed] [Google Scholar]
- 20. Ferraro PM, Baccaro R, Baroni Set al. Effect of water composition and timing of ingestion on urinary lithogenic profile in healthy volunteers: a randomized crossover trial. J Nephrol 2021; 34: 875–881 [DOI] [PubMed] [Google Scholar]
- 21. Ix JH, Wassel CL, Stevens LAet al. Equations to estimate creatinine excretion rate: the CKD Epidemiology Collaboration. Clin J Am Soc Nephrol 2011; 6: 184–191 [DOI] [PMC free article] [PubMed] [Google Scholar]
- 22. Jędrusik P, Symonides B, Gaciong Z. Performance of 24-hour urinary creatinine excretion-estimating equations in relation to measured 24-hour urinary creatinine excretion in hospitalized hypertensive patients. Sci Rep 2019; 9: 3593. [DOI] [PMC free article] [PubMed] [Google Scholar]
- 23. Lin LI. A concordance correlation coefficient to evaluate reproducibility. Biometrics 1989; 45: 255–268 [PubMed] [Google Scholar]
- 24. Liao JJ, Lewis JW. A note on concordance correlation coefficient. PDA J Pharm Sci Technol 2000; 54: 23–26 [PubMed] [Google Scholar]
- 25. Rodriguez A, Baccaro R, Gambaro Get al. Urinary supersaturation on fractioned urine collections: which urine sample can explain better the variability observed on 24-h urine? A proof-of-concept study. Urolithiasis 2020; 48: 403–408 [DOI] [PubMed] [Google Scholar]
- 26. Itami N, Yasoshima K, Akutsu Yet al. Spot-urine screening for primary hyperoxaluria. Nephron 1990; 56: 337–338 [DOI] [PubMed] [Google Scholar]
- 27. Hashmi SB, Jafri L, Majid Het al. Relationship of spot urine oxalate to creatinine ratio and 24 hours urinary oxalate excretion in patients with urolithiasis. Ann Med Surg (Lond) 2020; 60:330–333 [DOI] [PMC free article] [PubMed] [Google Scholar]
- 28. Paccaud Y, Rios-Leyvraz M, Bochud Met al. Spot urine samples to estimate 24-hour urinary calcium excretion in school-age children. Eur J Pediatr 2020; 179: 1673–1681 [DOI] [PubMed] [Google Scholar]
- 29. Ilich JZ, Blanuša M, Orlić ŽCet al. Comparison of calcium, magnesium, sodium, potassium, zinc, and creatinine concentration in 24-h and spot urine samples in women. Clin Chem Lab Med 2009; 47: 216–221 [DOI] [PubMed] [Google Scholar]
- 30. Gopala SK, Joe J. Effect of calcium content of diet on crystal formation in urine of patients with calcium oxalate stones: a randomized crossover clinical trial. Afr J Urol 2021; 27: 124. [DOI] [PMC free article] [PubMed] [Google Scholar]
- 31. Cameron M, Maalouf NM, Poindexter Jet al. The diurnal variation in urine acidification differs between normal individuals and uric acid stone formers. Kidney Int 2012; 81: 1123–1130 [DOI] [PMC free article] [PubMed] [Google Scholar]
- 32. Schwille PO, Hanisch E, Scholz D. Postprandial hyperoxaluria and intestinal oxalate absorption in idiopathic renal stone disease. J Urol 1984; 132: 650–655 [DOI] [PubMed] [Google Scholar]
Associated Data
This section collects any data citations, data availability statements, or supplementary materials included in this article.
Data Availability Statement
Data described in the article, code book and analytic code will be made available upon request pending application, approval and payment.