. 2022 Oct 3;14(40):15141–15155. doi: 10.1039/d2nr03792k

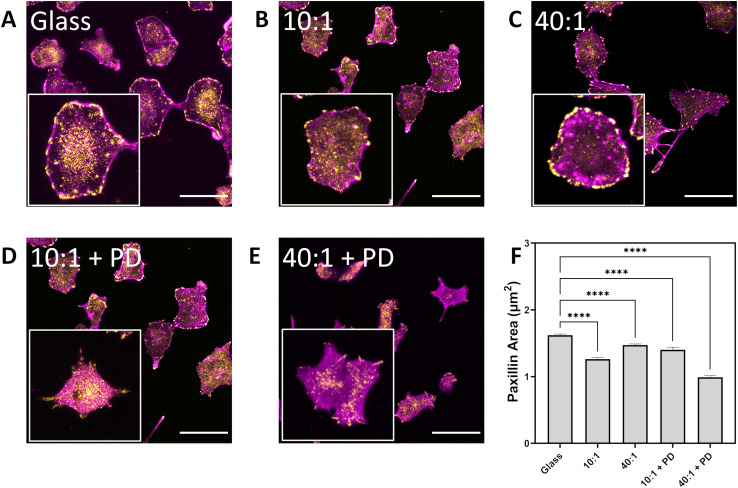
Fig. 5. Effect of substrate stiffness and topography on formation of focal adhesion plaques as determined by paxillin labelling and visualization by confocal laser scanning microscopy. A549 on (A) glass, (B) PDMS 10 : 1, (C) PDMS 40 : 1, (D) PDMS 10 : 1 + PD, (E) PDMS 40 : 1 + PD. F-actin labelled in magenta while paxillin is labelled with rabbit anti-paxillin and goat anti-rabbit IgG conjugated with AlexaFluor 555 in yellow. Scale bar represents 50 μm. (F) Paxillin area assessed over n > 100 cells over three biological replicates. Data expressed as mean + sem. Statistical analysis performed using a one-way ANOVA with Tukey's post hoc test, *****p < 0.0001. PD – particle-decorated surface.

Fig. 5