

Abstract
The present study aimed to clarify the alkalizing ability of 1.35% isotonic sodium bicarbonate solution (ISBS), which did not contain dextrose, compared with that of 1.35% isotonic bicarbonate sodium solution containing 4.03% dextrose (ISBD) in healthy calves. The calves were intravenously administered with 20.7 mL/kg of the solutions for 30 min as the volume required to correct base deficit of 10 mM. ISBS increased the blood pH, HCO3−, and base excess from 7.44 ± 0.02, 29.6 ± 1.9 mM, and 5.3 ± 2.1 mM to 7.49 ± 0.02, 36.9 ± 2.3 mM, and 13.5 ± 2.6 mM respectively (P<0.05). These factors for the ISBD group increased from 7.41 ± 0.02, 29.0 ± 1.1 mM, and 4.5 ± 1.3 mM to 7.43 ± 0.02, 33.5 ± 1.9 mM, and 9.5 ± 1.7 mM (P<0.05), respectively. Furthermore, in the ISBD group, the relative plasma volume and blood glucose level increased while the K+ level decreased, which did not occur in the ISBS group. Therefore, the results revealed that ISBS had better alkalizing ability in calves than ISBD.
Keywords: calf, dextrose, hyperkalemia, isotonic sodium bicarbonate, metabolic acidosis
Metabolic acidosis is a common consequence of diarrhea in calves [3, 6, 8, 10, 18, 20]. The main causes are loss of bicarbonate ions (HCO3−) from the intestinal tract due to diarrhea and impaired excretion of hydrogen ions (H+) in the kidney [24]. In severe acidosis, buffering of the acid-base balance in the blood is impaired, and H+ accumulates in the cells, which can lead to the death of animals [4]. Thus, alkalinization of the blood is an important treatment for this disease [1, 2]. For moderate or severe acidosis, sodium bicarbonate (NaHCO3) is administered intravenously after the dose is calculated from the determination of blood gas and clinical symptoms [4]. It is recommended that 1.35% isotonic NaHCO3 solution (ISBS) is administered intravenously at a rate of 30–40 mL/kg/hr because there is a risk of paradoxical acidosis of the cerebrospinal fluid caused by rapid administration of hypertonic NaHCO3 solution [1, 2, 5]. In clinical practice, if the veterinarians do not have ISBS, a solution of hypertonic NaHCO3 and 5% glucose solution is used instead [16, 27]. However, few studies have evaluated the effects of this combination. Even if the amount of NaHCO3 is the same as ISBS, the components and osmotic pressure are different, so it is unclear whether these solutions have the same effects on cows. The present study aimed to clarify the alkalizing ability of ISBS without dextrose compared with solutions containing 4.03% dextrose (ISBD) in healthy calves.
MATERIALS AND METHODS
All procedures were performed in accordance with the standards outlined by the Good for the Care and Use of Laboratory Animals and the Clinical Practice of the Central Research Institute, Nippon Zenyaku Kogyo Co., Ltd., Koriyama, Japan (NZ66). Four healthy Holstein calves were studied, with an average body weight of 98.5 ± 39.4 kg. ISBS was used as an alkalinization fluid (isotonic sodium bicarbonate solution, Nippon Zenyaku Kogyo Co., Ltd.) (Table 1). Additionally, for comparison with ISBS, the combination of 7% hypertonic NaHCO3 (sodium bicarbonate solution, Nippon Zenyaku Kogyo Co., Ltd.) and 5% dextrose (vitamin B1 added 5% dextrose solution, Nippon Zenyaku Kogyo Co., Ltd.) was used for ISBD (Table 1).
Table 1. Median (minimum–maximum) of osmolarity and pH of each solution.
| Solution | Osmolarity | pH |
|---|---|---|
| 1.35% isotonic NaHCO3 solution (ISBS) | 292 (291–294) | 7.71 (7.57–7.74) |
| 7% hypertonic NaHCO3 solution | 1,414 (1,407–1,421) | 7.88 (7.84–7.92) |
| 5% dextrose solution | 301 (300–302) | 3.90 (3.83–3.94) |
| 1.35% isotonic NaHCO3 solution with 4.03% dextrose (ISBD) | 541 (540–544) | 8.18 (8.16–8.21) |
The median (minimum–maximum) of osmolarity and pH was determined by measurement of 5 products of each solution.
Assuming a base deficit of 10 mM, the dose of ISBS for each calf was calculated as follows.
Base needed (mmol)=BW (kg) × 10 mM × 1/3 [13, 18]
ISBS (mL)=Base needed (mmol)/161 (mmol) × 1,000 (mL)
ISBS (mL/kg)≈20.7 (mL/kg)
The dose of ISBD was first calculated by the following with the amount of 7% NaHCO3 solution so that the amount of NaHCO3 was the same as that of ISBS.
7% hypertonic NaHCO3 (mL)=ISBS (mL) × 161 (mmol)/ 833 (mmol)
Furthermore, the total volume of 5% dextrose solution mixed with 7% hypertonic NaHCO3 calculated above was adjusted to be the same as that of ISBS. The ratio of 5% dextrose / 7% hypertonic NaHCO3 was 4.17, so ISBD contained 4.03% dextrose.
Each solution was administered intravenously to the calves using the cross-over method with a one-week interval between the first and second tests by 2 × 2 cross-over method (n=4 in each group). In particular, 16-gauge catheters were placed in the bilateral jugular veins 15 min before administration. The solution was administered via the right jugular vein for 30 min.
The venous blood was collected from the left jugular vein using a heparinized 1-mL syringe before administration (0 min), 15, 30, 45, 60, 90, 120, 180, and 240 min after administration. The blood samples were analyzed for Na+, K+, Cl−, pH, HCO3−, base excess (BE), total carbon dioxide (TCO2), carbon dioxide pressure (PCO2), glucose (GLU), hematocrit value (Ht), and hemoglobin (Hb) using an automatic analyzer (i-STAT 200A, Abbott Japan LLC., Matsudo, Japan) at 37°C within 5 min of collection. The changes in relative plasma volume (rPV) were calculated from Hb and Ht, using the accepted formulas [19].
Statistical software was used for all the statistical analyses (StatLight, version 2.0, Yukms Co., Ltd., Tokyo, Japan). First, Bartlett’s test was performed to confirm equal variances within each group. Then, the data were analyzed by one-way ANOVA to confirm significant changes after administration. Finally, the Dunnett’s test was used to analyze whether the data of each point differed from pre-administration. In the comparison between the ISBS and ISBD group, F test was performed to confirm the variance at each point, and then the data were compared using the Student’s t-test or Welch’s t-test based on the results. P-values <0.05 were considered significant. Herein, the data is reported as the means ± standard deviation (SD).
RESULTS
The blood pH of the ISBS and ISBD groups were 7.44 ± 0.02 and 7.41 ± 0.02 before administration and increased to 7.49 ± 0.02 and 7.43 ± 0.02 after 30 min, respectively. The pH due to ISBS was maintained at significantly higher values than ISBD from 45 to 90 min (Fig. 1). The HCO3− levels of the ISBS and ISBD groups were 29.6 ± 1.9 and 29.0 ± 1.1 mM at 0 min and increased to 36.9 ± 2.3 and 33.5 ± 1.9 mM at 30 min, respectively (Fig. 1). The ISBS group showed significantly higher HCO3− levels than the ISBD group at 30, 45 and 90 min (Fig. 1). The BE levels of the ISBS and ISBD groups were 5.3 ± 2.1 and 4.5 ± 1.3 mM at 0 min and increased to 13.5 ± 2.6 and 9.5 ± 1.7 mM at 30 min, respectively (Fig. 1). The ISBS group showed significantly higher BE levels than the ISBD group at 30, 45, 90, and 240 min (Fig. 1).
Fig. 1.

Graphs depicting the blood pH, HCO3− and base excess (BE) levels in calves given ISBS and ISBD. The alphabet (a) indicates the data were significantly different at each time point between ISBS and ISBD groups using the Student’s t-test or Welch’s t-test. ISBS: isotonic NaHCO3 solution, ISBD: ISBS with 4.03% dextrose. Daggers (†) and asterisks (*) indicate the data was significantly different from the pre-value (Time=0 hr) at each measurement time point after the administration of ISBS and ISBD using Dunnett’s test.
The TCO2 levels of ISBS group was 30.8 ± 1.7 mM at 0 min and increased to 38.3 ± 2.2 mM at 30 min. These levels increased significantly from 15 to 60 min. In ISBD group, the TCO2 levels were higher than pre-administration at 15, 180 and 240. This increased to the highest level of 35.3 ± 2.2 mM at 180 min (Fig. 2). The PCO2 level of ISBS group increased to 48.8 ± 1.4 mmHg at 30 min (Fig. 2).
Fig. 2.

Graphs depicting the blood TCO2 and PCO2 levels in calves given ISBS and ISBD. The alphabet (a) indicates the data were significantly different at each time point between ISBS and ISBD groups using the Student’s t-test or Welch’s t-test. ISBS: isotonic NaHCO3 solution, ISBD: ISBS with 4.03% dextrose. Daggers (†) and asterisks (*) indicates the data was significantly different from the pre-value (Time=0 hr) at each measurement time point after the administration of ISBD using Dunnett’s test.
The rPV of the ISBS group increased to 115.0 ± 6.7% at 15 min. In the ISBD group, the rPV increased to 118.0 ± 5.4% at 30 min, and tended to be higher than the maximum level of the ISBS group (Fig. 3). The GLU levels increased from 88.8 ± 12.0 mg/dL to 356.8 ± 32.0 mg/dL in the ISBD group (Fig. 3).
Fig. 3.
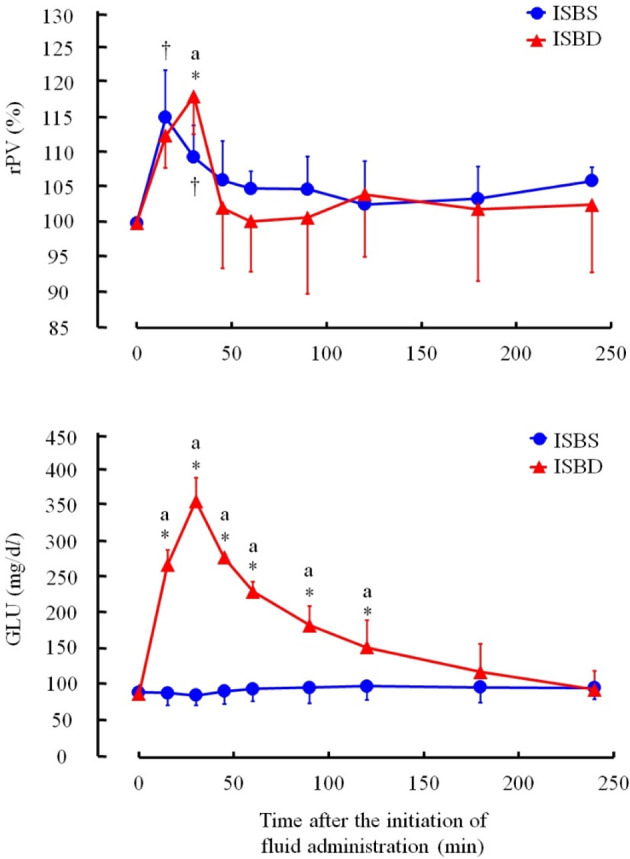
Graphs depicting the rPV and glucose (GLU) levels in calves given ISBS and ISBD. The alphabet (a) indicates the data were significantly different at each time point between ISBS and ISBD groups using the Student’s t-test or Welch’s t-test. ISBS: isotonic NaHCO3 solution, ISBD: ISBS with 4.03% dextrose. Daggers (†) and asterisks (*) indicate the data was significantly different from the pre-value (Time=0 hr) at each measurement time point after the administration of ISBS and ISBD using Dunnett’s test.
No significant changes were confirmed in the Na+ levels of either group (Fig. 4). The K+ level of the ISBS group tended to decrease with the administration, but no significant difference was observed (Fig. 4). In the ISBD group, the K+ level decreased significantly from 4.08 ± 0.31 to 3.18 ± 0.29 mM after 45 min, and the level at 120 min remained lower than that at 0 min. The Cl− levels of both groups decreased 30 min after administration (Fig. 4).
Fig. 4.

Graphs depicting the blood Na+, K+ and Cl− levels in calves given ISBS and ISBD. ISBS: isotonic NaHCO3 solution, ISBD: ISBS with 4.03% dextrose. Dagger (†) and asterisks (*) indicate the data was significantly different from the pre-value (Time=0 hr) at each measurement time point after the administration of ISBS and ISBD using Dunnett’s test.
DISCUSSION
The present study compared the alkalizing abilities of ISBS and ISBD in healthy calves. In the ISBS group, we observed that the pH, HCO3−, and BE increased, as expected. The BE increased by about 10 mM compared with the concentration before administration. In contrast, the ISBD data did not increase as much as those of ISBS. Therefore, it was revealed that ISBS had better alkalizing ability than ISBD.
ISBS is known to be safe and slowly improve acidosis and rPV [5, 11]. In this study, the TCO2 increased significantly in ISBS and ISBD group. Especially, TCO2 of ISBS group changed according to the levels of HCO3− and BE. It was considered that the carbonic acid-bicarbonate buffer system acted by administration of ISBS. However, PCO2 increased only slightly at 30 min in the ISBS group. These changes were not considered to affect severely. Therefore, similar to previous studies, we observed that ISBS increased HCO3−, BE, and rPV without significantly affecting PCO2 and electrolytes. The results suggest that ISBS was a suitable fluid solution for the improvement of calves presenting dehydration and acidosis.
On the other hand, ISBD tended to have a lower alkalinizing ability than ISBS. Furthermore, ISBS and ISBD contained the same amount of NaHCO3 but did not have the same effects on the calves. For example, the effects of ISBD on rPV, GLU, and electrolytes were different from those of ISBS. The osmolarity ratio of ISBS was 1, whereas that of ISBD was about 2. When a solution with a high osmolarity ratio is administered intravenously, the intracellular and interstitial fluid temporarily move to blood vessels, increasing rPV [21]. An increase in the rPV was one of the factors that suppressed the rise of blood pH caused by dilutional acidemia. When NaHCO3 is administered into the blood vessel, it moves H+ from the intracellular to the extracellular fluid, and K+ is pulled into the cells [4, 25]. The K+ level decreased when both solutions were administered; however, the level is significantly lower for ISBD than for ISBS. When blood glucose is absorbed into the cell, K+ also moves into the cell [9, 15, 25]. The transport of K+ and H+ accompanying the absorption of blood glucose was also considered to be the second factor that prevented the increase in blood pH. In diarrhea of calves, not only dehydration and metabolic acidosis but also hyperkalemia is one of the serious pathological conditions [7, 12, 22, 25]. In addition, it has been reported that hypoglycemia often occur in calf diarrhea and administration of intravenous dextrose is effective for the condition [23, 26]. Although the alkalinizing ability is lower compared with ISBS, ISBD may be a suitable fluid solution for diarrhea of calves with hyperkalemia and hypoglycemia.
Moreover, ISBD is a combination of 7% hypertonic NaHCO3 and 5% dextrose solutions, which has a pH slightly higher than the ISBS and 7% NaHCO3 solutions (Table 1). When acidic dextrose or saline solutions are mixed with alkaline NaHCO3 solution, CO2 gas is generated, and the pH of the solution changes [14, 28]. However, only minimal amounts of gas are generated, and the concentration of HCO3− in the solution is almost unchanged [14, 28]. The pH standard of NaHCO3 solution is 7.0–8.5 [17], and the pH of ISBD is in this range. Therefore, the amounts of HCO3− contained in ISBS and ISBD are believed to be similar.
In conclusion, ISBS and ISBD contain the same concentration of NaHCO3, but the solutions with or without dextrose in them have different effects on the blood of calves. The solution containing dextrose enhances the increase of rPV and decrease of blood K+ level but reduces the alkalizing ability compared with ISBS. Thus, we observed that ISBS had better alkalizing ability than ISBD.
CONFLICT OF INTEREST
The authors declare no conflicts of interest.
REFERENCES
- 1.Abeysekara S, Zello GA, Lohmann KL, Alcorn J, Hamilton DL, Naylor JM. 2012. Infusion of sodium bicarbonate in experimentally induced metabolic acidosis does not provoke cerebrospinal fluid (CSF) acidosis in calves. Can J Vet Res 76: 16–22. [PMC free article] [PubMed] [Google Scholar]
- 2.Berchtold JF, Constable PD, Smith GW, Mathur SM, Morin DE, Tranquilli WJ. 2005. Effects of intravenous hyperosmotic sodium bicarbonate on arterial and cerebrospinal fluid acid-base status and cardiovascular function in calves with experimentally induced respiratory and strong ion acidosis. J Vet Intern Med 19: 240–251. doi: 10.1111/j.1939-1676.2005.tb02688.x [DOI] [PubMed] [Google Scholar]
- 3.Constable PD, Stämpfli HR, Navetat H, Berchtold J, Schelcher F. 2005. Use of a quantitative strong ion approach to determine the mechanism for acid-base abnormalities in sick calves with or without diarrhea. J Vet Intern Med 19: 581–589. [DOI] [PubMed] [Google Scholar]
- 4.Constable PD, Trefz FM, Sen I, Berchtold J, Nouri M, Smith G, Grünberg W. 2021. Intravenous and oral fluid therapy in neonatal calves with diarrhea or sepsis and in adult cattle. Front Vet Sci 7: 603358. doi: 10.3389/fvets.2020.603358 [DOI] [PMC free article] [PubMed] [Google Scholar]
- 5.Coskun A, Sen I, Guzelbektes H, Ok M, Turgut K, Canikli S. 2010. Comparison of the effects of intravenous administration of isotonic and hypertonic sodium bicarbonate solutions on venous acid-base status in dehydrated calves with strong ion acidosis. J Am Vet Med Assoc 236: 1098–1103. doi: 10.2460/javma.236.10.1098 [DOI] [PubMed] [Google Scholar]
- 6.Demigné C, Rémésy C. 1979. Evolution of the postnatal metabolism in the healthy or diarrhoeic calf. Ann Rech Vet 10: 23–31. [PubMed] [Google Scholar]
- 7.Fisher EW, McEwan AD. 1967. Death in neonatal calf diarrhea. Pt. II: The role of oxygen and potassium. Br Vet J 123: 4–7. doi: 10.1016/S0007-1935(17)40202-8 [DOI] [Google Scholar]
- 8.Groutides CP, Michell AR. 1990. Changes in plasma composition in calves surviving or dying from diarrhoea. Br Vet J 146: 205–210. doi: 10.1016/S0007-1935(11)80003-5 [DOI] [PubMed] [Google Scholar]
- 9.Grünberg W, Morin DE, Drackley JK, Barger AM, Constable PD. 2006. Effect of continuous intravenous administration of a 50% dextrose solution on phosphorus homeostasis in dairy cows. J Am Vet Med Assoc 229: 413–420. doi: 10.2460/javma.229.3.413 [DOI] [PubMed] [Google Scholar]
- 10.Hartmann H, Berchtold J, Hofmann W. 1997. Pathophysiologische Aspekte der Azidose bei durchfalkranken Kälbern. Tierarztl Umsch 52: 568–574 (in German). [Google Scholar]
- 11.Iwabuchi S, Suzuki K, Abe I, Asano R. 2003. Comparison of the effects of isotonic and hypertonic sodium bicarbonate solutions on acidemic calves experimentally induced by ammonium chloride administration. J Vet Med Sci 65: 1369–1371. doi: 10.1292/jvms.65.1369 [DOI] [PubMed] [Google Scholar]
- 12.Lewis L, Phillips R. 1973. Diarrheic induced changes in intracellular and extracellular ion concentrations in neonatal calves. Ann Rech Vet 4: 99–111. [Google Scholar]
- 13.Michell AR, Bywater RJ, Clarke KW, Hall LW, Watermann AE. 1989. Quantitative aspects of fluid therapy. pp. 104–120. In: Veterinary Fluid Therapy, Blackwell Scientific Publication, Hoboken. [Google Scholar]
- 14.Naorungroj T, Neto AS, Fujii T, Jude B, Udy A, Bellomo R. 2020. Stability of bicarbonate in normal saline: a technical report. Crit Care Resusc 22: 83–85. [DOI] [PMC free article] [PubMed] [Google Scholar]
- 15.Rosić NK, Standaert ML, Pollet RJ. 1985. The mechanism of insulin stimulation of (Na+,K+)-ATPase transport activity in muscle. J Biol Chem 260: 6206–6212. doi: 10.1016/S0021-9258(18)88958-X [DOI] [PubMed] [Google Scholar]
- 16.Rumbaugh GE, Carlson GP, Harrold D. 1981. Clinicopathologic effects of rapid infusion of 5% sodium bicarbonate in 5% dextrose in the horse. J Am Vet Med Assoc 178: 267–271. [PubMed] [Google Scholar]
- 17.Shiozaki Y. 2016. Sodium Bicarbonate Injection. pp. 1566–1567. In: The Japanese Pharmacopoeia, 17th ed., Ministry of Health, Labour and Welfare, Tokyo. [Google Scholar]
- 18.Suzuki K, Abe I, Iwabuchi S, Tsumagari S, Matsumoto T, Asano R. 2002. Evaluation of isotonic sodium bicarbonate solution for alkalizing effects in conscious calves. J Vet Med Sci 64: 699–703. doi: 10.1292/jvms.64.699 [DOI] [PubMed] [Google Scholar]
- 19.Suzuki K, Ajito T, Kadota E, Ohashi S, Iwabuchi S. 1997. Comparison of commercial isotonic fluids intravenously administered to rehydrate fasted bullocks. J Vet Med Sci 59: 689–694. doi: 10.1292/jvms.59.689 [DOI] [PubMed] [Google Scholar]
- 20.Suzuki K, Kato T, Tsunoda G, Iwabuchi S, Asano K, Asano R. 2002. Effect of intravenous infusion of isotonic sodium bicarbonate solution on acidemic calves with diarrhea. J Vet Med Sci 64: 1173–1175. doi: 10.1292/jvms.64.1173 [DOI] [PubMed] [Google Scholar]
- 21.Suzuki K, Okumura J, Abe I, Iwabuchi S, Kanayama K, Asano R. 2002. Effect of isotonic and hypotonic lactated ringer’s solutions with dextrose intravenously administered to dehydrated heifers. J Vet Med Sci 64: 335–340. doi: 10.1292/jvms.64.335 [DOI] [PubMed] [Google Scholar]
- 22.Sweeney RW. 1999. Treatment of potassium balance disorders. Vet Clin North Am Food Anim Pract 15: 609–617. doi: 10.1016/S0749-0720(15)30166-3 [DOI] [PubMed] [Google Scholar]
- 23.Tennant B, Harrold D, Reina-Guerra M. 1968. Hypoglycemia in neonatal calves associated with acute diarrhea. Cornell Vet 58: 136–146. [PubMed] [Google Scholar]
- 24.Tennant B, Harrold D, Reina-Guerra M. 1972. Physiologic and metabolic factors in the pathogenesis of neonatal enteric infections in calves. J Am Vet Med Assoc 161: 993–1007. [PubMed] [Google Scholar]
- 25.Trefz FM, Constable PD, Sauter-Louis C, Lorch A, Knubben-Schweizer G, Lorenz I. 2013. Hyperkalemia in neonatal diarrheic calves depends on the degree of dehydration and the cause of the metabolic acidosis but does not require the presence of acidemia. J Dairy Sci 96: 7234–7244. doi: 10.3168/jds.2013-6945 [DOI] [PubMed] [Google Scholar]
- 26.Tsukano K, Kato S, Sarashina S, Abe I, Ajito T, Ohtsuka H, Suzuki K. 2017. Effect of acetate Ringer’s solution with or without 5% dextrose administered intravenously to diarrheic calves. J Vet Med Sci 79: 795–800. doi: 10.1292/jvms.16-0297 [DOI] [PMC free article] [PubMed] [Google Scholar]
- 27.Van Metre DC, Tennat BC, Whitlock RH. 2016. Infectious diseases of the gastrointestinal tract. pp. 200–294. In: Rebhun’s Diseases of Dairy Cattle, 3rd ed. (Peek S, Divers TJ eds.), Saunders, St. Louis. [Google Scholar]
- 28.Wear J, McPherson TB, Kolling WM. 2010. Stability of sodium bicarbonate solutions in polyolefin bags. Am J Health Syst Pharm 67: 1026–1029. doi: 10.2146/ajhp090301 [DOI] [PubMed] [Google Scholar]