Abstract
Objective
Hyperhomocysteinemia (HHcy), as an important risk factor for Alzheimer’s disease (AD), would aggravate cognitive dysfunction. This study aimed to investigate whether and to what degree the homocysteine (Hcy) levels in blood and cerebrospinal fluid (CSF) were elevated in AD patients compared with healthy controls and to explore the factors related to the elevated Hcy levels in AD patients.
Methods
PubMed and Embase databases were searched to identify eligible studies, and study quality was evaluated using the Newcastle-Ottawa Quality Assessment Scale. Ratio of mean (RoM) Hcy concentrations was used as a measure of fold-change between AD patients and healthy control subjects.
Results
We identified 35 eligible studies, consisting a total of 2172 patients with AD and 2289 healthy controls. The pooled results showed that patients with AD had a significantly higher blood level of Hcy (RoM, 1.32; 95% CI, 1.25–1.40; p<0.001) than controls did, with large heterogeneity across studies (I2=81.4%, p<0.001). Hcy level in CSF did not differ significantly between patients with AD than controls (RoM, 1.12; 95% CI, 0.90–1.39, p=0.293; I2=69.4%, p=0.02). A random effects meta-regression analysis revealed that there was an inverse correlation between the blood levels of Hcy and folate (p=0.006). There was no link found between the blood levels of vitamin B12, or the Mini-Mental Status Examination scores reflecting the degree of cognitive impairment, and blood levels of Hcy.
Conclusion
Regardless of dementia severity, there is an approximate one-third increase in blood Hcy in AD patients, which is robustly associated with a decreased level of blood folate in AD, but not with that of blood vitamin B12 nor the degree of dementia. Future investigation on the cause-and-effect link between Hcy and folate is warranted to clarify this issue.
Keywords: homocysteine, Alzheimer’s disease, meta-regression
Introduction
Alzheimer’s disease (AD) is the most common form of dementia, and may account for 60–80% of all dementia types.1 At present, it is believed that the two most prominent pathological characteristics in AD pathogenesis are beta-amyloid deposition and neurofibrillary tangle formation.2 It is a progressive neurodegenerative disease, with typical symptoms of progressive memory loss, and cognitive dysfunction,3,4 exerting a heavy economic burden on society and families.5 AD is closely positively associated with a variety of risk factors such as ageing, ApoE4 genotype, hyperglycemia, and so on.6 With the development of AD-relevant research, much effort has been made to identify effective biomarkers of AD.7 A growing number of studies have shown that elevated level of blood homocysteine (Hcy) is an important and independent risk factor and biomarker independent of B vitamins for AD.8,9
In many studies, the blood Hcy level has been found to be higher in AD patients than in control subjects.10,11 However, several studies have found null association between the blood Hcy level and AD.12,13 Furthermore, although most studies found increases in the blood Hcy concentrations in AD patients, the extent to which elevated Hcy levels are in AD patients is less certain. Our previous meta-analytic study found that a 5 μmol/L increment of Hcy level increased the incident risk of AD by 15% in prospective cohort studies,14 suggesting that an increased level of blood Hcy appears to play a causal role in the development of AD. Since hyperhomocysteinemia (HHcy) is an independent risk factor for AD, what induces the elevated level of Hcy? It has been widely believed that folate, vitamin B12 and Hcy may impact on AD.15 It is well-known that the B-vitamins, in particular folate and B12, are major determinants of Hcy, and previous studies found that low serum folate and low serum B12 were also associated with AD risk.16,17 These connections are needed to be further clarified.
Given the inconsistency in the literature regarding the Hcy level in AD and these above-mentioned questions, by use of a widely applicable method of generating fold change of mean Hcy concentration (ie, ratio of the mean), we performed a meta-analysis of case–control studies to investigate whether and to what extent the Hcy levels in blood and cerebrospinal fluid (CSF) were elevated in AD patients compared with healthy controls, as well as a meta-regression analysis to explore the potential modifiers of the association.
Methods
Search Strategy and Study Selection
The study protocol was registered on PROSPERO with a registration number of CRD42022331060. A systematic literature search was carried out to collect eligible articles in the PubMed and Embase databases up to February 5, 2021. The search strategy was as follows: (cognit*[All Field] OR dementia*[All Field] OR Alzheimer*[All Field]) AND (plasma [All Field] OR serum [All Field] OR blood circula*[All Field] OR “cerebrospinal fluid” [All Field]) AND (homocysteine [All Field] OR hyperhomocysteinemia [All Field]) AND (“case control” [All Field])). All retrieved articles and their references were manually searched for available articles. The included studies met the following criteria: (1) quantifying the Hcy level between AD and control group; (2) samples from plasma, serum or CSF; (3) with case–control design; and (4) reporting means and SDs, or approximate value of Hcy.
Our exclusion criteria were as follows: (1) studies with non-numerical data of the Hcy level; (2) studies investigating vascular dementia and mild cognitive impairment rather than AD; (3) case reports, reviews, comments, or only abstracts available; (3) studies without a healthy control group. Only the article with the largest sample size was selected for articles with overlapping data.
Data Extraction
Two reviewers (ZL and SY) independently extracted relevant data from the included study as follows: first author name, publication year, diagnostic criteria of AD, detection method for Hcy, sample source (serum, plasma or CSF), sample size, age (mean/SD) and female sex (%) of participants per group, mean and standard deviation (SD) of Hcy. Other characteristics of the participants, including body mass index (BMI), Mini-Mental State Examination (MMSE), and the levels of folate and vitamin B12, were also extracted.
To ensure the authenticity of the data, raw data with corresponding units were obtained. When median and inter-quartile range (IQR) or range were presented as measures, we calculated the mean and the SD using the methods described by Luo and Wan18,19 based on sample size and median, IQR, or minimum/maximum values. We conducted separate meta-analyses if three or more studies were present in the same group. Subsequently, data were stratified into different groups by source (plasma and serum) for subgroup analysis.
Statistical Analysis
To estimate the extent of the change in Hcy level, we performed a random-effects meta-analysis based on ratio of mean (RoM) Hcy concentrations: (1) the blood Hcy level in patients with AD vs healthy controls and (2) the CSF Hcy level in patients with AD vs controls. RoM >1 indicates a higher Hcy concentration in patients with AD than controls, and RoM <1 indicates higher concentration in controls. Each RoM was generated in every study, the corresponding 95% confidence intervals (CIs) was calculated using the delta method.20 Continuous data for age, MMSE, vitamin B12 and folate were analyzed using standardized mean difference (SMD). Random-effects single-covariate meta-regression was conducted to assess the effects of folate, vitamin B12 and MMSE on the effect size. Folate, Vitamin B12 and MMSE were included step by step as variables in the meta-regression analyses. In addition, studies that did not provide means or SDs of covariates were excluded from the regression analysis. Between-study heterogeneity was assessed using the Q test and I2 statistics. The Newcastle-Ottawa Quality Assessment Scale (NOS) was used to assess the quality of the enrolled studies. Publication bias was evaluated using the Egger’s and Begg’s tests, as well as visual inspection of the symmetry of funnel plots. The Stata software (version 12.0) was used for all analyses.
Results
Study Selection
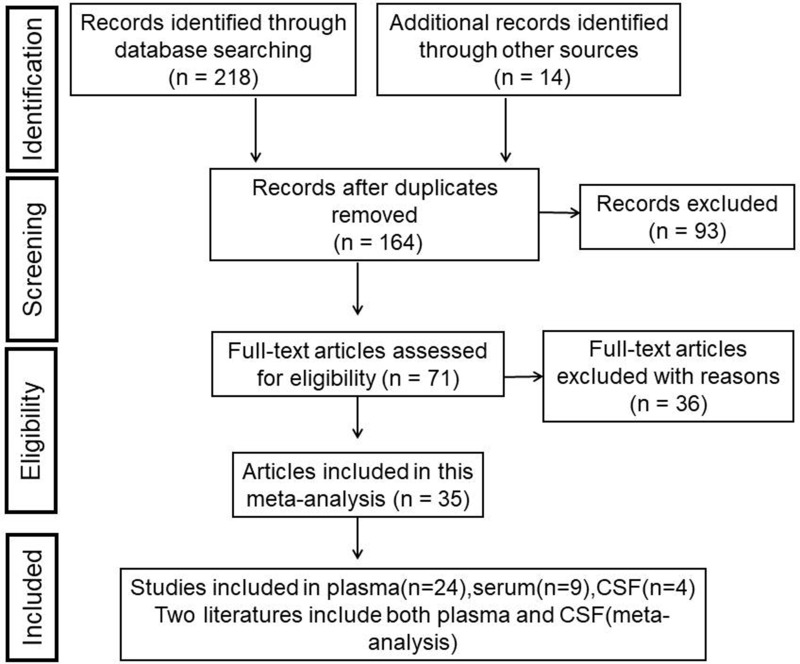
The initial search in both the databases yielded 218 hits, added 14 from hand-searching, with a total of 232 publications. After removing duplicates, we screened titles and abstracts, and excluded 93 studies. After carefully reading and reviewing full-text articles, 36 studies that did not meet the inclusion criteria were excluded. At last, we identified a total of 35 studies, consisting 2172 AD patients and 2289 healthy controls (Figure 1). Among all the studies included, there were 4 studies reported the Hcy levels in CSF21–24 and 33 in blood8,10,11,17,24–51 (24 in plasma and 9 in serum, 2 in both CSF and plasma), 11 studies reported MMSE levels of AD patients and controls, 19 reported the levels of vitamin B12 and 19 reported the levels of folate. Detailed information regarding the characteristics of the included studies was shown in Table 1.
Figure 1.
Study selection flowchart of the meta-analysis.
Table 1.
Characteristics of Studies Included in this Meta-Analysis
| Ref. | Source | AD | Control | Method | NOS | ||||||
|---|---|---|---|---|---|---|---|---|---|---|---|
| % Female | Mean Age(y) | MMSE | n | % Female | Mean Age(y) | MMSE | n | ||||
| Anello25 | Plasma | NR | 71.0 | 180 | NR | 69.5 | 181 | FPIA | 7 | ||
| Arslan26 | Serum | 16.0 | 71.0 | 25 | 20.0 | 71.6 | 25 | ELISA | 7 | ||
| Cascalheira27 | Serum | 52.0 | 75.1 | 27 | 57.0 | 71.0 | 28 | FPIA | 8 | ||
| Cascalheira8 | Serum | 47.4 | 75.6 | 19 | 50.0 | 70.7 | 36 | FPIA | 9 | ||
| Coppede28 | Plasma | 70.2 | 79.0 | 94 | 56.8 | 71.8 | 74 | HPLC | 9 | ||
| da Silva29 | Plasma | 83.0 | 73.8 | 43 | 74.0 | 73.9 | 50 | HPLC | 7 | ||
| D’Cunha10 | Plasma | 55.6 | 79.0 | 21.3±4.6 | 63 | 60.3 | 77.6 | 29±1.5 | 63 | HPLC | 7 |
| de Silva30 | Plasma | 65.2 | 72.0 | 10.7±3.1 | 23 | 61.9 | 70.5 | 27±1.6 | 21 | FPIA | 9 |
| Elhawary31 | Plasma | 67.7 | 69.2 | 43 | 68.8 | 70.7 | 32 | FPIA | 9 | ||
| Fekkes32 | Plasma | 71.4 | 73.6 | 14 | 0.0 | 70.1 | 17 | HPLC | 9 | ||
| Folin33 | Serum | NR | 80.3 | 15.7±6.8 | 79 | NR | 71.2 | 29±0.8 | 24 | HPLC | 9 |
| Gallucci34 | Plasma | 66.4 | 76.9 | 137 | 61.9 | 76.8 | 42 | HPLC | 5 | ||
| Guidi35 | Plasma | 67.6 | 78.0 | 20±4.2 | 71 | 77.3 | 73.0 | 28±0.9 | 44 | Commercial kit | 8 |
| Hagnelius36 | Plasma | 59.5 | 72.7 | 42 | 60.3 | 64.1 | 73 | FPIA | 7 | ||
| Hogervorst37 | Plasma | 60.0 | 73.9 | 15.9±8.1 | 137 | 50.0 | 73.3 | 28.5±1.7 | 277 | HPLC | 9 |
| Janel11 | Plasma | NR | NR | 84 | NR | NR | 36 | HPLC | 5 | ||
| Leblhuber38 | Serum | 79.0 | 74.8 | 19 | 57.9 | 70.2 | 19 | FPIA | 5 | ||
| Lv39 | Serum | 50.0 | NR | 17.0±4.9 | 82 | 50.0 | NR | 28.5±1.2 | 82 | Enzymatic cycling method | 9 |
| Ma40 | Serum | 45.8 | 69.6 | 17.7±6.3 | 131 | 50.8 | 67.0 | 28.6±1.1 | 134 | Enzymatic cycling method | 9 |
| Malaguarnera41 | Plasma | 68.2 | 72.6 | 22 | 50.0 | 73.7 | 24 | HPLC | 6 | ||
| Mansoori42 | Plasma | 32.5 | 66.3 | 80 | 37.5 | 63.8 | 120 | Competitive immunoassay | 9 | ||
| McCaddon43 | Serum | 56.7 | 80.1 | 11±7.8 | 30 | 66.7 | 78.3 | 29±1.6 | 30 | HPLC | 8 |
| Mizrahi44 | Plasma | 61.3 | 89.0 | 75 | 51.6 | 77.0 | 155 | FPIA | 8 | ||
| Nagga45 | Plasma | 57.5 | 74.7 | 47 | 48.5 | 69.0 | 101 | FPIA | 5 | ||
| Nazef46 | Serum | 56.2 | 72.6 | 15.1±6.2 | 41 | 47.8 | 66.3 | 26.7±2.9 | 46 | FPIA | 9 |
| Pollak51 | Plasma | 78.3 | 85.0 | 92 | 74.4 | 82.0 | 82 | Amino acid analysis with post-column | 9 | ||
| Postiglione17 | Plasma | 39.2 | 68.0 | 74 | 43.2 | 68.0 | 74 | HPLC | 9 | ||
| Ruiz47 | Plasma | 68.6 | 78.3 | 51 | 66.0 | 60.3 | 53 | 9 | |||
| Selley24 | Plasma/CSF | 48.2 | 77.4 | 27 | 52.0 | 78.4 | 27±0.9 | 25 | Capillary column gas chromatography/mass spectrometry | 8 | |
| Smach22 | Plasma/CSF | 44.3 | 73.2 | 15±7.7 | 70 | 36.7 | 73.5 | 30 | FPIA | 9 | |
| Tannorella48 | Plasma | 59.2 | 76.9 | 120 | 55.7 | 76.3 | 115 | HPLC | 9 | ||
| Villa59 | Plasma | 56.3 | 70.8 | 20 | 53.3 | 74.7 | 18 | HPLC | 9 | ||
| Weiner50 | Plasma | 62.0 | 76.7 | 17.8±6.9 | 30 | 62.0 | 74.9 | 28.5±1.6 | 39 | HPLC | 8 |
| Isobe23 | CSF | 61.1 | 67.4 | 18 | 40.0 | 67.4 | 15 | HPLC | 5 | ||
| Popp21 | CSF | 74.1 | 73.0 | 21.3±4.3 | 54 | 44.9 | 73.0 | 29.7±0.6 | 98 | HPLC | 9 |
Association of Hcy Levels with AD
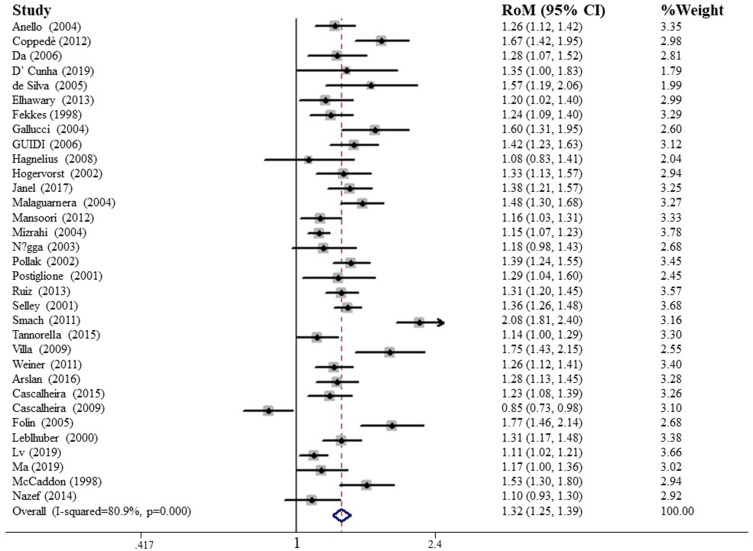
Of the eligible studies, 33 had data on the Hcy levels in blood. There were 2172 patients with AD and 2289 healthy controls. RoM was applied to estimate to which degree the blood Hcy level was elevated in AD patients relative to healthy controls. Figure 2 shows the forest plots for RoM blood Hcy levels of AD to controls. The pooled results showed that the RoM of AD/controls in the blood Hcy level was 1.32 (95% CI, 1.25–1.40, p<0.001), with large heterogeneity across studies (I2=81.4%, p<0.001), indicating that AD patients have an over 30% increased blood Hcy level.
Figure 2.
Forest plots of AD to control ratio in blood Hcy levels.
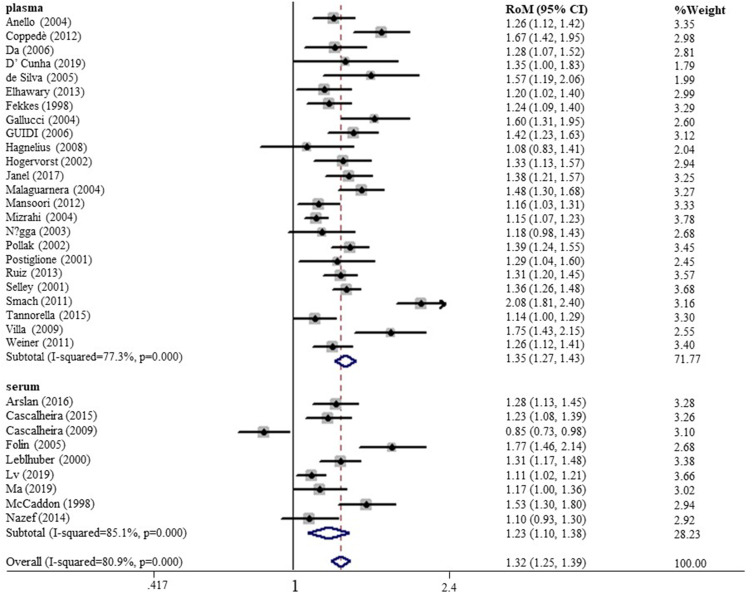
A subgroup analysis based on blood composition (plasma/serum) was performed to investigate a source of heterogeneity among studies. The subgroup analysis showed that the Hcy level significantly differed between AD and controls in plasma (RoM, 1.31; 95% CI, 1.22–1.40, p < 0.001; I2=84.5%, p<0.001) and in serum (RoM, 1.37; 95% CI, 1.28–1.47, p < 0.001; I2=49.6%, p<0.05), suggesting that the effect size and heterogeneity of effects were obviously independent of plasma and serum samples (Figure 3).
Figure 3.
Subgroup meta-analysis of AD to control in blood Hcy levels.
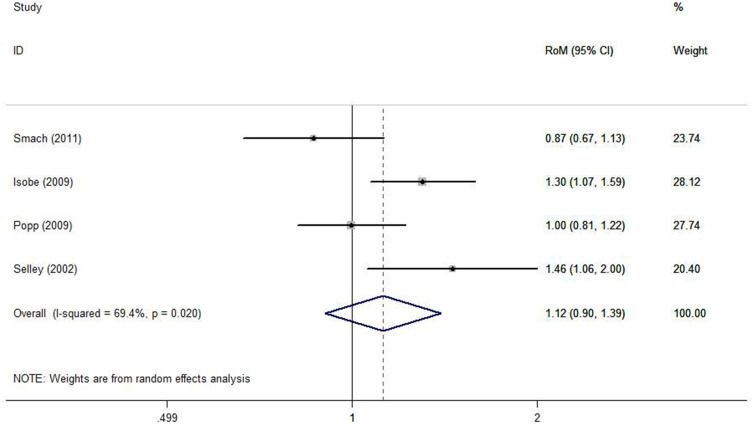
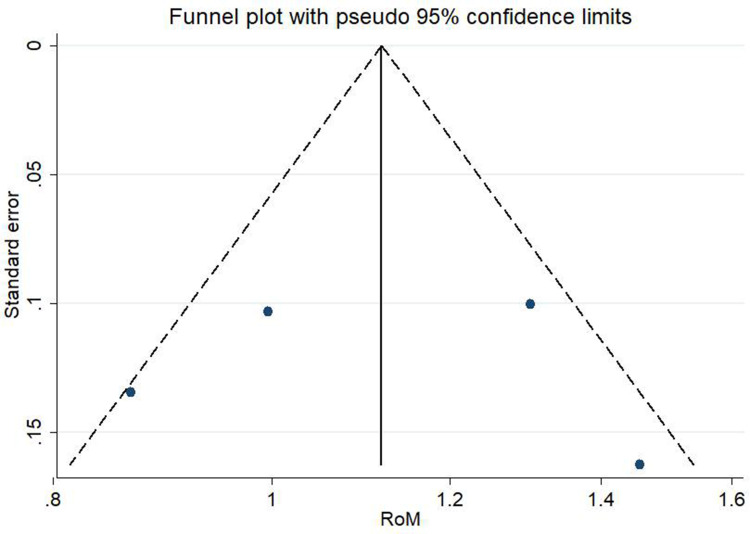
To assess whether the CSF Hcy level significantly differed between patients with AD and healthy controls, 4 studies consisting of 150 patients and 149 controls, were included. The pooled result showed that the pooled RoM of AD to controls in the CSF Hcy level was 1.12 (95% CI, 0.90–1.39, p=0.293), with considerable heterogeneity among studies (I2=69.4%, p = 0.02, Figure 4).
Figure 4.
Forest plot of AD to control ratio in CSF Hcy levels.
Meta-Regression Analyses
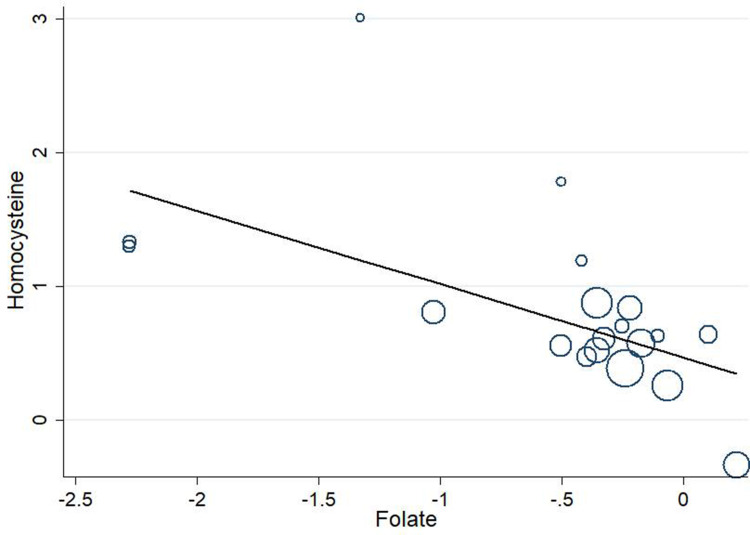
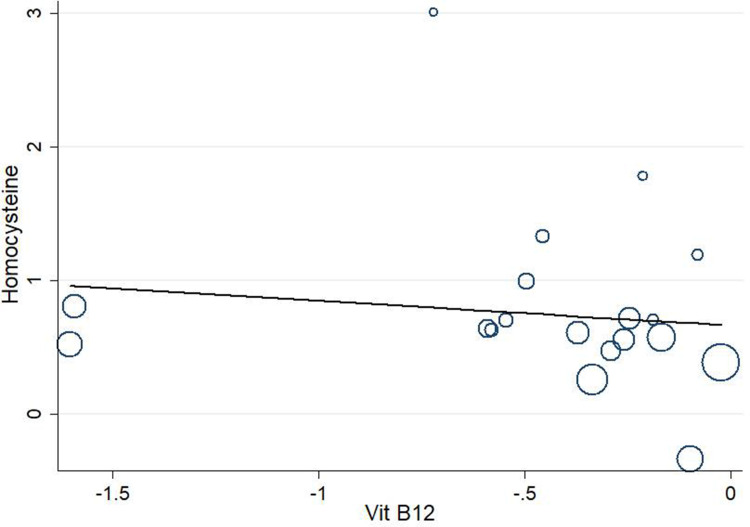
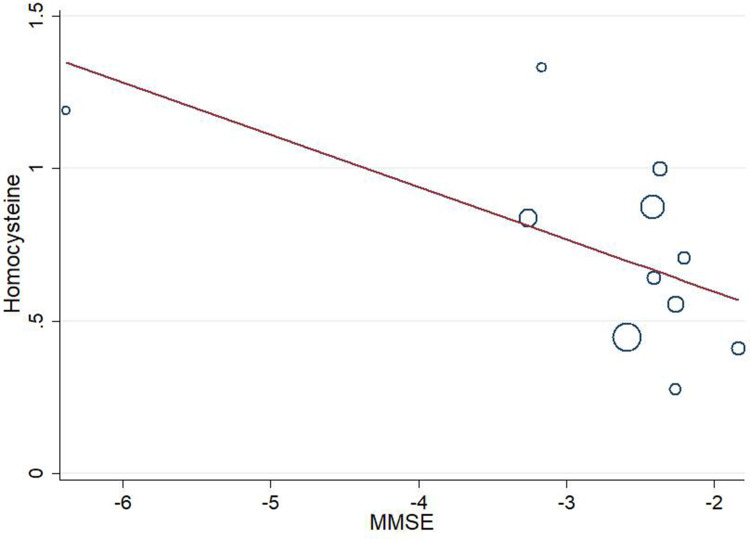
To further explore sources of heterogeneity, a stepwise univariate meta-regression was performed to examine the effects of several key study population characteristics (folate, vitamin B12, MMSE) on the effect size. The results of meta-regression analyses revealed that the blood folate level was inversely associated with the blood Hcy level (95% CI, −0.9163 to −0.1810, p=0.006, Figure 5). No statistical significant associations were observed among MMSE and vitamin B12 (95% CI, −0.3709 to 0.2831, p=0.084; 95% CI, −0.8756 to 0.5044, p=0.578; Figure 6 and Figure 7, respectively). For age, no significance was found (data not shown).
Figure 5.
Meta-regression scatter plot of blood Hcy and folate levels. Random effect meta-regression plot of the impact of blood folate standardized on blood Hcy levels. The size of each circle is inversely proportional to the variance of the estimates (p = 0.006).
Figure 6.
Meta-regression scatter plot of blood Hcy against blood vitamin B12 levels. Random effect meta-regression plot of the impact of blood vitamin B12 standardized on blood Hcy levels. The size of each circle is inversely proportional to the variance of the estimates (p = 0.084).
Figure 7.
Meta-regression scatter plot of blood Hcy against MMSE score. Random effect meta-regression plot of the impact of MMSE standardized on blood Hcy levels. The size of each circle is inversely proportional to the variance of the estimates (p = 0.131).
Study Quality, Publication Bias and Sensitivity Analysis
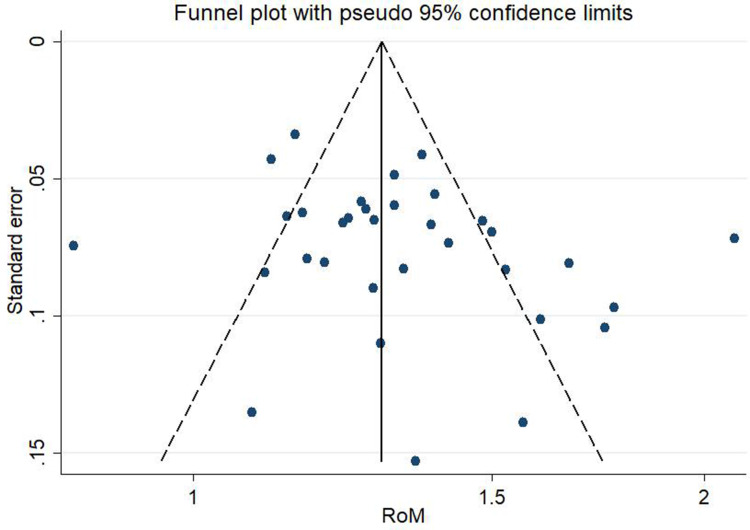
We used the NOS scale to evaluate the study quality, with high-quality scores ranging from 5 to 9 (Table 1). We used the Begg’s and Egger’s tests to assess publication bias. In the comparison of blood Hcy levels between patients with AD and controls, there was no evidence of publication bias (Begg’s test: p=0.15, Egger’s test: p=0.07), which was also confirmed by the symmetry of the funnel plot (Figure 8). In the comparison of CSF Hcy level between patients with AD and controls, we also did not find potential publication bias (Begg’s test: p=0.73, Egger’s test: p=0.91, as well as the symmetry of the funnel plot, see Figure 9). The sensitivity analysis demonstrated that the summarized estimate was not substantially altered by removal of a single study.
Figure 8.
Funnel plot of the blood Hcy levels for assessing the publication bias.
Figure 9.
Funnel plot of the CSF Hcy levels for assessing the publication bias.
Discussion
Summary of Evidence
In this meta-analysis, we brought together available the Hcy level data from 35 case–control studies comprising 2172 AD patients and 2289 healthy controls. Our pooled results revealed that AD patients had a 32% increase in the blood Hcy level. Furthermore, the meta-regression study has unexpectedly confirmed that blood Hcy level is inversely associated to the blood folate concentration, implying that the lower the blood folate concentration is, the higher the blood Hcy level is. Given that HHcy is an independent risk factor of AD, a drop in level of folate, but not vitamin B12, could play a crucial role in causing the elevated Hcy level in AD patients, albeit the cause-outcome association is needed to be further investigated. The level of Hcy in CSF, however, was not significantly altered.
Exploration of Heterogeneity and Publication Bias
According to the NOS scores, the included studies had low risk of bias. In the current meta-analysis, there was high between-study heterogeneity for all the comparisons, indicating that quantification method of Hcy appeared to contribute to most of the observed heterogeneity. The meta-regression analyses demonstrated that this heterogeneity might, at least in part, be explained by the decreased folate level in blood, although neither the blood vitamin B12 level nor MMSE score was significantly associated with the blood Hcy level. Sensitivity analyses showed that exclusion of any single study did not substantially alter the primary estimate, which further confirmed the consistency in the direction and magnitude of the current findings. There was no obvious evidence of publication bias in all the analyses according to the Egger’s and Begg’s tests, as well as the symmetry of funnel plots.
Comparisons with Other Studies
A recent meta-analysis of case–control studies has reported that there were higher level of Hcy and lower levels of folate in AD than in non-demented controls.52 Another meta-analysis also indicated that AD was significantly correlated with a high Hcy level and a low folate level.53 However, in the above-mentioned studies the meta-regression meta-analysis failed to be performed, nor were the related factors closely associated with the increased Hcy level explored. In our meta-analysis, although also recognizing that AD patients had a significantly higher blood level, which was consistent with the previous meta-analysis results, we found that AD patients had an around 30% higher blood Hcy level. Furthermore, in the meta-regression analysis, the potential cause of why the blood Hcy level is increased in AD patients is in that the blood level of folate in AD was substantially lowered. Whereas, the aspect was not addressed in the previous meta-analyses.
Implication
For the past decade years, there has been controversial discussion regarding whether elevated tHcy is an independent risk factor for Alzheimer’s dementia. Early studies revealed that the elevated Hcy level and the low folate level were considered as potential risk factors for the development of AD,54,55 and plasma total Hcy was strongly influenced by B-group vitamins.56 Moreover, external supplementation of folate,57,58 as well as increased fruit and vegetable consumption,59 has been shown to reduce the total Hcy concentration. In a linear regression with a multi-vitamin model, higher folate concentrations were correlated with better cognitive performances through MMSE score.60 These studies suggested that a folate level was closely associated with better cognitive function. Most prospective studies55,61 have found that after adjusting for B vitamin status, raised tHcy remains associated with cognitive impairment, indicating that HHcy is a risk factor independent of the B vitamins for cognitive impairment. Our previous meta-analysis of prospective cohort studies14 found that an increase in blood Hcy was positively linearly associated with increased relative risk of AD, implying that blood Hcy is an independent risk factor for AD risk.
The cause of why the blood Hcy level in AD patients is increased has been obscure. Above all, the question whether cognitive impairment directly triggers the increase in Hcy is worthy to be explored. It was reported that the plasma tHcy level in AD patients did not increase with time after disease onset, whereas the plasma tHcy concentration correlated with the severity of the disease.62 Although dementia may precede HHcy at later stages (due to feeding difficulties or micronutrient malabsorption), tHcy levels did not increase during 3 years as dementia worsened. The stability of tHcy levels over time and lack of relationship with duration of symptoms appeared to argue against the notion of being a consequence of disease.63 A cross-sectional study on the association between some biomarkers in the elderly showed that plasma Hcy correlated with age, serum creatinine, plasma Aβ40, and was inversely correlated with serum vitamin B12 and folate, indicating that homocysteine seems to be closely related to aging rather than specifically to AD.64 It is a pity that the current study could not provide any evidence of direct effect of AD patients on the blood Hcy level.
Secondly, the questions whether raised tHcy in AD is attributed to other causes, such as B vitamin inadequacy, should also be discussed in detail. Since cognitive impairment would yield changes in diet and lifestyle, this is crucial to exclude the reverse causality, which in turn raise tHcy. Low folate levels were reported to be associated with atrophy of the brain, in particular, with the cortex.65 It has been reported that low dietary folate can promote hippocampal neurodegeneration in amyloid precursor protein mutant transgenic mice.66 It seems that folate deficiency may enhance the methylation of genes and therefore the potential acceleration of processes associated with aging.67 It has been believed that B-group vitamins, in particular, vitamin B12 and folate, can lower the blood Hcy level, then are recommended to be applied to the treatment of HHcy. A study found that 484 of 858 patients with HHcy (56.41%) reached normal serum Hcy levels with post-treatment of folic acid (5 mg/d) for 3 months, and up to 43.59% of the patients still failed to reach the normal range, suggesting that the efficiency of folic acid treatment of HHcy is low, and there are complicated underlying mechanisms by which the blood Hcy level in AD patients is increased.68 Clinical trials regarding lowering Hcy levels via B vitamin supplementation have been lacking and inability to properly test the hypothesis that lowering Hcy can slow and/or prevent cognitive decline.69 The current meta-analytic result supports that in AD the elevated Hcy level is robustly associated with the decreased level of folate, but not that of vitamin B12.
What can be said is that many different biological mechanisms are known that could link raised blood Hcy to AD pathology. Li et al70 reported that in 3×Tg mice the high levels of Hcy induced by diet promoted tau phosphorylation at T231/S235 sites, and there were no differences in total tau protein levels with or without high Hcy. It was shown that in cultured neurons using a tetracycline-off system, Hcy (10–1000 μmol/L) activated tau phosphokinases (glycogen synthase kinase 3 and cyclin-dependent kinase 5), and inhibited protein phosphatase 2A (a main tau phosphatase), leading to increases in phosphorylated tau levels, as well as rises of tau aggregates and truncated tau species.71,72 Diet-induced elevation of Hcy levels results in an exacerbation of all 3 major pathological features of the AD phenotype: memory deficits, and Aβ and tau neuropathology.70 It was shown that raised plasma tHcy and raised CSF S-adenosyl-homocysteine were associated with increased levels of CSF P-tau.73 Furthermore, normalization of HHcy improved cognitive deficits and ameliorated brain amyloidosis of a transgenic mouse AD model.74 Therefore, hyperhomocysteinemia might increase the risk of Alzheimer-type dementia by aggravating AD-like lesions.
Strengths and Limitations
There were some strengths of this meta-analysis that should be noted. First, one of the major strengths of the current study is that the performance of the Hcy level in discriminating AD from controls did not depend on the great variability between laboratories and tests. RoM (ratio of mean Hcy concentration), as a new measure for continuous outcomes, provided valuable information for the change degree of the Hcy levels in AD to controls. We used RoM as a measure of fold-change between comparison to reduce the variability in chemokine levels. Second, this meta-analysis was unlimited with respect to region and year of publication, recruiting a sufficiently large number of eligible studies, providing comprehensive data on the association between Hcy and AD. Third, we performed detailed subgroup and sensitivity analyses, and a complete quality assessment, which provided reliable and precise estimates. Lastly, studies on the association with Hcy level and other factors were examined.
However, some limitations of our meta-analysis should be addressed. The number of cases included in the study was limited, in particular, for CSF samples. There was substantial heterogeneity among the included studies. Despite having run exhaustive literature searches, we might have potential to miss some eligible studies. Studies were restricted to English language, which is a potential source of reporting bias. Although publication bias was denied by the Egger’s and Begger’s tests, the possibility of undetected bias could not be excluded owing to the limitations of case–control design. We did not consider the degree of dementia, which is a non-ignorable factor leading to the elevated Hcy level. Significant heterogeneity might be influenced by many factors, among which the participants’ characteristics, disease duration, and disease severity might be important. Hence, these limitations must be considered when interpreting the results of this meta-analysis.
Conclusions
Regardless of dementia degree, there is an approximately one-third elevation in the blood Hcy level in AD patients, which is closely associated with a decreased level of blood folic acid in AD. Future research into the cause-and-effect link between folate and Hcy is urgently needed; more case–control studies, with large numbers of participants, are also needed to offer a more exact assessment of the association of the CSF Hcy level with AD.
Funding Statement
The work was supported by the National Natural Science Foundation of China (No. 32160212) and by the Natural Science Foundation of Jiangxi Province (No. 20202BAB206031).
Abbreviations
AD, Alzheimer’s disease; CSF, Cerebrospinal Fluid; MMSE, Mini-mental State Examination; NOS, Newcastle-Ottawa Scale; FPIA, fluorescence polarization immunoassay; ELISA, enzyme linked immunosorbent assay; HPLC, high performance liquid chromatography.
Disclosure
The authors declare no conflicts of interest in this work.
References
- 1.Crous-Bou M, Minguillon C, Gramunt N, Molinuevo JL. Alzheimer’s disease prevention: from risk factors to early intervention. Alzheimers Res Ther. 2017;9(1):71. doi: 10.1186/s13195-017-0297-z [DOI] [PMC free article] [PubMed] [Google Scholar]
- 2.Mondragon-Rodriguez S, Trillaud-Doppia E, Dudilot A, et al. Interaction of endogenous tau protein with synaptic proteins is regulated by N-methyl-D-aspartate receptor-dependent tau phosphorylation. J Biol Chem. 2012;287(38):32040–32053. doi: 10.1074/jbc.M112.401240 [DOI] [PMC free article] [PubMed] [Google Scholar]
- 3.Querfurth HW, LaFerla FM. Alzheimer’s disease. N Engl J Med. 2010;362(4):329–344. doi: 10.1056/NEJMra0909142 [DOI] [PubMed] [Google Scholar]
- 4.Ying H, Jianping C, Jianqing Y, Shanquan Z. Cognitive variations among vascular dementia subtypes caused by small-, large-, or mixed-vessel disease. Arch Med Sci. 2016;12(4):747–753. doi: 10.5114/aoms.2016.60962 [DOI] [PMC free article] [PubMed] [Google Scholar]
- 5.Kuo TC, Zhao Y, Weir S, Kramer MS, Ash AS. Implications of comorbidity on costs for patients with Alzheimer disease. Med Care. 2008;46(8):839–846. doi: 10.1097/MLR.0b013e318178940b [DOI] [PubMed] [Google Scholar]
- 6.Sons JW. 2021 Alzheimer’s disease facts and figures. Alzheimers Dement. 2021;17(3):327–406. doi: 10.1002/alz.12328 [DOI] [PubMed] [Google Scholar]
- 7.Mantzavinos V, Alexiou A. Biomarkers for Alzheimer’s disease diagnosis. Curr Alzheimer Res. 2017;14(11):1149–1154. doi: 10.2174/1567205014666170203125942 [DOI] [PMC free article] [PubMed] [Google Scholar]
- 8.Cascalheira JF, Joao SS, Pinhancos SS, et al. Serum homocysteine: interplay with other circulating and genetic factors in association to Alzheimer’s type dementia. Clin Biochem. 2009;42(9):783–790. doi: 10.1016/j.clinbiochem.2009.02.006 [DOI] [PubMed] [Google Scholar]
- 9.Hooshmand B, Solomon A, Kareholt I, et al. Homocysteine and holotranscobalamin and the risk of Alzheimer disease: a longitudinal study. Neurology. 2010;75(16):1408–1414. doi: 10.1212/WNL.0b013e3181f88162 [DOI] [PubMed] [Google Scholar]
- 10.D’Cunha NM, Georgousopoulou EN, Boyd L, et al. Relationship between B-vitamin biomarkers and dietary intake with apolipoprotein E ε4 in Alzheimer’s disease. J Nutr Gerontol Geriatr. 2019;38(2):173–195. doi: 10.1080/21551197.2019.1590287 [DOI] [PubMed] [Google Scholar]
- 11.Janel N, Alexopoulos P, Badel A, et al. Combined assessment of DYRK1A, BDNF and homocysteine levels as diagnostic marker for Alzheimer’s disease. Transl Psychiatry. 2017;7(6):e1154. doi: 10.1038/tp.2017.123 [DOI] [PMC free article] [PubMed] [Google Scholar]
- 12.Miller JW, Green R, Mungas DM, Reed BR, Jagust WJ. Homocysteine, vitamin B6, and vascular disease in AD patients. Neurology. 2002;58(10):1471–1475. doi: 10.1212/wnl.58.10.1471 [DOI] [PubMed] [Google Scholar]
- 13.Ravaglia G, Forti P, Maioli F, et al. Elevated plasma homocysteine levels in centenarians are not associated with cognitive impairment. Mech Ageing Dev. 2000;121(1–3):251–261. doi: 10.1016/s0047-6374(00)00221-9 [DOI] [PubMed] [Google Scholar]
- 14.Zhou F, Chen S. Hyperhomocysteinemia and risk of incident cognitive outcomes: an updated dose-response meta-analysis of prospective cohort studies. Ageing Res Rev. 2019;51:55–66. doi: 10.1016/j.arr.2019.02.006 [DOI] [PubMed] [Google Scholar]
- 15.Droller H, Dossett JA. Vitamin B12 levels in senile dementia and confusional states. Geriatrics. 1959;14(6):367–373. [PubMed] [Google Scholar]
- 16.Chen H, Liu S, Ji L, et al. Associations between Alzheimer’s disease and blood homocysteine, vitamin B12, and folate: a case-control study. Curr Alzheimer Res. 2015;12(1):88–94. doi: 10.2174/1567205012666141218144035 [DOI] [PubMed] [Google Scholar]
- 17.Postiglione A, Milan G, Ruocco A, Gallotta G, Guiotto G, Di Minno G. Plasma folate, vitamin B(12), and total homocysteine and homozygosity for the C677T mutation of the 5,10-methylene tetrahydrofolate reductase gene in patients with Alzheimer’s dementia. A case-control study. Gerontology. 2001;47(6):324–329. doi: 10.1159/000052822 [DOI] [PubMed] [Google Scholar]
- 18.Luo D, Wan X, Liu J, Tong T. Optimally estimating the sample mean from the sample size, median, mid-range, and/or mid-quartile range. Stat Methods Med Res. 2018;27(6):1785–1805. doi: 10.1177/0962280216669183 [DOI] [PubMed] [Google Scholar]
- 19.Wan X, Wang W, Liu J, Tong T. Estimating the sample mean and standard deviation from the sample size, median, range and/or interquartile range. BMC Med Res Methodol. 2014;14(1):135. doi: 10.1186/1471-2288-14-135 [DOI] [PMC free article] [PubMed] [Google Scholar]
- 20.Friedrich JO, Adhikari NK, Beyene J. Ratio of means for analyzing continuous outcomes in meta-analysis performed as well as mean difference methods. J Clin Epidemiol. 2011;64(5):556–564. doi: 10.1016/j.jclinepi.2010.09.016 [DOI] [PubMed] [Google Scholar]
- 21.Popp J, Lewczuk P, Linnebank M, et al. Homocysteine metabolism and cerebrospinal fluid markers for Alzheimer’s disease. J Alzheimers Dis. 2009;18(4):819–828. doi: 10.3233/JAD-2009-1187 [DOI] [PubMed] [Google Scholar]
- 22.Smach MA, Jacob N, Golmard JL, et al. Folate and homocysteine in the cerebrospinal fluid of patients with Alzheimer’s disease or dementia: a case control study. Eur Neurol. 2011;65(5):270–278. doi: 10.1159/000326301 [DOI] [PubMed] [Google Scholar]
- 23.Isobe C, Abe T, Terayama Y. Homocysteine may contribute to pathogenesis of RNA damage in brains with Alzheimer’s disease. Neurodegener Dis. 2009;6(5–6):252–257. doi: 10.1159/000262443 [DOI] [PubMed] [Google Scholar]
- 24.Selley ML, Close DR, Stern SE. The effect of increased concentrations of homocysteine on the concentration of (E)-4-hydroxy-2-nonenal in the plasma and cerebrospinal fluid of patients with Alzheimer’s disease. Neurobiol Aging. 2002;23(3):383–388. doi: 10.1016/s0197-4580(01 [DOI] [PubMed] [Google Scholar]
- 25.Anello G, Gueant-Rodriguez RM, Bosco P, et al. Homocysteine and methylenetetrahydrofolate reductase polymorphism in Alzheimer’s disease. Neuroreport. 2004;15(5):859–861. doi: 10.1097/00001756-200404090-00025 [DOI] [PubMed] [Google Scholar]
- 26.Arslan A, Tuzun FA, Arslan H, et al. The relationship between serum paraoxonase levels and carotid atherosclerotic plaque formation in Alzheimer’s patients. Neurol Neurochir Pol. 2016;50(6):403–409. doi: 10.1016/j.pjnns.2016.07.002 [DOI] [PubMed] [Google Scholar]
- 27.Cascalheira JF, Goncalves M, Barroso M, et al. Association of the transcobalamin II gene 776C --> G polymorphism with Alzheimer’s type dementia: dependence on the 5, 10-methylenetetrahydrofolate reductase 1298A --> C polymorphism genotype. Ann Clin Biochem. 2015;52(Pt4):448–455. doi: 10.1177/0004563214561770 [DOI] [PubMed] [Google Scholar]
- 28.Coppede F, Tannorella P, Pezzini I, et al. Folate, homocysteine, vitamin B12, and polymorphisms of genes participating in one-carbon metabolism in late-onset Alzheimer’s disease patients and healthy controls. Antioxid Redox Signal. 2012;17(2):195–204. doi: 10.1089/ars.2011.4368 [DOI] [PubMed] [Google Scholar]
- 29.da Silva VC, Ramos FJ, Freitas EM, et al. Alzheimer’s disease in Brazilian elderly has a relation with homocysteine but not with MTHFR polymorphisms. Arq Neuropsiquiatr. 2006;64(4):941–945. doi: 10.1590/s0004-282x2006000600010 [DOI] [PubMed] [Google Scholar]
- 30.de Silva HA, Gunatilake SB, Johnston C, Warden D, Smith AD. Medial temporal lobe atrophy, apolipoprotein genotype, and plasma homocysteine in Sri Lankan patients with Alzheimer’s disease. Exp Aging Res. 2005;31(3):345–354. doi: 10.1080/03610730590948221 [DOI] [PubMed] [Google Scholar]
- 31.Elhawary NA, Hewedi D, Arab A, et al. The MTHFR 677T allele may influence the severity and biochemical risk factors of Alzheimer’s disease in an Egyptian population. Dis Markers. 2013;35(5):439–446. doi: 10.1155/2013/524106 [DOI] [PMC free article] [PubMed] [Google Scholar]
- 32.Fekkes D, van der Cammen TJ, van Loon CP, et al. Abnormal amino acid metabolism in patients with early stage Alzheimer dementia. J Neural Transm. 1998;105(2–3):287–294. doi: 10.1007/s007020050058 [DOI] [PubMed] [Google Scholar]
- 33.Folin M, Baiguera S, Gallucci M, et al. A cross-sectional study of homocysteine-, NO-levels, and CT-findings in Alzheimer dementia, vascular dementia and controls. Biogerontology. 2005;6(4):255–260. doi: 10.1007/s10522-005-2622-3 [DOI] [PubMed] [Google Scholar]
- 34.Gallucci M, Zanardo A, De Valentin L, Vianello A. Homocysteine in Alzheimer disease and vascular dementia. Arch Gerontol Geriatr Suppl. 2004;38:195–200. doi: 10.1016/j.archger.2004.04.027 [DOI] [PubMed] [Google Scholar]
- 35.Guidi I, Galimberti D, Lonati S, et al. Oxidative imbalance in patients with mild cognitive impairment and Alzheimer’s disease. Neurobiol Aging. 2006;27(2):262–269. doi: 10.1016/j.neurobiolaging.2005.01.001 [DOI] [PubMed] [Google Scholar]
- 36.Hagnelius NO, Wahlund LO, Nilsson TK. CSF/serum folate gradient: physiology and determinants with special reference to dementia. Dement Geriatr Cogn Disord. 2008;25(6):516–523. doi: 10.1159/000129696 [DOI] [PubMed] [Google Scholar]
- 37.Hogervorst E, Ribeiro HM, Molyneux A, Budge M, Smith AD. Plasma homocysteine levels, cerebrovascular risk factors, and cerebral white matter changes (leukoaraiosis) in patients with Alzheimer disease. Arch Neurol. 2002;59(5):787–793. doi: 10.1001/archneur.59.5.787 [DOI] [PubMed] [Google Scholar]
- 38.Leblhuber F, Walli J, Artner-Dworzak E, et al. Hyperhomocysteinemia in dementia. J Neural Transm. 2000;107(12):1469–1474. doi: 10.1007/s007020070010 [DOI] [PubMed] [Google Scholar]
- 39.Lv X, Zhou D, Ge B, et al. Association of folate metabolites and mitochondrial function in peripheral blood cells in Alzheimer’s disease: a matched case-control study. J Alzheimers Dis. 2019;70(4):1133–1142. doi: 10.3233/JAD-190477 [DOI] [PubMed] [Google Scholar]
- 40.Ma F, Lv X, Du Y, et al. Association of leukocyte telomere length with mild cognitive impairment and Alzheimer’s disease: role of folate and homocysteine. Dement Geriatr Cogn Disord. 2019;48(1–2):56–67. doi: 10.1159/000501958 [DOI] [PubMed] [Google Scholar]
- 41.Malaguarnera M, Ferri R, Bella R, Alagona G, Carnemolla A, Pennisi G. Homocysteine, vitamin B12 and folate in vascular dementia and in Alzheimer disease. Clin Chem Lab Med. 2004;42(9):1032–1035. doi: 10.1515/CCLM.2004.208 [DOI] [PubMed] [Google Scholar]
- 42.Mansoori N, Tripathi M, Luthra K, et al. MTHFR (677 and 1298) and IL-6-174 G/C genes in pathogenesis of Alzheimer’s and vascular dementia and their epistatic interaction. Neurobiol Aging. 2012;33(5):1003e1–8. doi: 10.1016/j.neurobiolaging.2011.09.018 [DOI] [PubMed] [Google Scholar]
- 43.McCaddon A, Davies G, Hudson P, Tandy S, Cattell H. Total serum homocysteine in senile dementia of Alzheimer type. Int J Geriatr Psychiatry. 1998;13(4):235–239. doi: [DOI] [PubMed] [Google Scholar]
- 44.Mizrahi EH, Bowirrat A, Jacobsen DW, et al. Plasma homocysteine, vitamin B12 and folate in Alzheimer’s patients and healthy Arabs in Israel. J Neurol Sci. 2004;227(1):109–113. doi: 10.1016/j.jns.2004.08.011 [DOI] [PubMed] [Google Scholar]
- 45.Nagga K, Rajani R, Mardh E, Borch K, Mardh S, Marcusson J. Cobalamin, folate, methylmalonic acid, homocysteine, and gastritis markers in dementia. Dement Geriatr Cogn Disord. 2003;16(4):269–275. doi: 10.1159/000072812 [DOI] [PubMed] [Google Scholar]
- 46.Nazef K, Khelil M, Chelouti H, et al. Hyperhomocysteinemia is a risk factor for Alzheimer’s disease in an Algerian population. Arch Med Res. 2014;45(3):247–250. doi: 10.1016/j.arcmed.2014.03.001 [DOI] [PubMed] [Google Scholar]
- 47.Pollak RD, Pollak A, Idelson M, Bejarano-Achache I, Doron D, Blumenfeld A. The C677T mutation in the methylenetetrahydrofolate reductase (MTHFR) gene and vascular dementia. J Am Geriatr Soc. 2000;48(6):664–668. doi: 10.1111/j.1532-5415.2000.tb04725.x [DOI] [PubMed] [Google Scholar]
- 48.Weiner MF, Hynan LS, Rossetti H, et al. The relationship of cardiovascular risk factors to Alzheimer disease in Choctaw Indians. Am J Geriatr Psychiatry. 2011;19(5):423–429. doi: 10.1097/JGP.0b013e3181e89a46 [DOI] [PMC free article] [PubMed] [Google Scholar]
- 49.Tannorella P, Stoccoro A, Tognoni G, et al. Methylation analysis of multiple genes in blood DNA of Alzheimer’s disease and healthy individuals. Neurosci Lett. 2015;600:143–147. doi: 10.1016/j.neulet.2015.06.009 [DOI] [PubMed] [Google Scholar]
- 50.Ruiz A, Pesini P, Espinosa A, et al. Blood amyloid beta levels in healthy, mild cognitive impairment and Alzheimer’s disease individuals: replication of diastolic blood pressure correlations and analysis of critical covariates. PLoS One. 2013;8(11):e81334. doi: 10.1371/journal.pone.0081334 [DOI] [PMC free article] [PubMed] [Google Scholar]
- 51.Villa P, Bosco P, Ferri R, et al. Fasting and post-methionine homocysteine levels in Alzheimers disease and vascular dementia. Int J Vitam Nutr Res. 2009;79(3):166–172. doi: 10.1024/0300-9831.79.3.166 [DOI] [PubMed] [Google Scholar]
- 52.Wang Q, Zhao J, Chang H, Liu X, Zhu R. Homocysteine and folic acid: risk factors for Alzheimer’s disease-an updated meta-analysis. Front Aging Neurosci. 2021;13:665114. doi: 10.3389/fnagi.2021.665114 [DOI] [PMC free article] [PubMed] [Google Scholar]
- 53.Shen L, Ji HF. Associations between homocysteine, folic acid, vitamin B12 and Alzheimer’s disease: insights from meta-analyses. J Alzheimers Dis. 2015;46(3):777–790. doi: 10.3233/JAD-150140 [DOI] [PubMed] [Google Scholar]
- 54.Seshadri S, Beiser A, Selhub J, et al. Plasma homocysteine as a risk factor for dementia and Alzheimer’s disease. N Engl J Med. 2002;346(7):476–483. doi: 10.1056/NEJMoa011613 [DOI] [PubMed] [Google Scholar]
- 55.Ravaglia G, Forti P, Maioli F, et al. Homocysteine and folate as risk factors for dementia and Alzheimer disease. Am J Clin Nutr. 2005;82(3):636–643. doi: 10.1093/ajcn.82.3.636 [DOI] [PubMed] [Google Scholar]
- 56.Refsum H, Ueland PM, Nygard O, Vollset SE. Homocysteine and cardiovascular disease. Annu Rev Med. 1998;49(1):31–62. doi: 10.1146/annurev.med.49.1.31 [DOI] [PubMed] [Google Scholar]
- 57.Homocysteine Lowering Trialists’ Collaboration. Lowering blood homocysteine with folic acid based supplements: meta-analysis of randomised trials. BMJ. 1998;316(7135):894–898. doi: 10.1136/bmj.316.7135.894 [DOI] [PMC free article] [PubMed] [Google Scholar]
- 58.Riddell LJ, Chisholm A, Williams S, Mann JI. Dietary strategies for lowering homocysteine concentrations. Am J Clin Nutr. 2000;71(6):1448–1454. doi: 10.1093/ajcn/71.6.1448 [DOI] [PubMed] [Google Scholar]
- 59.Broekmans WM, Klopping-Ketelaars IA, Schuurman CR, et al. Fruits and vegetables increase plasma carotenoids and vitamins and decrease homocysteine in humans. J Nutr. 2000;130(6):1578–1583. doi: 10.1093/jn/130.6.1578 [DOI] [PubMed] [Google Scholar]
- 60.Baroni L, Bonetto C, Rizzo G, Bertola C, Caberlotto L, Bazzerla G. Association between cognitive impairment and vitamin B12, folate, and homocysteine status in elderly adults: a retrospective study. J Alzheimers Dis. 2019;70(2):443–453. doi: 10.3233/JAD-190249 [DOI] [PubMed] [Google Scholar]
- 61.Zylberstein DE, Lissner L, Bjorkelund C, et al. Midlife homocysteine and late-life dementia in women. A prospective population study. Neurobiol Aging. 2011;32(3):380–386. doi: 10.1016/j.neurobiolaging.2009.02.024 [DOI] [PubMed] [Google Scholar]
- 62.Nilsson K, Gustafson L, Hultberg B. Plasma homocysteine concentration relates to the severity but not to the duration of Alzheimer’s disease. Int J Geriatr Psychiatry. 2004;19(7):666–672. doi: 10.1002/gps.1140 [DOI] [PubMed] [Google Scholar]
- 63.Clarke R, Smith AD, Jobst KA, Refsum H, Sutton L, Ueland PM. Folate, vitamin B12, and serum total homocysteine levels in confirmed Alzheimer disease. Arch Neurol. 1998;55(11):1449–1455. doi: 10.1001/archneur.55.11.1449 [DOI] [PubMed] [Google Scholar]
- 64.Luchsinger JA, Tang MX, Miller J, Green R, Mehta PD, Mayeux R. Relation of plasma homocysteine to plasma amyloid beta levels. Neurochem Res. 2007;32(4–5):775–781. doi: 10.1007/s11064-006-9207-7 [DOI] [PubMed] [Google Scholar]
- 65.Snowdon DA, Tully CL, Smith CD, Riley KP, Markesbery WR. Serum folate and the severity of atrophy of the neocortex in Alzheimer disease: findings from the Nun study. Am J Clin Nutr. 2000;71(4):993–998. doi: 10.1093/ajcn/71.4.993 [DOI] [PubMed] [Google Scholar]
- 66.Pacheco-Quinto J, Rodriguez de Turco EB, DeRosa S, et al. Hyperhomocysteinemic Alzheimer’s mouse model of amyloidosis shows increased brain amyloid beta peptide levels. Neurobiol Dis. 2006;22(3):651–656. doi: 10.1016/j.nbd.2006.01.005 [DOI] [PubMed] [Google Scholar]
- 67.Novakovic P, Stempak JM, Sohn KJ, Kim YI. Effects of folate deficiency on gene expression in the apoptosis and cancer pathways in colon cancer cells. Carcinogenesis. 2006;27(5):916–924. doi: 10.1093/carcin/bgi312 [DOI] [PubMed] [Google Scholar]
- 68.Tian H, Tian D, Zhang C, et al. Efficacy of folic acid therapy in patients with hyperhomocysteinemia. J Am Coll Nutr. 2017;36(7):528–532. doi: 10.1080/07315724.2017.1330162 [DOI] [PubMed] [Google Scholar]
- 69.Price BR, Wilcock DM, Weekman EM. Hyperhomocysteinemia as a risk factor for vascular contributions to cognitive impairment and dementia. Front Aging Neurosci. 2018;10:350. doi: 10.3389/fnagi.2018.00350 [DOI] [PMC free article] [PubMed] [Google Scholar]
- 70.Li JG, Chu J, Barrero C, Merali S, Pratico D. Homocysteine exacerbates beta-amyloid pathology, tau pathology, and cognitive deficit in a mouse model of Alzheimer disease with plaques and tangles. Ann Neurol. 2014;75(6):851–863. doi: 10.1002/ana.24145 [DOI] [PMC free article] [PubMed] [Google Scholar]
- 71.Dufouil C, Alperovitch A, Ducros V, Tzourio C. Homocysteine, white matter hyperintensities, and cognition in healthy elderly people. Ann Neurol. 2003;53(2):214–221. doi: 10.1002/ana.10440 [DOI] [PubMed] [Google Scholar]
- 72.Shirafuji N, Hamano T, Yen SH, et al. Homocysteine increases tau phosphorylation, truncation and oligomerization. Int J Mol Sci. 2018;19(3):891. doi: 10.3390/ijms19030891 [DOI] [PMC free article] [PubMed] [Google Scholar]
- 73.Obeid R, Kasoha M, Knapp JP, et al. Folate and methylation status in relation to phosphorylated tau protein(181P) and beta-amyloid(1-42) in cerebrospinal fluid. Clin Chem. 2007;53(6):1129–1136. doi: 10.1373/clinchem.2006.085241 [DOI] [PubMed] [Google Scholar]
- 74.Zhuo JM, Pratico D. Normalization of hyperhomocysteinemia improves cognitive deficits and ameliorates brain amyloidosis of a transgenic mouse model of Alzheimer’s disease. FASEB J. 2010;24(10):3895–3902. doi: 10.1096/fj.10-161828 [DOI] [PMC free article] [PubMed] [Google Scholar]


