Abstract
The article presents the results of research on the impact of basic process parameters of selective laser sintering technology on the mass of the produced models (density of the sintered material—polyamide PA 2200), stress relaxation during compression determined in accordance with the ISO 3384 standard, and geometric surface structure parameters (SGPs). During the tests, the influence of process parameters such as the location of the models on the virtual construction platform (printing direction), the density of the energy supplied to the sintered layer of powder, and the layer thickness of the manufactured material layer was taken into account. The test results confirmed that the process parameters have a significant impact on the density of the model material (in the sintered state), the mechanical properties (stress relaxation during compression), and the quality of the surface texture (SGPs). The most favorable positioning variants of the models on the construction platform were determined. The most favorable thickness variants of the combined layers and the density value of the energy supplied to the sintered powder layer were selected, depending on the expected mass, strength, and SGP quality. In addition, it has been shown that it is possible to build models with reduced mass (>20%), while maintaining satisfactory mechanical and qualitative properties of the surface texture.
Keywords: 3D printing, rapid prototyping, additive manufacturing technologies, stress relaxation, GPS, SLS
Introduction
Additive manufacturing technologies, also known as rapid prototyping technologies, are successfully used in almost all branches of industry. The dynamic development of additive manufacturing resulted in the development and patenting of many new and varied technologies in the 1980s and 1990s.1–5 This initiated the work on the standardization process of international standards increasing the reliability of research results; however, it is still in the development phase.6
Owing to the dynamic development of the automotive, energy, aviation, telecommunications, textiles, and medical industries, the time of implementation (production) of new products and their functional lifetime have been significantly reduced. New materials are being used, including ecofriendly, biodegradable, biocompatible, and high-strength materials, especially for additive laser technologies such as selective laser sintering (SLS). At present, even in a short production series, it may be necessary to introduce structural, technological, or visual changes that generate major problems, associated in particular with the production of new technological instrumentation. In the case of conventional manufacturing technologies such as molding, machining, plastic working, or injection molding, it is necessary to develop technological equipment such as molds, dies, casting patterns, and machining tool holders along with the preparation of computer aided manufacturing programs, controlling computer numerical control machine tools, forging dies, or injection molds.
The implementation of products for mass production, as well as the testing period for quality assurance, is the most labor intensive of the production stages. It is a consequence of the required calculations and simulations, but also due to the preparation of drawing documentation, which is a very time-consuming and complicated process. Unconventional additive manufacturing technologies that do not require drawing documentation or the construction of expensive and time-consuming technological equipment can alleviate this type of problems. With the development of technology, the advancements in chemistry, and the increased precision of the manufactured machines, it is now possible to build models using many types of materials with different physical and chemical properties. These technologies, as demonstrated by both engineering practice and numerous scientific publications, are perfectly suited for the construction of molds and casting models, especially in the case of the lost material method.7,8
Owing to the development of modern materials, the development of printing on already existing models9,10 is in an advanced stage. This method of construction is possible due to one of the most popular additive manufacturing technologies—fused deposition modeling (FDM).11 In this technology, a material based on plastics, for example, acrylonitrile-butadiene-styrene (ABS), is pushed through printing nozzles, heated to a temperature just below the melting point of the material, and distributed in the place where the current layer of the model is built. With the greater availability of materials with various properties, this technology has found a great use in printing on fabrics in the textile industry.12 Unconventional manufacturing technologies can be divided into many categories, with three types of classification being the most popular, that is, the type based on the form of input material (liquid, powder, and solid), the type based on the way the layers are connected (sintering, gluing, and chemical bonds), and also the type based on the type of material used (plastic, metal, and ceramics). Owing to the significant development of technologies using materials based on plastics, it is now possible to manufacture elements with greater strength properties, increased dimensional and shape accuracy, and improved wear resistance. This particularly applies to SLS technology for polyamides such as PA 6, PA 12, and polyamides additionally reinforced with fiberglass PA 12 GF, etc.
One of the key concepts in the case of manufacture of models with the use of additive technologies is the term “process parameters.” In the case of additive methods, as in any conventional manufacturing technology, one can distinguish the parameters of the technological process that affect accuracy, mechanical properties, and tribological wear. In the case of the well-known machining processes, machining speed, feed rate, and depth of cut as well as machining direction are the main process parameters that directly affect the mentioned properties.13 A similar reference can be made to SLS technology, wherein the main parameters are speed and power of the laser beam, which directly affect the energy density (ED) supplied to the sintered layer of powder, thickness of the layer being built, direction of “print,” temperature of the process chamber, temperature of the removal chambers, cooling time, powder humidity, grain diameter, etc. Therefore, the presented publication demonstrates the results of the research showing the impact of selected process parameters of SLS of polyamide powders on the mass of models (density of material), relaxation of stress determined during the uniaxial compression test, as well as the quality of the surface texture in the form of standard, and geometric surface structure parameters (SGPs).
Research showing the impact of single process parameters of the SLS method or narrow parameter groups on the dimensional and shape accuracy and the mechanical properties of the produced models has been presented in several studies.14–16
In Ref.,14 the authors tested the samples manufactured with SLS technology. Then, using the strength machine, they carried out stress relaxation tests on cylindrical samples. The model material was polyamide PA 2200. The samples were made with different variants of the orientation of the models on the building platform. The results of the research have been approximated by a five-parameter mathematical model of the so-called Maxwell–Wiechert model. Then the results were compared with the results obtained using the fractional calculus. The results of the research showed that a five-parameter mathematical model can be used to describe stress relaxation during the uniaxial compression test. The use of a much more complicated fractional calculation allows for a more complete description of the phenomenon taking place. In addition, it was determined that the most significant impact on the anisotropy of the material properties depended on the printing directions (PDs) and dynamic viscosity coefficient, which is in relation to printing direction.
Publication15 presents the research results of measurements of stress relaxation of samples made in FDM technology of ABS P430 material, taking into account the technological parameter of the so-called printing direction. During construction, samples were located on the building platform under three characteristic angles (in one plane—XZ). Stress relaxation tests of samples made in accordance with ISO 3384 were approximated by 3 and 5 parametric rheological models, allowing to describe the behavior of material subjected to continuous loads. Optimal variants of the location of models on the construction platform as well as coefficients of rheological models were determined.
In Ref.,16 the authors submitted a mixture of polyamide PA 6 and PA 12 powders. Three different proportions of mixing of the constituent materials were selected to obtain new mixtures. These mixtures were tested for mechanical properties, with particular emphasis on static tests. The tensile tests carried out showed clear differences in tensile strength and in the value of Young's modulus. In addition, the microstructure of the samples was also measured at breakage points. The tests also included rheological tests with particular reference to creep tests.
Owing to the fact that in additive technologies models are built layer by layer, some problems arise, as in the case of the technological measurement of surface texture.17 This is a disadvantageous phenomenon in the case of soft materials with low hardness, usually measured for plastics using the Shore scale, measurement problems arise when contact devices are used. In addition, in some cases optical measuring devices do not always work, due to the reflective nature of the material and the small number of measured points, which are the basis for approximation of the geometric surface texture and determination of SGPs.
The SLS technology is one of the most promising methods for rapid production of models based on plastics. Materials based on polyamides, for example, PA 2200 and PA 3200 GF, utilize the well-known PA 6 and PA 12 polyamides, which due to their high thermal resistance, high dimensional stability, and high abrasion resistance are perfectly suited for the construction of elements subject to both the process of wear and working under heavy continuous loads, such as seals.
In view of that mentioned, initial tests were conducted on elastic bellow models made with the use of the SLS technology.18,19 The test results showed that due to their sufficient mechanical properties, these elements may be used for the construction of fully functional elements of technical seals. Preliminary tests showed the high resistance to internal air pressure (>0.1 MPa) of the models made of PA 2200 polyamide powder. The conclusion that the laser parameters and the direction of the printout are of key importance to the properties of the models being built was confirmed. Bellows made with the highest ED and the provided direction of construction setting showed the highest value of the stiffness coefficient determined during a uniaxial compression test. However, it is important to note that the sample models showed some disadvantages in the form of a diversified geometric surface texture and different mechanical properties, which resulted in the extended studies presented in this article.
The analysis of literature and the author's own work has shown that it is necessary to carry out extended research consisting of determination of the relationship between the process parameters of the manufacturing process and material properties. Therefore, in the presented study, samples were manufactured using SLS technology and PA 2200 material (pure, delivered by EOS), which were made with changed technological parameters. The material was absolutely new without refreshing and mixing with that already used. The influence of technological parameters on rheological properties (stress relaxation), the mass of sample models, and the surface texture quality were determined.
Research and Methodology
To carry out a wide range of tests, it was decided to design cylindrical samples with a diameter of 13 mm and a height of 6.3 mm. Digital models were designed in CAD (SolidWorks). These dimensions are in accordance with the ISO20 standard for samples intended for determining stress relaxation during the uniaxial compression test.
The process of triangulation (saving models as STL files), that is, the mapping of models using a triangle mesh, was carried out in the so-called custom mode, omitting the “fine” and “coarse” modes, due to the insufficient quality of reproduction. The STL model was characterized by the following parameters: 0.001 tolerance and 3° angular deviation. A model recorded in such a manner is shown in Figure 1a, where the number of triangles of the approximated 3D model is 720. Next, using the Formiga P100 machine (3D printer) from EOS (Krailling, Germany), implementing the SLS technology, physical models of samples with given parameters were manufactured. Each sample was printed three times with given parameters to account for statistical calculations. During the process of construction of sample models, three process parameters were analyzed. The research was designed in accordance with the principles of a two-factor experiment (design of experiment [DOE]) determined on three levels of variability (required number of samples N = XY, i.e., 32, where X is the number of levels of variability and Y is the number of parameters), where the process parameters were PD and ED.
FIG. 1.
Samples: (a) approximation and (b) placement on the platform.
ED is mainly a component of laser speed and laser power; therefore, during the tests, the speed and power of the laser were selected so as to obtain three levels of ED transmitted to the sintered powder layer. Technological parameters whose impact was taken into account were selected on the basis of a review of the aforementioned literature and the author's initial research presented in the article.21 In the presented research, three variants were chosen: ED 0.032 J/mm2 (laser speed 3100 mm/s and laser power 14 W), ED 0.056 J/mm2 (laser speed 2500 mm/s and laser power 21 W), and ED 0.08 J/mm2 (laser speed 2100 mm/s and laser power 28 W). Three ED variants were selected, whose values 0.032 and 0.08 deviate by the same value from the reference value 0.056 recommended by the machine manufacturer. This allowed for a complete planned experiment (DOE). In the same way, the print direction was chosen for three levels of variation.
Results from the author's previous research tests demonstrate that it is difficult to produce samples of layer thickness >0.2 mm (0.3, 0.4) under the recommended technological parameters for use in further study because of their low strength and the insufficiency from breakage during the cleaning process. Layer thickness that was determined on two levels of variability was equal to 0.1 and 0.2 mm. Three characteristic variants of positioning of the models on the machine's construction platform were selected, that is, at angles of 1: 0°, 2: 45°, and 3: 90° (Fig. 1b). Process parameters of the sample models are presented in Table 1, where Lt is layer thickness, PD is printing direction, and ED is energy density. The ED transmitted to the sintered layer was calculated using Equation (1).22 This equation can be used as an approximation in a narrow field of scanning speed that was included in this article.
Table 1.
Process Parameters of Sample Manufacture
| No. | Lt (mm) | PD (°) | ED (J/mm2) | No. | Lt (mm) | PD (°) | ED (J/mm2) |
|---|---|---|---|---|---|---|---|
| 1 | 0.1 | 0 | 0.032 | 10 | 0.2 | 0 | 0.032 |
| 2 | 0.056 | 11 | 0.056 | ||||
| 3 | 0.08 | 12 | 0.08 | ||||
| 4 | 45 | 0.032 | 13 | 45 | 0.032 | ||
| 5 | 0.056 | 14 | 0.056 | ||||
| 6 | 0.08 | 15 | 0.08 | ||||
| 7 | 90 | 0.032 | 16 | 90 | 0.032 | ||
| 8 | 0.056 | 17 | 0.056 | ||||
| 9 | 0.08 | 18 | 0.08 |
PD, printing direction.
| (1) |
where Ed is energy density, J/mm2; P is laser power (three variants, W); v is laser speed (three variants, mm/s); h is hatch distance, 0.25 mm; d is laser beam diameter, 0.42 mm; and x, beam overlay ratio, 1.68.
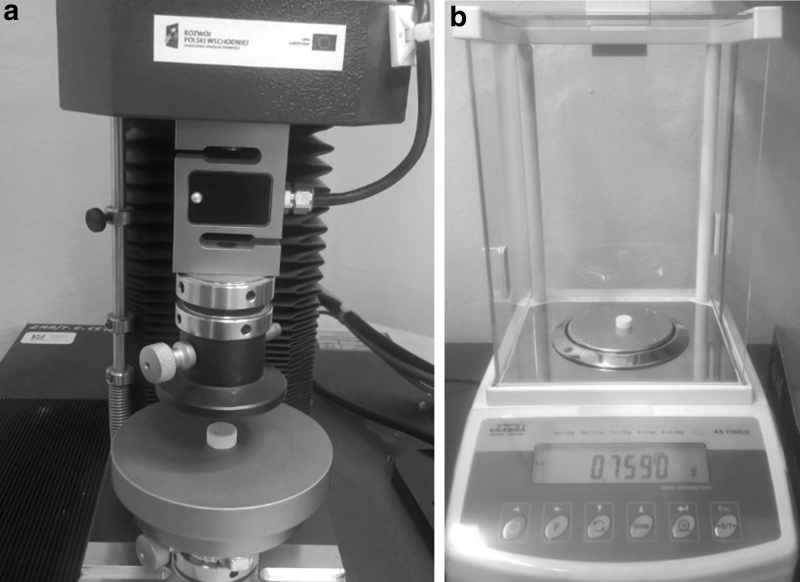
The material used for the construction of the samples was the PA 2200 polyamide powder based on the well-known construction material, polyamide PA 12. This material shows a very low water absorption at a level of 1%, which is suitable for the construction of technical sealing elements, which, in turn, is one of the potential applications analyzed by the author in previous research articles. In addition, polyamide PA 2200 is biocompatible in accordance with ISO 10993-1,23 which increases its practical application potential. Measurements of stress relaxation were carried out using the Inspekt testing machine made by Hegewald and Peschke. Furthermore, using the RADWAG AS 110/C/2 scale, measurements of the samples' mass were made, allowing the density of the sample models to be determined.
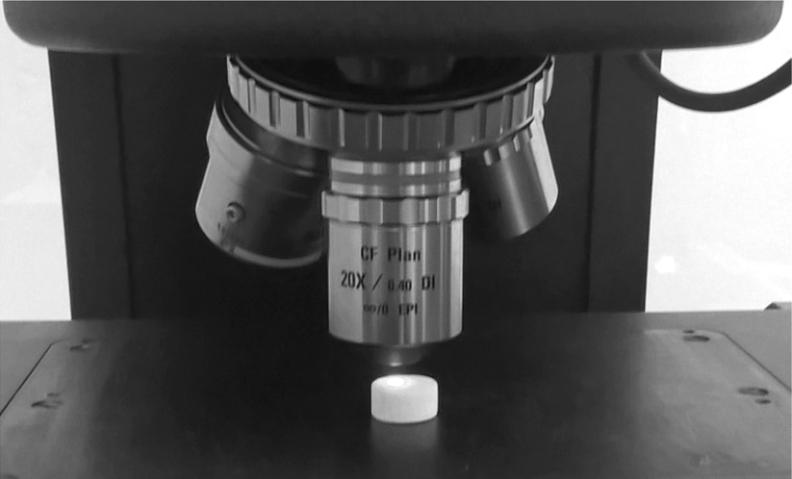
Measurements of the surface texture were made using the Taylor Hobson Talysurf CCI Lite. This devise utilizes the coherence correlation interferometry measurement technique. This precision optical measurement profilometer is characterized by a vertical resolution of Z 10 pm and an optical resolution (X, Y) of 0.4–0.6 μm.24 The primary profile (P) and surface (S) parameters were obtained after leveled processes. To compare research results, further filtering operation was not necessary. Surface geometry studies were carried out at the top surface of the sample (Fig. 2) using magnification equal to 20, where the measured area was 0.8 × 0.8 mm. The geometric parameters25 of the primary 2D profile (P) and 3D geometric parameters (S) were determined for the comparison of the research results (with different process parameters). Based on the preliminary research results,21 in which the influence of particular process parameters on the parameters of the surface geometry structure was presented, only selected SGPs were selected for measurements and analysis in the next step.
FIG. 2.
Sample during measurement.
In the case of height (amplitude parameters) measurements of the primary profile, the following four parameters were selected: Pa, Pz, Pt, and Pq. The Pa parameter is equivalent to the well-known roughness parameter Ra, widely used in industry. Pt is a parameter of particular importance, which is the sum of the highest peak of the profile and the lowest valley inside the measuring section. This is important because this parameter plays a big role in elements such as seals (O-type, O-ring), where the plastics additive manufacturing technologies find practical applications. Pq, the root mean square deviation, indicates the root mean square along the sampling length.
Measurement of 3D parameters (S) allowed to determine a few basic parameters such as Sa, Sz, and Sq. These parameters correspond to spatial roughness parameters such as Ra, Rz, and Rq. The mean square deviation of the profile from the mean line is Rq (Pq), which is quite often omitted, hence the Sq parameter was also included in further research analysis. Using the least-squares method, experimental mathematical models describing the impact of the presented variables on both the stress relaxation and the mass of sample models were determined (Fig. 3). The analysis of the test results was carried out using the Statistica and Mathematica software. The selected mechanical properties of the PA 2200 polyamide are given in Table 2.
FIG. 3.
Samples during tests: (a) stress relaxation and (b) mass.
Table 2.
| Mechanical properties | Value | Unit | Standard |
|---|---|---|---|
| Tensile modulus | 1700 | MPa | EN ISO 527 |
| Izod impact (23°C) | 4.4 | kJ/m2 | ISO 180/1A |
| Shore hardness (15 s) | 75 | — | ISO 868 |
| Density | 930 | kg/m3 | EOS method |
| Melting point | 176 | oC | ISO 11357-1/-3 |
Using the least-squares method [Equation (2)] and the matrix transformations presented hereunder, based on the results of the research presented in Tables 3 and 4, eight approximation functions were determined. The symbol X denotes the matrix of input variables of the two-level complete plan of the experiment (DOE) on three degrees of variability. The matrix Y is a matrix of measurement results, in the drawing it is a matrix of results for measurements of mass (Lt: 0.1 mm). The determinant of the matrix |X| and the inverse matrix X−1, and then individual determinants (a1–a9) of the approximation function were determined. The influence of process parameters on the relaxation in compression for the two thicknesses of the constructed layer is presented in the form of Equations (3) and (4). In turn, the influence of process parameters on the mass of sample models is presented in the form of an approximation function in Equations (5)–(12). During calculations, the PD parameter is marked as x1, ED is marked x2. To simplify the calculation, the value of the x1 print direction was set at three levels 1–0°, 2–45°, 3–90°.
Table 3.
Research Results for Stress Relaxation Measurement
| No. | Lt (mm) | PD (°) | ED (J/mm2) | S | ||||
|---|---|---|---|---|---|---|---|---|
| 1 | 0.1 | 0 | 0.032 | 0.102 | 0.020 | 0.038 | 0.064 | 0.140 |
| 2 | 0.056 | 0.047 | 0.016 | 0.030 | 0.017 | 0.077 | ||
| 3 | 0.08 | 0.065 | 0.011 | 0.021 | 0.044 | 0.086 | ||
| 4 | 45 | 0.032 | 0.103 | 0.009 | 0.016 | 0.087 | 0.119 | |
| 5 | 0.056 | 0.070 | 0.029 | 0.055 | 0.015 | 0.125 | ||
| 6 | 0.08 | 0.088 | 0.021 | 0.040 | 0.048 | 0.128 | ||
| 7 | 90 | 0.032 | 0.104 | 0.014 | 0.028 | 0.076 | 0.132 | |
| 8 | 0.056 | 0.076 | 0.019 | 0.036 | 0.041 | 0.112 | ||
| 9 | 0.08 | 0.043 | 0.011 | 0.022 | 0.021 | 0.066 | ||
| 10 | 0.2 | 0 | 0.032 | 0.266 | 0.004 | 0.008 | 0.257 | 0.273 |
| 11 | 0.056 | 0.168 | 0.008 | 0.015 | 0.153 | 0.183 | ||
| 12 | 0.08 | 0.114 | 0.002 | 0.004 | 0.109 | 0.118 | ||
| 13 | 45 | 0.032 | 0.286 | 0.015 | 0.029 | 0.257 | 0.314 | |
| 14 | 0.056 | 0.178 | 0.004 | 0.007 | 0.171 | 0.186 | ||
| 15 | 0.08 | 0.134 | 0.014 | 0.028 | 0.106 | 0.162 | ||
| 16 | 90 | 0.032 | 0.458 | 0.357 | 0.687 | −0.230 | 1.145 | |
| 17 | 0.056 | 0.108 | 0.008 | 0.016 | 0.092 | 0.123 | ||
| 18 | 0.08 | 0.081 | 0.015 | 0.028 | 0.053 | 0.109 | ||
Table 4.
Mass of Polyamide Sample Models, Lt 0.1/0.2
| No. | (mass, g) | No. | (mass, g) | PD (°) | Ed (J/mm2) |
|---|---|---|---|---|---|
| 1 | 0.622 | 10 | 0.453 | 0 | 0.032 |
| 2 | 0.780 | 11 | 0.611 | 0 | 0.056 |
| 3 | 0.770 | 12 | 0.667 | 0 | 0.08 |
| 4 | 0.606 | 13 | 0.442 | 45 | 0.032 |
| 5 | 0.763 | 14 | 0.695 | 45 | 0.056 |
| 6 | 0.751 | 15 | 0.660 | 45 | 0.08 |
| 7 | 0.579 | 16 | 0.432 | 90 | 0.032 |
| 8 | 0.755 | 17 | 0.580 | 90 | 0.056 |
| 9 | 0.748 | 18 | 0.640 | 90 | 0.08 |
| (2) |
Results
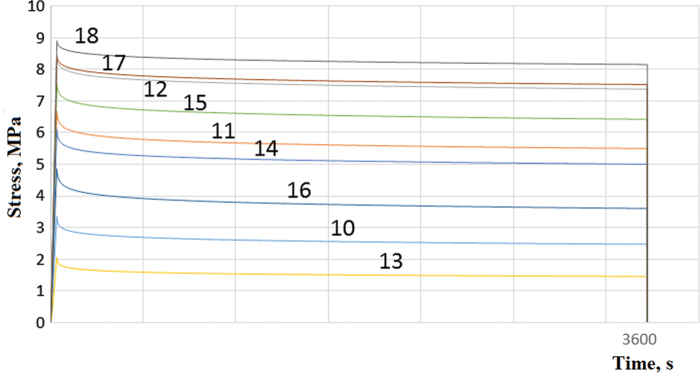
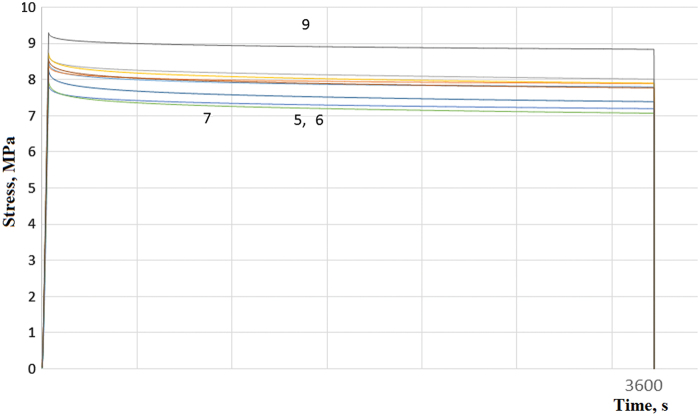
The results of the tests given in Tables 3–6 contain mean values from three measured samples. Table 3 presents the results of stress relaxation measurements together with the results of statistical analysis, where the symbol indicates the mean relaxation value for the three measured samples. Table 4 gives the average mass value of the sample models (). In addition, Tables 5 and 6 present the determined parameters of the surface texture, where Table 5 presents the two-dimensional (height) parameters of the primary profile (), and Table 6 presents the spatial parameters of the surface (). The results of the relaxation tests are presented in Figures 4–6, and Figures 5 and 6 depict the collective test results for two layer thicknesses (Lt: 0.1 mm, Fig. 5; and Lt: 0.2 mm, Fig. 6).
Table 6.
Spatial Parameters of Polyamide Samples, Lt 0.1/0.2
| No. | Sa (μm) | Sz (μm) | Sq (μm) | No. | Sa (μm) | Sz (μm) | Sq (μm) | PD (°) | Ed (J/mm2) |
|---|---|---|---|---|---|---|---|---|---|
| 1 | 13.534 | 108.347 | 16.990 | 10 | 12.964 | 108.383 | 16.555 | 0 | 0.032 |
| 2 | 13.692 | 94.598 | 17.179 | 11 | 13.179 | 107.707 | 16.620 | 0 | 0.056 |
| 3 | 13.637 | 115.013 | 17.100 | 12 | 12.019 | 97.205 | 15.061 | 0 | 0.08 |
| 4 | 14.276 | 116.467 | 17.845 | 13 | 19.937 | 126.673 | 24.375 | 45 | 0.032 |
| 5 | 17.258 | 139.527 | 21.673 | 14 | 13.67 | 106.983 | 17.156 | 45 | 0.056 |
| 6 | 14.088 | 106.948 | 17.561 | 15 | 14.445 | 121.017 | 18.166 | 45 | 0.08 |
| 7 | 12.925 | 101.493 | 16.217 | 16 | 18.706 | 122.097 | 22.851 | 90 | 0.032 |
| 8 | 14.121 | 110.733 | 17.702 | 17 | 13.708 | 106.747 | 17.264 | 90 | 0.056 |
| 9 | 14.554 | 117.37 | 18.222 | 18 | 16.149 | 123.037 | 20.292 | 90 | 0.08 |
Table 5.
Two-Dimensional Parameters of the Primary Profile, Lt 0.1/0.2
| No. | Pa (μm) | Pz (μm) | Pt (μm) | Pq (μm) | No. | Pa (μm) | Pz (μm) | Pt | Pq (μm) | PD (°) | Ed (J/mm2) |
|---|---|---|---|---|---|---|---|---|---|---|---|
| 1 | 13.175 | 74.976 | 74.973 | 16.267 | 10 | 12.574 | 73.444 | 73.444 | 15.769 | 0 | 0.032 |
| 2 | 13.359 | 77.8 | 77.800 | 16.590 | 11 | 12.765 | 75.886 | 75.886 | 15.999 | 0 | 0.056 |
| 3 | 13.04 | 74.692 | 74.692 | 16.142 | 12 | 11.619 | 68.076 | 68.076 | 14.476 | 0 | 0.08 |
| 4 | 13.44 | 76.695 | 76.695 | 16.631 | 13 | 19.421 | 96.458 | 96.458 | 23.430 | 45 | 0.032 |
| 5 | 16.404 | 92.979 | 92.979 | 20.360 | 14 | 13.113 | 76.005 | 76.005 | 16.266 | 45 | 0.056 |
| 6 | 13.444 | 75.078 | 75.078 | 16.606 | 15 | 13.532 | 77.689 | 77.689 | 16.867 | 45 | 0.08 |
| 7 | 12.584 | 72.251 | 72.251 | 15.613 | 16 | 18.017 | 91.491 | 91.491 | 21.801 | 90 | 0.032 |
| 8 | 13.285 | 77.487 | 77.487 | 16.492 | 17 | 13.01 | 74.286 | 74.286 | 16.152 | 90 | 0.056 |
| 9 | 13.981 | 79.12 | 79.120 | 17.332 | 18 | 15.328 | 84.884 | 84.884 | 18.935 | 90 | 0.08 |
FIG. 4.
Stress relaxation (a) Lt 0.1 mm and (b) Lt 0.2 mm.
FIG. 6.
Stress relaxation, Lt 0.2 mm. Color images are available online.
FIG. 5.
Stress relaxation, Lt 0.1 mm. Color images are available online.
With the increase in the thickness of the building layer (from the recommended for pure PA 2200: 0.1–0.2 mm) and leaving the ED at the same level, the distribution of the area (propagation into the material) changes, which is affected by insufficient energy for full sintering of the volume of material. Therefore, the connections between layers are not as strong as in the case of analogous samples with layer thickness of 0.1 mm. It seems that this adverse effect of increasing the thickness of the layer can be compensated in some way by increasing the ED, which can be seen by observing and comparing the measurement results for samples 8 (Lt: 0.1, ED: 0.056 J/mm2), 17 (Lt: 0.2, ED: 0.056 J/mm2), and 18 (Lt: 0.2, ED: 0.08 J/mm2), Table 3.
In the case of sample 8 with basic parameters (recommended by the machine manufacturer EOS), stress relaxation is equal, 0.076, increasing the layer thickness (up to 0.2 mm) and leaving the PD and ED the same (sample 17), stress relaxation increases to the level of 0.108. The unfavorable effect of increasing the layer thickness on the stress relaxation is visible. This phenomenon can be counteracted by increasing (while maintaining other technological parameters at the same level) ED from 0.056 J/mm2 (for samples 8 and 17) to 0.08 J/mm2 (sample 18). It can be seen that even increasing the layer thickness, stress relaxation can be compensated by increasing the ED value. In this case, stress relaxation is at the level of the reference sample (8) and is equal to 0.081. Similar characteristics appear to occur in all tested samples, where the relaxation of compressive stress increased with increasing layer thickness. It can be unequivocally said that all the technological parameters used in the study significantly affect stress relaxation and that the complete two-level planned experiment established at three levels of variation was selected in a legitimate manner.
Experimental mathematical models describing the influence of process parameters on the value of stress relaxation yR for the two values of layers 0.1 and 0.2 mm are presented in the form of Equations (3) and (4).
| (3) |
| (4) |
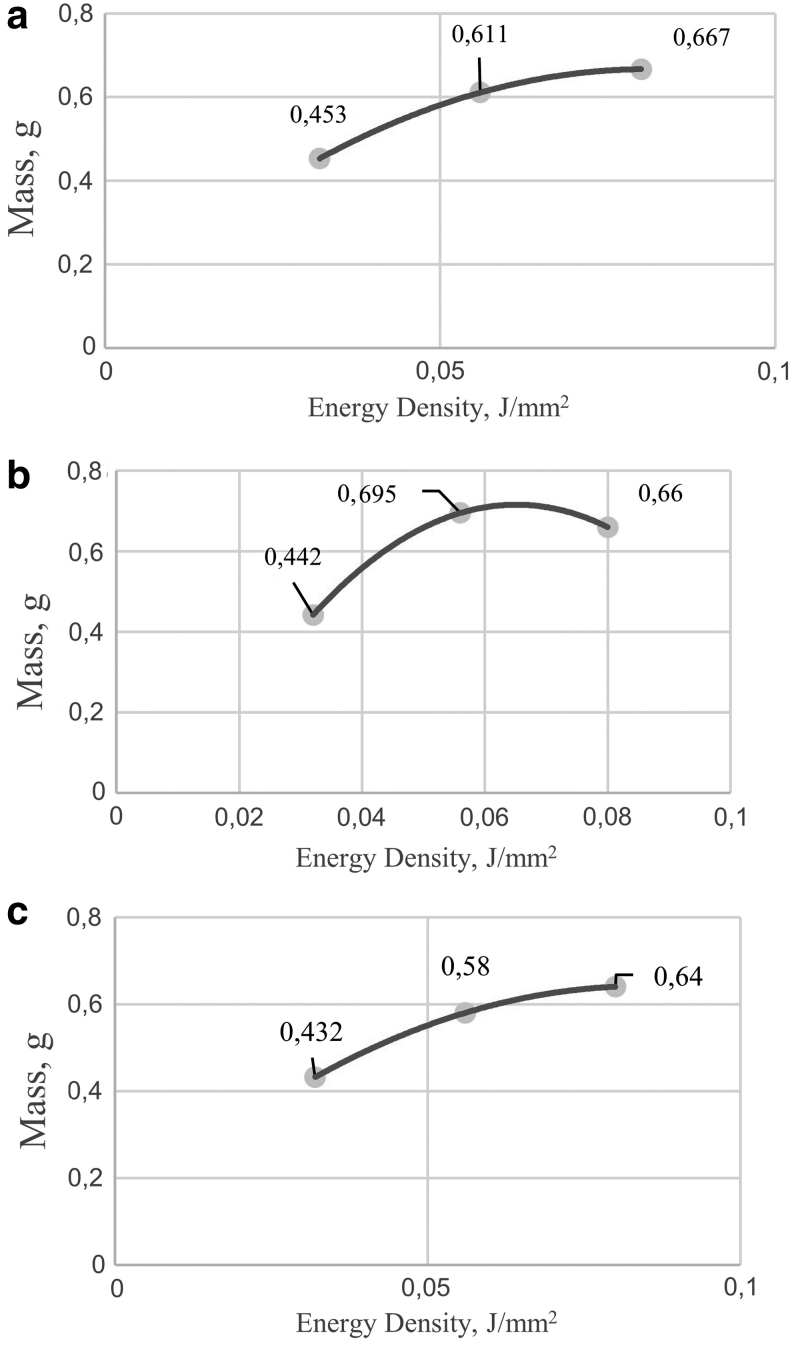
Models of samples have also been subjected to tests consisting in the analysis of the impact of process parameters on their mass. Table 4 presents average measurement results. In addition, experimental mathematical models showing the impact of the ED delivered to the sintered powder layer on the mass of the models were also established. The equations for two separate variants of the thickness of the constructed layer and for each PD were also determined [Equation (5): y1m0°,45°,90°, Equation (6): y2m0°,45°,90°]. Equations (7)–(9) show the mathematical model of the mass for samples manufactured with a layer thickness of 0.1 mm and correspond to Figure 7a–c, whereas Equations (10)–(12) describe samples prepared with a given layer thickness of 0.2 mm and illustrate the data given in Figure 8a–c.
FIG. 7.
Dependence of sample mass on energy density for samples: (a) 1–3, (b) 4–6, and (c) 7–9.
FIG. 8.
Dependence of sample mass on energy density for samples: (a) 10–12, (b) 13–15, and (c) 16–18.
| (5) |
| (6) |
| (7) |
| (8) |
| (9) |
| (10) |
| (11) |
| (12) |
During the sintering process, when the sintered powder layer is supplied with ED with lower (0.032 J/mm2) or higher (0.08 J/mm2) values from those recommended by the manufacturer (0.056 J/mm2), the mass of produced models changes (material density). In the case of the test results presented in Figure 8a and c, similarities are clearly visible regardless of the PD. In the case of test results of samples made with a given print angle of 45° (Fig. 8b), it can be seen that for ED values 0.056 and 0.08 J/mm2, the material density is at a similar level. This can be explained by the fact that in the case of angle sample models, the so-called step effect, which affects the accuracy of manufactured models, can increase the mass of sample models for selected ED values. Perhaps that is why ED 0.056 J/mm2 is recommended for manufacturing models in the case of the material used in this study (pure PA 2200). Comparing the results of tests of samples made with the thickness of the constructed layer 0.2 mm presented in Figure 8 with the results for samples made with a given thickness of 0.1 mm (Fig. 7), it can be stated that only in the case of the results for sample 14 (analogous sample number 5: Lt 0.1), the weight increase for ED 0.056 J/mm2 is clearly visible. For the other sample models, the trend of mass increase as ED increases regardless of the print direction is the same.
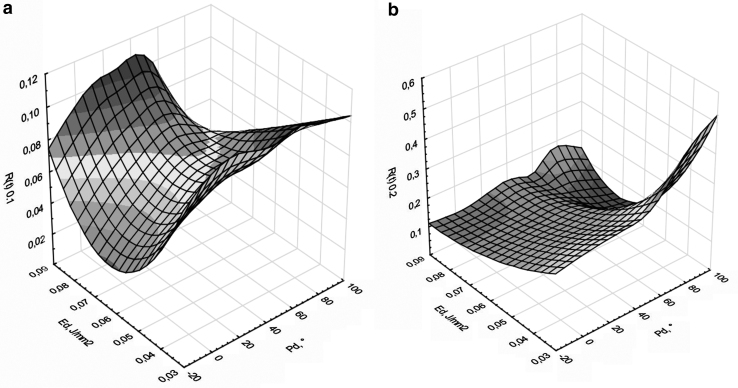
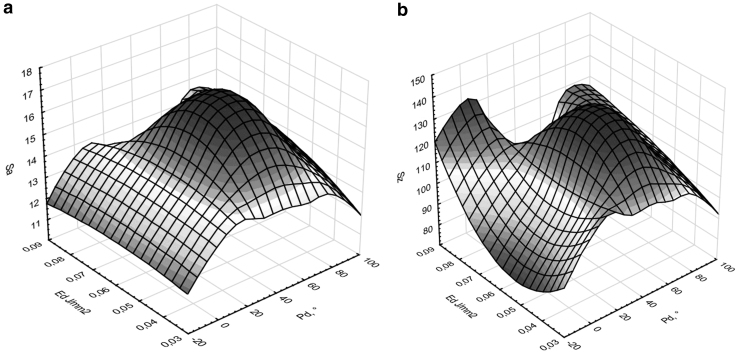
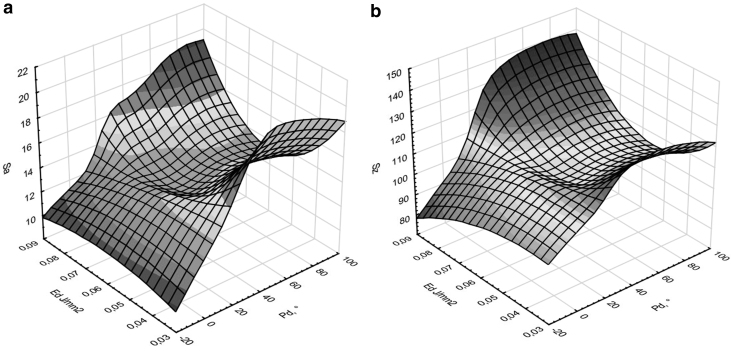
The last type of test was the determination of two-dimensional and spatial parameters of the geometric surface texture. The test results are presented in Tables 5 and 6 (Figs. 9 and 10).
FIG. 9.
Dependence of SGPs on PD and Ed variables (Lt 0.1): (a) Sa and (b) Sz. Ed, energy density; PD, printing direction; SGP, standard, and geometric surface structure parameter.
FIG. 10.
Dependence of SGPs on PD and Ed variables (Lt 0.2): (a) Sa and (b) Sz.
The values of technological parameters were selected on the basis of analyses of previously conducted own research studies and on the basis of literature analysis (e.g., Ref.22 in the article) concerning the study of mechanical properties of models produced with SLS technology. Previously conducted results of own research showed that in the case of the layer thickness equal to 0.3 mm, there is a problem with model cleaning, and sometimes also with the proper conduct of tests, due to very weak bonds (poor sintering) of joined layers. The machine only allows a step change (every 0.1 mm) of the layer thickness, therefore, it was decided to test two layer thicknesses 0.1 and 0.2 mm. In the case of ED, it was similarly determined that below ED 0.032 J/mm2, there are clear problems with cleaning and testing, so it was decided to carry out tests on three types of samples: reference 0.056 J/mm2, with a predetermined minimum value of 0.032 J/mm2 and increased by a value corresponding to the difference between samples 0.032 and 0.056 J/mm2 to the level of 0.08 J/mm2. The parameters selected in this way also allowed the use of a complete determined planned experiment for analysis of the test results.
The test results presented in graphs 4 and 5 unambiguously showed that there are extremes wherein, depending on the selected process parameters, stress relaxation assumes the lowest and the highest values with a smooth transition between the results. Stress relaxation values (Table 3) for the layer thickness Lt 0.1 mm (Fig. 4) clearly show lower values than samples made with an increased layer thickness up to 0.2 mm. For example, samples 1 and 10 made with the same parameters (except layer thickness) exhibit stress relaxation at the levels of 0.140 and 0.273, respectively. In almost all cases, increasing the value of the layer thickness increases stress relaxation (doubling the value). It can be noticed that the highest value of stress relaxation, regardless of the layer thickness, was exhibited by samples made with the lowest ED value of 0.032 J/mm2.
Considering stress relaxation as an optimization criterion, it seems that the most advantageous variant of the samples is the positioning of models on the construction platform (PD) at an angle of 0° (Lt 0.2) or 45° (Lt 0.1), setting the lowest possible layer thickness at Lt 0.1 mm and ED at 0.08 J/mm2. It should be noted that in the case of samples where the layer thickness was 0.2 mm, the increase in stress relaxation is clearly noticeable with the decrease of the inclination angle of the sample models (PD) for models made with the highest ED value. Analyzing the results of measurements of mass of the sample models (Table 4), it can be stated that the PD does not affect the density of the model material. Regardless of the PD, the mass of the models remains at the same level. On the basis of samples 1, 4, and 7 (with reduced ED value) and samples 2, 5, and 8 (made with standard process parameters ED), it can be observed that reducing the ED delivered to the sintered powder layer has a positive effect on the mass of the produced models, reducing it in all PD variants by >21%. Analyzing the impact of this change on stress relaxation, it can be concluded that by reducing the ED transmitted to the sintered powder layer, you can build models with reduced mass and satisfactory (high) rheological strength. In the discussed case, stress relaxation is increased by 117%, 47%, and 37%, respectively, where the direction of printing plays a significant role. In the case of analogously prepared samples with a given layer thickness of 0.2 mm, that is, 10, 13, and 16 (ED 0.032 J/mm2) with reference to the basic models 11, 14, and 17 made with ED 0.056 J/mm2, there is a much more pronounced decrease in mass (material density) of models, by 26%, 36%, and 26%, respectively.
Comparing the results of measurements of mass with stress relaxation results, it can be concluded that the samples made with the increased value of the Lt parameter have a mass reduction of ∼30% and an increase in stress relaxation by 58%, 68%, and 324%, respectively. It can be concluded that the following variant PD 90°, ED 0.032 J/mm2, and Lt 0.2 mm is the least favorable variant of the samples, due to the highest decrease in stress relaxation. Based on the results of measurements of the surface texture presented in Tables 5 and 6, it can be stated that the PD and the layer thickness in almost all cases affect the SGPs. The least advantageous variant exhibiting the parameters of the P profile and the S surface with the highest value is the distribution of the sample models relative to the construction platform at an angle of 45°. For the given process parameters (ED and Lt, samples 2, 5, and 8) recommended by the manufacturer (EOS), the parameters of the primary profile (P) with the surface (S) assume the greatest values. In the case of a reduction in the ED delivered to the sintered layer up to the level ED 0.032 J/mm2, in all the mentioned cases the parameters of the SGP structure decrease in value.
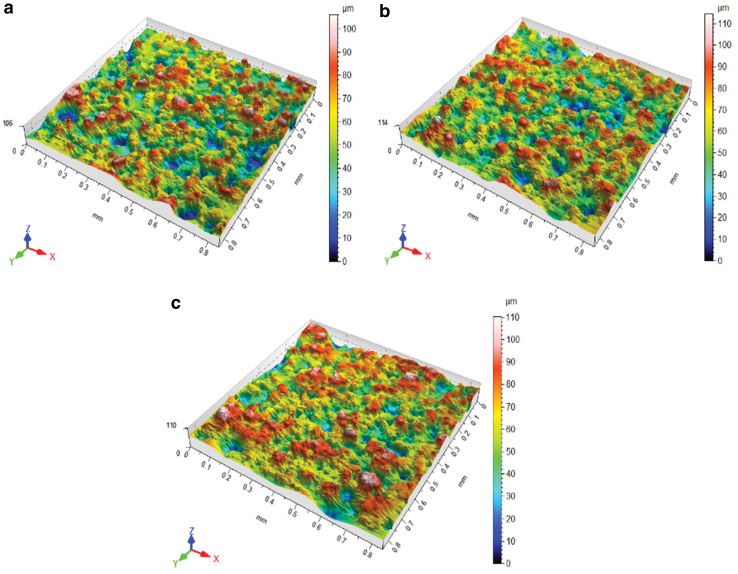
Analyzing graphs 9 and 10, which show the impact of process parameters on the geometric structure of the surface, it can be seen that in the case of samples made with a given layer thickness of 0.1 mm, there are distinct extremes. The parameters Sa and Sz take the highest values for the variant ED 0.056 J/mm2 and 45°. The most advantageous variant is the selection of the inclination angle of 0° and the lowest ED. In the case of samples made with a given thickness of 0.2 mm, it can be also noticed that the angle 0° is the most favorable solution, together with the lowest ED value. Photographs taken with the optical profilometer shown in Figure 11 clearly indicate the phenomenon of the so-called stair step effect. This phenomenon is noticeable in Figure 11b, where models of samples made with the models placed at an angle of 45° are presented. This is indicated by a large number of valleys and peaks on the surface of the constructed layers.
FIG. 11.
Exemplary views of surface texture for three types of orientation: (a) 0°, (b) 45°, and (c) 90°. Color images are available online.
Conclusion
After a quantitative analysis of the test results, it can be concluded that process parameters clearly affect both the mechanical properties, the mass of the model material from which the sample models are made and the quality of the geometric surface texture expressed in the form of SGPs. The distinct effect of both the thickness of the constructed layer, the direction of the models on the construction platform, and the ED supplied to the sintered layer of polyamide powder is noticeable. The following general conclusions can be formulated on the basis of a review of the literature and after the analysis of the presented test results.
The key process parameters directly affecting stress relaxation are layer thickness and ED supplied to the sintered layer. Increasing the thickness of the constructed layer increases stress relaxation in all other variants of selection of process parameters. It is not without significance that the increase in ED has a positive effect on reducing stress relaxation. The influence of PD remains debatable. In the case of printing at an angle of 90° and increasing the layer thickness from 0.1 mm to level 0.2, relaxation increases from 0.076 to 0.108, that is, by ∼42%. However, increasing the ED from 0.056 J/mm2 for the same parameters, stress relaxation is equal to only 0.081, so its value is only 6.5% higher than initially, which clearly shows how the process control allows predicting the mechanical properties of models.
The mass measurements of the manufactured models showed that the PD does not have a direct impact on the density of the model material. It was shown that the most important parameters affecting the density of the material are layer thickness and ED. It can be stated that reducing the mass by reducing the ED or increasing the layer thickness increases the value of stress relaxation; however, this change allows for the construction of models with reduced mass and with a stress relaxation of a satisfactory value. The results of mass test show that there is a real possibility of using the presented tests in industry to build models with reduced mass, even by 30% (samples 1 and 10) when the thickness of the layer changes and 20% when the ED changes (samples 1 and 2).
On the basis of the analysis of the parameters of surface texture in the form of SGPs, it can be stated that the least advantageous variant is the location of samples at an angle of 45° relative to the construction platform. In addition, it has been shown that the reduction in ED during the printing process in selected cases may favorably affect the quality of surface texture, reducing the value of the spatial SGPs.
Author Disclosure Statement
No competing financial interests exist.
Funding Information
No funding was received for this article.
References
- 1. Deckard CR, Beaman JJ, Darrah JF. Method for Selective Laser Sintering with Layerwise Cross-Scanning, US5155324A, 1986. Available at https://patents.google.com/patent/US5155324A/en Accessed on January 21, 2019.
- 2. Feygin M, Shkolnik A, Diamond MN, et al. Laminated Object Manufacturing System, US5730817A, 1996. Available at https://patents.google.com/patent/US5730817A/en Accessed on January 21, 2019.
- 3. Hull C. Apparatus for Production of Three-Dimensional Objects by Stereolithography, US4575330A, 1986. Available at https://patents.google.com/patent/US4575330A/en Accessed on January 21, 2019.
- 4. Meiners W, Wissenbach K, Gasser A. Shaped Body Especially Prototype or Replacement Part Production, DE19649865, 1996. Available at https://patents.google.com/patent/DE19649865C1/en Accessed on January 21, 2019.
- 5. Sachs EM, Haggerty JS, Cima MJ, et al. Three-dimensional printing techniques, US5204055A, 1993. Available at https://patents.google.com/patent/US5204055A/en Accessed on January 21, 2019.
- 6. ASTM F3049-14. Standard Guide for Characterizing Properties of Metal Powders Used for Additive Manufacturing Processes. West Conshohocken, PA: ASTM International, 2014
- 7. Coniglio N, Sivarupan T, El Mansori M. Investigation of process parameter effect on anisotropic properties of 3D printed sand molds. Int J Adv Manuf Technol 2018;94:2175–2185. [Google Scholar]
- 8. Adamczak S, Zmarzły P, Kozior T, et al. Analysis of the dimensional accuracy of casting models manufactured by fused deposition modeling technology. Eng Mech 2017:66–69.
- 9. Fafenrot S, Grimmelsmann N, Wortmann M, et al. . Three-dimensional (3D) printing of polymer-metal hybrid materials by fused deposition modeling. Materials (Basel) 2017;10:1–14. [DOI] [PMC free article] [PubMed] [Google Scholar]
- 10. Kozior T, Trabelsi M, Mamun A, et al. . Stabilization of electrospun nanofiber mats used for filters by 3D printing. Polymers 2019;11:1–11. [DOI] [PMC free article] [PubMed] [Google Scholar]
- 11. Budzik G, Burek J, Bazan A, et al. . Analysis of the accuracy of reconstructed two teeth models manufactured using the 3DP and FDM technologies. Stroj Vestn J Mech Eng 2016;62:11–20. [Google Scholar]
- 12. Kozior T, Döpke C, Grimmelsmann N, et al. . Influence of fabric pretreatment on adhesion of three-dimensional printed material on textile substrates. Adv Mech Eng 2018;10:1–8. [Google Scholar]
- 13. Nowakowski, Skrzyniarz M, Miko E, et al. . Influence of the cutting parameters on the workpiece temperature during face milling. International Conference Experimental Fluid Mechanics 2016—Conference Proceedings 2017;143:523–527. [Google Scholar]
- 14. Bochnia J, Blasiak S. Fractional relaxation model of materials obtained with selective laser sintering technology. Rapid Prototyping J 2018;25:76–86. [Google Scholar]
- 15. Cz. Kundera, Kozior T. Evaluation of the influence of parameters of FDM technology on the selected mechanical properties of models. Proc Eng 2017;192:463–468. [Google Scholar]
- 16. Salmoria GV, Leite JL, Veira LF, et al. . Mechanical properties of PA6/PA12 blend specimens prepared by selective laser sintering. Polym Test 2012;31:411–416. [Google Scholar]
- 17. Gibson I, Rosen DW, Stucker B. Additive Manufacturing Technologies: 3D Printing, Rapid Prototyping, and Direct Digital Manufacturing. New York: Springer, 2014. [Google Scholar]
- 18. Cz. Kundera, Kozior T. Research of the elastic properties of bellows made in SLS technology. Adv Mater Res 2014;874:77–81. [Google Scholar]
- 19. Cz. Kundera, Kozior T. Elastic bellows prepared by selective laser sintering. Appl Mech Mater 2014;630:318–325. [Google Scholar]
- 20. ISO. Technical Committee : ISO/TC 45/SC 2 Testing and analysis - ISO 3384-1:2011: Rubber, Vulcanized or Thermoplastic—Determination of Stress Relaxation in Compression—Part 1: Testing at Constant Temperature. https://www.iso.org/standard/53028.html Accessed on January 15, 2019.
- 21. Kozior T. Analysis of the influence of process parameters of selected additive technologies on the geometry and mechanical properties of products, PhD Thesis, Kielce University of Technology, 2018.
- 22. Pilipović A, Brajlih T, Drstvenšek I. Influence of processing parameters on tensile properties of SLS polymer product. Polymers 2018;10:1–18. [DOI] [PMC free article] [PubMed] [Google Scholar]
- 23. ISO. Technical Committee : ISO/TC 194 Biological and clinical evaluation of medical devices - ISO 10993-1:2010: Biological Evaluation of Medical Devices—Part 1: Evaluation and Testing Within a Risk Management Process. https://www.iso.org/standard/56669.html Accessed on January 15, 2019.
- 24. Taylor Hobson. https://www.taylor-hobson.com Accessed on January 7, 2019.
- 25. Mathia TG, Pawlus P, Wieczorowski M. Recent trends in surface metrology. Wear 2011;271:494–508. [Google Scholar]
- 26. Manual, Formiga P100. https://www.eos.info/en Accessed on January 7, 2019.


