Canadian Urological Association Journal logoLink to Canadian Urological Association Journal
. 2022 Oct;16(10 Suppl 2):S163–S175. doi: 10.5489/cuaj.8072

NSAUA 2022 Annual Meeting Abstracts – General Urology/Best Practices

PMCID: PMC9586579  PMID: 36240114
Can Urol Assoc J. 2022 Oct;16(10 Suppl 2):S163.

Poster #76. The cognitive burden of circumcision status among adult men in the United States

Samuel Pettit 1,, Ash Zawerton, Second Author 2, Ezekiel Young 3,4

Introduction

Considerable controversy persists about how parents should be counselled regarding the circumcision of baby boys. Literature is sparse on attitudes men have toward their circumcision status and how these attitudes impact body image and sexual functioning. The base rate at which men are distressed over their circumcision status has not been reliably estimated and is important to establish to inform public policy. Our objective was to obtain this base rate of distress regarding circumcision status and start to clarify characteristics that might be associated with circumcision status regret and/or dissatisfaction in men.

Methods

A cross-sectional survey was distributed to men (18+ years old, born with a native penis) in the U.S. via Amazon.com’s ‘Mechanical Turk’ survey marketplace in September, October, and November of 2021. Demographic, circumcision, and psycho-emotional data were collected, in part through previously validated surveys including the revised Body Appreciation Scale [BAS-2] and Index of Male Genital Image [IMGI] (measuring overall and genital body image), and the Sexual Quality of Life measure for Men [SQOL-M] (measuring sexual quality of life). A responder was considered “distressed” about their circumcision status if they indicated thinking about it always, often, or sometimes; regretting it a lot or a great deal; and being very dissatisfied or extremely dissatisfied with it; 1006 responses were studied from 1080 collected responses. The 74 excluded responses demonstrated inappropriate responses to attention questions (55), birth without a native penis (8), underage (1), or a repeat respondent (10).

Results

Of 1006 adult male respondents in the U.S., 18 (1.79%) were distressed about their circumcision status, including respondents circumcised at birth, as an adult, and not circumcised (Table 1). Mean circumcision status regret was statistically lower among uncircumcised respondents and higher among respondents circumcised as an adult (Table 2).

Poster #76. Table 1.

Rates of circumcision status distress by circumcision status

Responders % Distressed about circumcision status %
Circumcised neonatally 779 77.4% 14 1.8%
Circumcised as adult 43 4.3% 1 2.3%
Uncircumcised 175 17.4% 3 1.7%
Unknown 9 0.9% 0 0.0%
Total 1006 100% 18 1.8%

Poster #76. Table 2.

Regret & satisfaction of adult men regarding circumcision status by circumcision status

Mean regret* Regret significance (p) Mean satisfaction** Satisfaction significance (p)
Overall U.S. adult male population (comparison mean for p values) 0.38 5.26
Circumcised as adult 1.28 0.000001 5.49 0.28
Circumcised neonatally 0.37 0.84 5.22 0.57
Uncircumcised 0.20 0.0009 5.37 0.35
*

Regret score based on 0–4 Likert scale, where 0 is no regret and 4 is high regret.

**

Satisfaction score based on 1–7 Likert scale, where 1 is high dissatisfaction and 7 is high satisfaction.

Conclusions

Approximately 1.8 % of men in the U.S. over the age of 18 experience distress regarding their circumcision status. Mean regret regarding circumcision status was greatest among those circumcised as an adult and least among those who were uncircumcised. Neonatal circumcision was not associated with increased distress, regret, or reduced satisfaction regarding one’s circumcision status.

Footnotes

Funding: University at Buffalo, Department of Urology

Can Urol Assoc J. 2022 Oct;16(10 Suppl 2):S163–S164.

Poster #79. Micro-cost analysis of single-use vs. reusable cystoscopy in a single-payer healthcare system

Jaehoon Kim 1, Bruce Gao 1, Bilal Chughtai 2, Naeem Bhojani 3, Kevin C Zorn 3, Dean Elterman 1,

Introduction

Single-use flexible diagnostic cystoscopy has recently been developed, with comparable functionality to reusable cystoscopes. Prior studies have demonstrated considerable contribution of upfront costs of reusable cystoscopy. The objective of this study was to compare costs of reusable cystoscopy to single-use cystoscopy in a single-payer socialized healthcare system.

Methods

A retrospective micro-cost analysis of reusable cystoscopy in a single institution was performed. The cost analysis was divided into capital, maintenance, reprocessing, and labor. Costs were amortized over 5- and 10-year basis as appropriate. The results were compared to theoretical costs of single-use cystoscopes.

Results

There were 3415 annual average cystoscopy cases, with 171 cases per reusable cystoscope. The capital, maintenance, reprocessing, and labor costs of reusable cystoscopy were $96 000, $99 867, $247 855, and $65 317, respectively. The total annual costs per case for reusable and single-use cystoscopy were $149.06 and $245.57, respectively. The cost of reusable cystoscopy decreased with the number of procedures per year and intersected the costs of single-use cystoscopes at 1265 procedures per year (Figure 1). All costs are in $CAD.

Poster #79. Figure 1.

Poster #79. Figure 1

Comparing costs per case for reusable and single-use cystoscope based on number of cases.

Conclusions

The cost-effectiveness of reusable cystoscopes is dependent on cystoscopy volume due to considerable upfront costs. Single-use cystoscopes are more cost-effective if total cases performed is less than 1265 per year. Additional investigation into the cost-effectiveness of single-use cystoscopes as supplements in outpatient setting or primary endoscopes in inpatient/emergency settings should be performed.

Can Urol Assoc J. 2022 Oct;16(10 Suppl 2):S164.

Poster #80. Private equity involvement in urology does not affect practice patterns

Cameron Jones 1,, Danielle Sharbaugh 2, Stephen Kisty 3, Divya Natesan 3, Charlotte Stahlfeld 3, Sarah Erpenbeck 3, Cailey Guercio 1, Bruce Jacobs 1, Benjamin Davies 1

Introduction

Private equity investments in urology have ballooned over the past several years; however, little is known about the effects of private equity acquisitions on physician practice patterns. There is concern that private equity may amplify undesirable incentives in a fee-for-service model. We report the volume of several common urological procedures and office visits before and after private equity investment to assess the potential effect on practice patterns.

Methods

Transactions between urology practices and private equity firms were identified via the existing literature; transactions in 2019 or later were excluded to permit at least 1 year of post-transaction data. Service and procedure volume by provider was extracted from the “Medicare Physician & Other Practitioners by Provider and Service” dataset from 2013–2019. Providers were grouped by practice and those not employed for at least 1 year prior to private equity involvement were excluded. Postvoid residual, uroflow, urodynamics, cystoscopy, prostate biopsy, shockwave lithotripsy, and ureteroscopy were chosen for analysis. Trends were analyzed graphically, and an unpaired t-test was used to compare services provided pre- and post-transaction.

Results

A total of 1 248 131 office visits and 683 153 procedures were analyzed over a 5-year period. Figure 1 shows trends in procedures per visit and visit-complexity coding over time. Qualitatively, practice patterns did not appear to change significantly with private equity involvement, with the exception of urodynamics. Urodynamics performed per patient did increase in the year of the private equity transaction and this was statistically significant (p=0.007). No other statistically significant differences between procedures or office visit coding pre- and post-private equity were identified.

Poster #80. Figure 1.

Poster #80. Figure 1

(A–G) Procedures per office visit by year in which private equity investment occurred. (H, I) New and followup office visits, respectively, with each billing level plotted separately. Vertical dashed line indicates year of private equity transaction. *0 represents the year in which private equity investment occurred, negative values the years preceding, and positive vaules the years following.

Conclusions

Private equity involvement in healthcare has raised concern about amplifying a suboptimal incentive structure that may result in more quantity rather than quality of care in a fee-for-service model. This study, which encompasses the largest urology practices with private equity involvement, did not demonstrate any significant changes in practice patterns over time, suggesting that private urology groups are finding cost-efficiencies elsewhere.

Can Urol Assoc J. 2022 Oct;16(10 Suppl 2):S164.

Poster #81. Renal colic imaging practice patterns in Ontario — a population-based study

Danielle Jenkins 1,, Greg Hosier 2, Marlo Whitehead 3, Rebecca Griffiths 3, Thomas McGregor 1, D Robert Siemens 1

Introduction

CT scans are associated with increased cost and exposure to radiation when compared to ultrasound (US) in patients presenting with renal colic. Consequently, Choosing Wisely and several guidelines recommend that US be used over CT in uncomplicated presentations of renal colic. The objective of this study was to describe imaging practice patterns in Ontario among patients presenting with renal colic and the relationship between initial imaging modality, subsequent imaging, and burden of care indicators.

Methods

This is a population-based study of patients who presented with renal colic in Ontario between 2003 and 2019 using administrative data. Patients were assessed according to the imaging modality they had during their index visit. Descriptive statistics and the Chi-squared test were used to examine differences between these groups. The primary outcome was the need for subsequent imaging. Secondary outcomes included length of renal colic episode, days to surgery, number of emergency department visits, and number of primary care visits during the renal colic episode.

Results

A total of 429 060 patients were included in the final analysis. Of those, 50.5% (216 747) had a CT scan as their initial imaging modality, 19.7% (84 672) had an US, and 3.2% (13 643) had both a CT and an US on the same day. Subsequent imaging was obtained in 40.7% of those who had a CT scan as the initial imaging, compared to 42.9% in those who had an US and 43.1% who had both an US at CT on the same day. Of those who initially had an US, 21.9% went on to have at least one CT scan during their renal colic episode, while 78.1% were able to avoid a CT scan altogether. The length of the renal colic episode was slightly longer in those who had a CT first compared to US (RR 1.005 CI 1.000–1.009); however, the time to surgery was less in those who had a CT first (RR 0.831 CI 0.807–0.856). Fewer emergency department and family physician visits were seen in those who had an initial CT.

Conclusions

In patients presenting with renal colic in Ontario, approximately half are having a CT done as the initial imaging modality despite US being the recommended imaging modality in uncomplicated renal colic presentations. Those who have an US done first are often able to avoid subsequent CT scans. Efforts should be made to encourage the use of US in those presenting with renal colic rather than CT when clinically indicated.

Can Urol Assoc J. 2022 Oct;16(10 Suppl 2):S165–S166.

Poster #82. Preoperative stents and previous cystoscopy associated with decreased emergency department visits for stent colic

Aaron Huang 1,2,, Corey Weinstein 1,2, So Yeon Pak 1,2, Jacob Bamberger 1,2, Jacob Gaines 1,2, Bethany Desroches 1,2

Introduction

Ureteral stents are commonly used in the management of renal and ureteral calculi. Stent-related colic (SRC), a frequent complication of stent placement, can greatly decrease a patient’s quality of life. There is ample literature on which stent properties lead to worse outcomes, from its diameter to its positioning, but studies on the association between patient-specific characteristics and stent colic are sparse. The objective of this study was to expand on predictors of stent colic, focusing on patient-specific characteristics that predispose a patient with SRC to present to the emergency department (ED).

Methods

We reviewed the records of all patients who underwent cystoscopy for stent placement or exchange at a single institution from December 17, 2019 to January 20, 2021. Patients were classified into two groups: 1) those who visited the ED within 90 days postoperatively for SRC; and 2) those who did not visit the ED at all or visited the ED within 90 days postoperatively for issues not related to stent colic (NSRC). Patient demographics and relevant clinical data were collected from the electronic medical record.

Results

One hundred thirty nine patients were included in this study. Forty-five patients visited the ED at least once within the 90-day postoperative period, and 21 patients met criteria to be defined as SRC. No demographic differences were found between the SRC and NSRC groups. Significantly more patients in the NSRC group had a history of cystoscopic/endoscopic procedures compared to the SRC group (57.6% vs. 28.6%, p=0.020). Additionally, a higher proportion of patients in the NSRC group had preoperative stents compared to the SRC group (42.4% vs. 9.5%, p=0.004). No other preoperative medical differences were found (Table 1).

Poster #82. Table 1.

Preoperative characteristics of patients

ED visit due to Stent-related colic within 90 days

Variables No (n=118) Yes (n=21) p
 Age (years) 49.5 49.1 0.910
 Race 0.753
  Black/African American, non-Hispanic/Latino 68.1% 71.4%
  Black/African American, Hispanic/Latino 1.7% 4.8%
  White Hispanic/Latino 5.2% 4.8%
  White non-Hispanic/Latino 4.3% 0.0%
  Asian 1.7% 4.8%
  Not identified 19.0% 14.3%
 Sex 0.926
  Male 48.7% 47.6%
  Female 51.3% 52.4%
 ASA Score 0.241
  1 0.9% 0.0%
  2 50.4% 75.0%
  3 39.1% 25.0%
  4 9.6% 5.0%
 Number of comorbidities 3.0 2.1 0.167
 History of kidney stones 70.3% 61.9% 0.407
 History of cystoscopy/Endoscopic procedures 57.6% 28.6% 0.020
 Preoperative stent 42.4% 9.5% 0.004

Conclusions

Stent-naive patients and those without a history of cystoscopic procedures were significantly more likely to present to the ED postoperatively with complaints of SRC, suggesting a need for greater counselling and close postoperative monitoring among this group of patients. These findings are the first to explore patient characteristics in relation to SRC and should be studied further.

Can Urol Assoc J. 2022 Oct;16(10 Suppl 2):S166.

Poster #83. Urologist involvement in preoperative antegrade access improves utility for percutaneous nephrolithotomy

Mitchell Alameddine 1,, Christopher Staniorski 1, Michelle Semins 1

Introduction

Gaining antegrade access for percutaneous nephrolithotomy (PCNL) can be challenging, especially in patients with anatomic abnormalities who often suffer from large stone burdens. Emergently placed nephrostomy tubes have previously been shown to require additional access at the time of PCNL in 21–51% of patients. The purpose of this study is to determine the utility of preoperatively placed nephrostomy tubes when a urologist was involved in planning of access with consideration of subsequent PCNL. The primary objective was to examine rates of new access at the time of PCNL in patients with and without a urologist involved in planning of access.

Methods

We conducted a retrospective review of patients undergoing PCNL at a single hospital from 2011–2022. Adult patients undergoing PCNL with established preoperative access were included. Chart review evaluated demographics, comorbidities, complications, stone-free rate, and operative variables.

Results

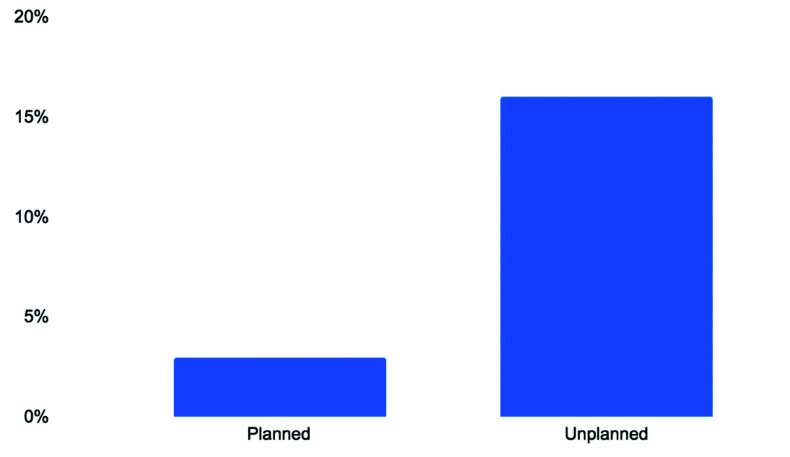
A total of 141 cases with preoperative access (119 patients) were included, with 111 cases planned with interventional radiology prior to antegrade access. There were high rates of anatomic abnormality (49.6%) and staghorn calculus (53%) that were similar among those with and without planning, while patients with planned access had higher BMI. Both groups frequently used the preoperative access (97%); however, 6% required additional access to be obtained intraoperatively to complete the procedure, with higher rates in those with unplanned access (3% vs. 16%, p<0.05) (Figure 1). Stone-free rates (90%) and total stages (2) were similar between planned and unplanned groups. Planned access, however, trended towards ureteroscopy as a second stage as opposed to PCNL. Complications were similar between groups.

Poster #83. Figure 1.

Poster #83. Figure 1

Need for additional intraoperative access.

Conclusions

In this retrospective review of complex patients with large stone burden presenting for PCNL with preoperative antegrade access, planned access with the urologist’s involvement was associated with a low rate of requiring new intraoperative access. Preoperative access also appears to lead to higher rates of second-stage ureteroscopy compared to second-look percutaneous nephrostomy. Communication between urologists and interventional radiologists prior to nephrostomy tube placement may improve outcomes for those undergoing subsequent PCNL.

Can Urol Assoc J. 2022 Oct;16(10 Suppl 2):S166–S167.

Poster #84. What is the incidence of fortuitous findings of fatty liver on ultrasound of patients followed for nephrolithiasis?

David Bouhadana 1,, David-Dan Nguyen 1, Philip Wong 2, Sero Andonian 3

Introduction

Hepatic steatosis is often diagnosed incidentally on imaging reports when surveying for renal stones. The incidence and implications of these findings on ultrasound reports of kidney stone patients are unknown. Considering that delayed management of significant hepatic steatosis can lead to progression and poor outcomes, we sought to determine the incidence and predictors of incidental ultrasound findings of hepatic steatosis and characterize the management of these patients.

Methods

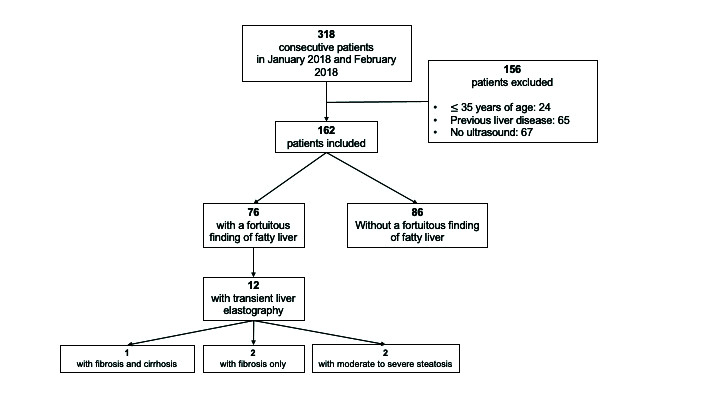
Medical records of 318 consecutive nephrolithiasis patients between January and February 2018 were retrospectively reviewed. Patients with no previous liver disease, 35 years of age or older, and with available ultrasound imaging were included. Figure 1 depicts patient selection. Ultrasound reports were reviewed for any incidental finding of hepatic steatosis and the degree of steatosis. Patient demographic predictors of incidental hepatic steatosis were identified using univariable logistic regression models.

Poster #84. Figure 1.

Poster #84. Figure 1

Study patient selection.

Results

One-hundred and sixty-two patients met the inclusion criteria, of which 76 (46.9%) had a finding of hepatic steatosis of any severity and 22 (13.6%) of moderate-to-severe severity. Predictors of finding incidental hepatic steatosis included a higher body mass index (BMI) (odds ratio [OR] 1.2, 95% confidence interval [CI] 1.1–1.2, p<0.001) and smoking (OR 2.6, 95% CI 1.4–5.1, p=0.004). Baseline demographics can be found in Table 1. Of the patients with any-severity incidental finding of hepatic steatosis, steatosis progression was noted for 13 (17.1%) and regression was noted for 2 (2.6%). Twelve patients were referred to hepatology for further liver investigations. Among these patients, 1 (8.3%) had cirrhosis, 2 (16.7%) had fibrosis, and 2 (16.7%) had moderate-to-severe steatosis.

Poster #84. Table 1.

Baseline demographic information by presence of fortuitous finding of fatty liver on ultrasound

Baseline demographic information No fortuitous fatty liver on ultrasound (n=86) Fortuitous fatty liver on ultrasound (n=76) p
 Age, mean (SD) 61.0 (13.2) 58.6 (11.3) 0.23
 Gender, n (%) Male 49 (57%) 50 (66%) 0.25
Female 37 (43%) 26 (34%)
Other 0 (0%) 0 (0%)
 Alcohol consumption, n (%) No 47 (55%) 35 (47%) 0.60
Yes 38 (45%) 39 (53%)
 Smoking history, n (%) No 62 (73%) 38 (51%) 0.004
Yes 23 (27%) 37 (49%)
 Body mass index (kg/m2), mean (SD) 25.9 (4.5) 29.7 (5.6) <0.001
 Dyslipidemia, n (%) No 58 (68%) 47 (62%) 0.40
Yes 27 (32%) 29 (38%)
 Hypertension, n (%) No 59 (69%) 44 (59%) 0.16
Yes 26 (31%) 31 (41%)
 Diabetes, n (%) No 76 (89%) 58 (78%) 0.06
Yes 9 (11%) 16 (22%)
 Stone composition, n (%) Calcium oxalate 41 (48%) 34 (45%) 0.09
Calcium phosphate 5 (6%) 4 (5%)
Carbonate apatite 1 (1%) 6 (8%)
Uric acid 8 (9%) 4 (5%)
Cystine 1 (1%) 0 (0%)
Not available 30 (35%%) 28 (37%)
 Urine pH, mean (SD) 6.2 (1.0) 6.6 (1.1) 0.03
 Urine volume (L), mean (SD) 2.0 (0.8) 2.0 (0.7) 0.80
 Serum uric acid (umol/L), mean (SD) 315.3 (71.9) 326.3 (83.0) 0.53
 Creatinine (μmol/L), mean (SD) 90.5 (37.3) 81.6 (23.0) 0.13
 Number of ultrasound imaging tests, median (IQR) 2 (1–4) 3 (2–3.5) 0.59

Conclusions

The incidental finding of fatty liver on ultrasound of patients followed for nephrolithiasis is common, especially in overweight or smoker patients. While only a small proportion of these patients have significant fibroscan-confirmed fibrosis or cirrhosis, urologists could initiate lifestyle changes that improve outcomes for both liver and kidney stone diseases and refer to gastroenterology/hepatology when appropriate.

Can Urol Assoc J. 2022 Oct;16(10 Suppl 2):S168.

Poster #85. Incidence and trends in the treatment of kidney stones in Canada: A population-based cohort study

Michael Ordon 1,, Andrea Lantz Powers 2, Ben Chew 3, Jason Lee 1, Michael Kogon 1, Sri Sivalingam 4, Shubha De 5, Naeem Bhojani 6, Sero Andonian 7

Introduction

Our aim was to assess the incidence of acute care kidney stone events, trends in the surgical treatment of stones, and the demographics of stone formers in Canada, as no such data exists. This data is important for prevention and resource planning.

Methods

We conducted a population-based, retrospective cohort study using administrative data from the Canadian Institute for Health Information. We included Canadian residents age >18, outside of Quebec, who presented between January 1, 2013 and December 31, 2018, with an acute care kidney stone event. This was defined as a stone resulting in hospital admission, emergency room visit (in select provinces), or stone intervention, specifically shockwave lithotripsy (SWL), ureteroscopy (URS), or percutaneous nephrolithotomy (PCNL). One stone intervention per 90 days for each person was included. Demographics and treatment utilization were reported by year and province.

Results

There were 471 824 stone events, including 184 373 interventions. The number of stone events increased from 359/100 000 in 2013 to 393/100 000 in 2018. The median age was 53 (IQR 41–65) and 59.9% were male. Across Canada, the crude rate for stone intervention was 877/100 000. The age and gender standardized rate for intervention was highest in Nova Scotia (NS) and Newfoundland and Labrador (NL) and lowest in PEI. The most common intervention in Canada was URS (73.5%), followed by SWL (19.8%) and PCNL (6.7%). The percent utilization of SWL was highest in Manitoba (MN) and NL, and lowest in PEI and Alberta (AB). The percent utilization of URS was highest in PEI and AB, and lowest in NL and MN (Table 1). The standardized rate for URS was highest in NS, whereas for SWL and PCNL, it was highest in NL (Table 2).

Poster #85. Table 1.

Treatment use by province

Treatment Modality Province
N (%) British Columbia Alberta Saskatchewan Manitoba Ontario New Brunswick Nova Scotia Prince Edward Island Newfoundland and Labrador Territories
 URS 22 712 (64) 23 339 (84.5) 4510 (71) 3386 (39) 65 040 (81) 4296 (77) 7931 (64) 688 (96) 3626 (51) 70 (61)
 SWL 10 528 (30) 2,099 (7.6) 1578 (25) 4829 (56) 9863 (12) 777 (14) 3781 (31) 16 (2) 2908 (41) 37 (32)
 PCNL 2156 (6) 2167 (7.9) 233 (4) 442 (5) 5684 (7) 482 (9) 630 (5) 14 (2) 544 (8) 7 (6)
 Total 35 396 27 605 6321 8657 80 587 5555 12 342 718 7078 114

Poster #85. Table 2.

Crude and standardized rate for resource use by province

Region Any intervention URS SWL PCNL

Crude1 (per 100 000) Standardized2 (per 100 000) Crude1 (per 100 000) Standardized2 (per 100 000) Crude1 (per 100 000) Standardized2 (per 100 000) Crude1 (per 100 000) Standardized2 (per 100 000)
 Overall3 876.9 561.4 169.6 47.8
  British Columbia 925.3 882.4 545.2 520.2 253.3 243.7 47.8 45.3
  Alberta 841.0 921.8 631.8 683.0 61.3 65.9 54.4 60.2
  Saskatchewan 727.5 767.5 445.8 470.1 183.2 193.6 22.0 23.3
  Manitoba 887.8 938.5 281.0 297.1 527.8 557.6 35.7 37.8
  Ontario 771.2 769.7 540.0 539.4 89.1 89.2 44.1 44.0
  New Brunswick 927.4 852.9 641.2 593.5 144.5 131.4 67.5 62.0
  Nova Scotia 1755.9 1620.6 988.1 915.5 594.4 550.4 73.4 67.4
  PEI 584.4 549.4 535.6 504.6 11.3 10.8 9.9 9.7
  Newfoundland and Labrador 2164.6 1931.2 758.4 677.0 756.7 678.1 109.8 98.2
1

2016 Provincial population (age 18+) used as denominator.

2

Total 2016 population for study provinces (age 18+) used as standard population.

3

Total 2016 population for study provinces (age 18+) used as denominator.

Conclusions

Our study provides the first population-based data on the demographics of stone formers and treatment trends in Canada. There has been a 4% increase in acute care kidney stone events over 5 years. Those presenting to hospital or requiring intervention for a kidney stone are more likely to be male, between the age of 41–65 and undergo URS.

Footnotes

Funding: Canadian Endourology Group

Can Urol Assoc J. 2022 Oct;16(10 Suppl 2):S168–S169.

Poster #86. Association of pregnancy to nocturia: Findings from the National Health and Nutrition Examination Survey

Lakshay Khosla 1,, Aaron Huang 1, Nikhil Kasarla 1, Thomas Monaghan 2, Jeffrey Weiss 1, Abdo Kabarriti 1

Introduction

The purpose of this study was to determine the impact of pregnancy and pregnancy-associated characteristics on nocturia.

Methods

Using the National Health and Nutrition Examination Survey (NHANES) database from 2005/06–2017/18, we sorted women who completed the “Reproductive Health” and “Kidney Conditions-Urology” questionnaires into 3 groups: nulligravida, previously pregnant (non-pregnant females with prior pregnancies), and currently pregnant. Using a case-control design, we weighed the sample using the NHANES sampling strategy and then matched for age, race, BMI, and number of prior pregnancies. Patients with conditions associated with nocturia, use of female hormones, history of hysterectomy, and incomplete or missing responses to questions being studied were excluded. Binary logistic regression and Chi-squared analysis were used to assess the relationship of pregnancy and pregnancy-associated characteristics (gestational diabetes (GDM), history of multiple pregnancies, and trimesters) to nocturia (≥2 nocturnal voids). ANOVA with post-hoc Games-Howell was used to compare mean number of nighttime voids.

Results

A total of 1544 females (523 nulligravida, 498 previously pregnant, and 523 currently pregnant; age range 20–44 years) were analyzed. Groups did not differ in mean age, mean BMI, race distribution, and number of prior pregnancies distribution. Currently pregnant females had a higher prevalence of nocturia than previously pregnant and nulligravida females (56.4% vs. 22.5% vs. 16.1%, p<0.001). Using the nulligravida group as reference, the currently pregnant (OR 6.82, 95% CI 5.10–9.12, p<0.001) and previously pregnant (OR 1.52, 95% CI 1.11–2.08, p=0.009) groups showed an association to nocturia, while those with GDM or history of multiple pregnancies showed no associations. Increasing trimesters were associated with greater odds of nocturia (ORs ranging from 4.08–10.35) for currently pregnant patients (Table 1). The third trimester had the highest odds of nocturia (OR 10.35, 95% CI 6.83–15.67, p<0.001) and a greater mean number of nighttime voids than the first and second trimesters (2.40±1.42 vs. 1.56±1.31 vs. 1.88±1.32, p<0.001). Average number of nighttime voids did not differ between patients grouped by status of GDM or multiple pregnancies.

Poster #86. Table 1.

Odds of nocturia based on pregnancy characteristics in currently pregnant women

Pregnancy characteristic OR (95% CI) p
 Gestational diabetes* 1.60 (0.66–3.88) 0.298
 Multiple pregnancies* 0.91 (0.59–1.40) 0.672
 Trimesters**
  1st 4.08 (2.52–6.58) <0.001
  2nd 5.96 (4.02–8.85) <0.001
  3rd 10.35 (6.83–15.67) <0.001
*

Reference group: Currently pregnant patients without these characteristics.

**

Trimesters reference group: Nulligravida patients

Conclusions

Pregnancy was associated with nocturia, with the third trimester showing the greatest odds and mean nighttime voids. These findings may be due to increasing fetal size, hormonal changes, or pelvic floor dysfunction, although further investigations are needed.

Can Urol Assoc J. 2022 Oct;16(10 Suppl 2):S169.

Poster #87. Effect of UTI education on patient understanding and quality of life

Nicole Belko 1,, Leah Ashton 2, Teresa Danforth

Introduction

A urinary tract infection (UTI) is an infection of any part of the urinary tract, including the bladder, ureter, and kidneys, typically by uropathogenic bacteria. Approximately one-third of women have a UTI by age 24. UTIs are the most common cause of outpatient infection, with a lifetime incidence of 50–60%. Recurrent urinary tract infections are 2 or more infections within 6 months or 3 or more infections within one year. Over 25% of college-age adults diagnosed with their first UTI, had recurrence within 6 months. Though there is such a heavy prevalence throughout our population, many patients are unaware of what a UTI is or ways to prevent them, leading to clinic appointments for discussion. Informational

Methods

UTI pamphlets were created to provide a source of education on this common disease. This is a survey-based case series investigating the efficacy of UTI pamphlets on patient understanding and precaution techniques. The goal is to assess overall knowledge and prevention tools before and after receiving educational pamphlets, and what impact this has on UTI recurrence and patient quality of life.

Results

To date, 128 patients have filled out the primary survey and 26 patients have filled out both surveys. Preliminary data suggests patients are more informed on UTIs at followup visits after receiving the educational pamphlet a few weeks prior and use preventative measures (Table 1).

Poster #87. Table 1.

The percentage of participants who utilized the 12 preventative measures listed pre- and post-education with pamphlet.

Preventative Measures Pre Education % Post Education % Change in %
0/12 11.02% 0.00% 11.02%
1/12 8.47% 0.00% 8.47%
2/12 8.47% 11.76% −3.29%
3/12 5.93% 0.00% 5.93%
4/12 5.93% 5.88% 0.05%
5/12 9.32% 17.65% −8.33%
6/12 11.86% 23.53% −11.67%
7/12 17.80% 0.00% 17.80%
8/12 9.32% 11.76% −2.44%
9/12 6.78% 17.65% −10.87%
10/12 4.24% 0.00% 4.24%
11/12 0.85% 5.88% −5.03%
12/12 0.00% 5.88% −5.88%

Conclusions

This can potentially lead to decreased healthcare costs and patient morbidity.

Can Urol Assoc J. 2022 Oct;16(10 Suppl 2):S169–S170.

Poster #88. An analysis of the proportion of women urologists treating male sexual dysfunction

Nicole Alavi-Dunn 1,2, Finn Hennig 1,, Adam Russon 1,2, Zafardjan Dalimov 3, Matthew Brennan 1,2

Introduction

Female representation within urology is increasing annually. The 2020 AUA census reports that 10.3% (13 352) of practicing urologists identify as female. Previous studies show females treat gender-concordant patients at a disproportionately high rate, but none have looked at the distribution of female urologists treating uniquely male conditions. We aim to evaluate the proportion of females providing care for male sexual dysfunction (MSD).

Methods

We analyzed American Board of Urology (ABU) case log data from 2012–2021. CPT codes for prosthesis implantation/revision, Peyronie’s surgery, Peyronie’s injection, and intracavernosal injection for erection were used to identify cases due to their association limited to male sexual health. Cases were excluded if the patient’s gender was female or not reported, patient age was <18, or surgeon gender was not reported. Higher-volume providers were defined as >10 procedures per calendar year. Data was analyzed using R with Chi-squared and Mann-Whitney U tests, with p<0.05 as the limit of statistical significance.

Results

We analyzed 51 923 cases over the years 2012–2021, with female urologists accounting for a total of 4726 (7.5%) of the total cases and males accounting for 58 023 (92.5%) (p<0.001). The highest proportion of female urologist’s case logs was in 2017 at 12.7% and the lowest in 2013 at 1.2%. The median percent of cases done by males and females per year were 94.6% (IQR 91.2–95.7) and 5.4% (IQR 4.3–8.8), respectively; the distributions in the two groups differed significantly (Mann-Whitney U=100, n1=n2=10, p<0.00002). Additionally, a significant difference was seen between gender of high-volume urologists (>10 cases/year) treating MSD, with median of 31 females per year (IQR 22–35) compared to 361 males (IQR 349–414) (Mann–Whitney U=100, n1=n2=10, p<0.0002) (Figure 1).

Poster #88. Figure 1.

Poster #88. Figure 1

Percent of high-volume female urologists treating MSD by year.

Conclusions

While overall women surgeons remain a minority of certifying urologists who perform MSD cases, a steady trend of increasing proportion of certifying women surgeons relative to male counterparts is demonstrated over time. The proportion of women urologists performing high volumes of MSD cases is catching up to the expectation given the number of women in the workforce.

Can Urol Assoc J. 2022 Oct;16(10 Suppl 2):S170.

Poster #89. Postoperative outcomes of kidney stone surgery in patients with spinal cord injury: A systematic review and meta-analysis

John Kim 1,, Veronica Stewart 2, Gaurav Talwar 2, Michael Uy 1, Jen Hoogenes 1,3, Edward D Matsumoto 1,3

Introduction

Spinal cord injury (SCI) is associated with an increased risk of nephrolithiasis and surgical treatment in this population may be associated with a greater risk of complications and worse stone clearance. We conducted a systematic review examining surgical treatment of kidney stones in SCI patients and performed a meta-analysis of four comparative studies to compare outcomes of percutaneous nephrolithotomy (PCNL) in SCI and non-SCI patients with kidney stone disease.

Methods

The MEDLINE, Embase, CENTRAL, and Web of Science databases were searched for studies examining outcomes of kidney stone procedures in SCI patients. Primary outcomes were stone-free rate (SFR) and complications as categorized by the Clavien-Dindo classification system. A meta-analysis was performed to assess differences in SFR and complication rate between SCI and non-SCI patients following PCNL.

Results

A total of 27 articles were included. Interventions for kidney stones included PCNL, shockwave lithotripsy (SWL), and ureteroscopy; 21.1% of procedures involved treatment of bilateral kidney stones and 33.8% of procedures involved the treatment of staghorn stones. The median reported stone size was 16.1 mm (interquartile range [IQR] 15.6–33.1 mm). Almost half (48.1%) of SCI patients had bacteriuria prior to treatment and 68.1% of analyzed stones were composed of struvite. SFR in SCI patients undergoing surgery for kidney stones was 54.1% for SWL, 73.6% for PCNL, and 36.2% for ureteroscopy. Four studies compared outcomes following PCNL in SCI and non-SCI patients. Meta-analysis of comparative studies found that there was higher risk of grade 1 (odds ratio [OR] 10.04, 95% confidence interval [CI] 3.67–27.48), grade 2 (OR 3.38, 95% CI 1.85–6.18), and grades 3–5 (OR 2.57, 95% CI 1.08–6.14) complications in SCI patients compared to non-SCI patients following PCNL (Figure 1). There was no difference in SFR (OR 0.64, 95% CI 0.15–2.64) between groups.

Poster #89. Figure 1.

Poster #89. Figure 1

Meta-analysis of postoperative outcomes between SCI and non-SCI patients. (a) Stone-free rates; (b) grade 1 complications; (c) grade 2 complications; (d) grade 3–5 complications.

Conclusions

Nephrolithiasis in SCI patients is associated with bilateral stone disease, large (>10 mm) stones, staghorn stones, and struvite stones. Patients in this subpopulation are at higher risk of both minor and major complications following PCNL compared to non-SCI patients. There was no significant difference between groups in SFR following PCNL. Overall, PCNL is an effective surgery for kidney stones in SCI patients.

Can Urol Assoc J. 2022 Oct;16(10 Suppl 2):S171.

Poster #90. Septic and febrile kidney stone presentation during the COVID-19 pandemic: What is the effect of lack of access to care during pandemic restrictions?

Jesse Spooner 1,, Kaveh Masoumi-Ravandi 1, Gabriela Ilie 1,2,3,4, Thomas Skinner 1, Andrea Lantz Powers 1

Introduction

At the Nova Scotia Health hospitals in Halifax, a subjective increase in the number of septic/febrile patients requiring emergent stone therapy has been observed. This may be due to reductions in elective surgeries and limited access to laboratory tests, such as urinalysis and culture. This study examined the volume and severity of septic stone patients requiring emergent intervention amidst the COVID-19 pandemic healthcare restrictions.

Methods

In this retrospective, single-center, observational study, we reviewed the charts of all urgent or emergent septic stone patients requiring ureteral stent insertion from August 2019 to January 2020 (pre-COVID cohort) and August 2020 to January 2021 (intra-COVID cohort). The primary outcome was the number of patients requiring stenting. Secondary outcome included the number of patients classified as emergency status as per the American Society of Anesthesiologists (ASA) classification.

Results

The number of septic stone presentations increased by approximately 17% during the COVID pandemic (24 patients pre-COVID vs. 28 patients intra-COVID). There was an increase in patients classified as emergency (ASA) of approximately 62% (13 patients pre-COVID vs. 21 patients intra-COVID). The pre-COVID timeframe showed a predominance of women (n=18) compared to men (n=6) similar to the intra-COVID cohort demonstrating 21 females and 7 men. The mean age for the pre- and intra-COVID cohorts were 60.1 and 59.9 years, respectively.

Conclusions

An increased number of patients required ureteral stent insertion for septic kidney stones during COVID-related reductions in healthcare. The number of patients classified as an emergency procedure (ASA classification) increased. The exact cause is unknown but during this timeframe there was delayed urological followup, lack of access to primary care, deferred elective treatment, limited access to lab testing, and a reluctance by patients to seek medical care due to fear of exposure to COVID-19.

Can Urol Assoc J. 2022 Oct;16(10 Suppl 2):S171.

Poster #91. “Low-dose” fluoroscopy technique drastically decreases patient radiation exposure during percutaneous nephrolithotomy

Galen Cheng 1,, Timothy Campbell 1, Changyong Feng 2, Scott Quarrier 1, Rajat Jain 1

Introduction

Fluoroscopy is essential in percutaneous nephrolithotomy (PCNL) but exposes patients and operating room staff to radiation. We investigated whether a “low-dose” (LD) protocol could reduce radiation exposure during fluoroscopy-guided access without compromising clinical outcomes.

Methods

Patients undergoing PCNL with fluoroscopy-guided access at a tertiary care stone center between January 2019 to July 2021 were identified. Prior to September 3, 2020, the Philips Veradius C-arm’s default settings were used: standard “per-frame” dose, 15 pulses per second (PPS) frame rate. After this date, a “low-dose” protocol was used: reduced “per-frame” dose, reduced frame rate of 8 PPS for needle puncture and 4 PPS for all other steps. Clinical and radiographical data were retrospectively collected. The primary outcome was cumulative radiation dose. Secondary outcomes were stone-free status (SFS; defined as no fragments ≥2 mm) and complications. Multivariate regression analysis was performed.

Results

One hundred patients were identified; 31 were in the LD group. The LD cohort was exposed to a significantly lower mean cumulative radiation dose of 11.68 mGy compared to 48.88 mGy (p<0.0001). There were no differences in operative time, fluoroscopy time, stone burden, SFS, or complications. In a multivariable regression model adjusting for several variables, LD protocol was associated with lower radiation dose, while skin-to-calyx-distance (STCD) was positively associated with cumulative radiation dose. Higher preoperative stone burden was associated with longer operative time (p=0.0001) and lower odds of postoperative SFS (OR 0.959, p=0.0007) (Table 1).

Poster #91. Table 1.

Comparison of demographics, clinical factors, and clinical outcomes between patients receiving either the standard or low-dose protocol

Standard Low-dose p
Age 57.07±13.80 61.13±13.01 0.1624
BMI 32.5±7.94 30.9±7.28 0.3185
Pre-op stone burden (mm) 40.56±24.25 45.41±36.39 0.5029
Skin to calyceal distance (mm) 101.11±22.69 94.55±28.56 0.2713
Fluoroscopy time (sec) 147.62±73.94 123.59±67.02 0.1133
Operative time (min) 136.45±40.86 129.29±47.75 0.4723
Cumulative radiation dose (mGy) 48.88±36.84 11.68±7.01 <0.0001*
Stone-free status 75.41% 67.86% 0.4559
Postoperative complications 21.74% 12.90% 0.7394
*

Denotes significance. Results are reported in mean ± standard deviation and percentages.

Conclusions

“Low-dose” fluoroscopy and decreased frame rate during PCNL decreased radiation exposure four-fold without affecting SFS or complication rates.

Can Urol Assoc J. 2022 Oct;16(10 Suppl 2):S171–S172.

Poster #92. The impact of bilateral stone disease on patients’ disease progression and quality of life

Brendan Raizenne 1,, Claudia Deyirmendjian 2, Maimouna Balde 3, Seth Bechis 4, Roger Sur 4, Stephen Nakada 5, Jodi Antonelli 6, Necole Streeper 7, Sri Sivalingam 8, Davis Viprakasit 9, Timothy Averch 10, Jaime Landman 11, Thomas Chi 12, Vernon Pais Jr 13, Ben Chew 14, Vincent Bird 15, Sero Andonian 16, Noah Canvasser 17, Jonathan Harper 18, Kristina Penniston 19, Naeem Bhojani 1

Introduction

Kidney stone disease is associated with significant morbidity and functional impairment. Few studies have examined the impact of bilateral kidney stones on disease progression. We sought to determine the impact of bilateral stone disease on age of onset, number of stone events, and individual patient health-related quality of life (HRQOL) by querying the validated and prospectively collected Wisconsin Stone Quality of Life (WISQOL) database.

Methods

Cross-sectional data was obtained from 2906 kidney stone formers from 14 institutions in North America who completed the WISQOL questionnaire from 2014–2019. The 28-question survey has a 1–5-point scale for each item (total score range 0–140). Kidney stone formers were further stratified according to presence of bilateral or unilateral kidney stones. Categorical variables were reported and compared using a Chi-squared test. A multivariable linear regression model assessed the impact of bilateral kidney stone disease on HRQOL.

Results

Of 2906 kidney stone formers, 1340 had unilateral kidney stones and 1566 had bilateral kidney stones. Bilateral kidney stone formers had a younger mean (SD) age of kidney stone onset (37.2±15.8 vs. 46.4±15.9 years of age, p<0.001). Bilateral kidney stone formers had a higher number of stone events than unilateral kidney stone formers (p<0.001). Bilateral kidney stone formers had a higher mean (SD) number of comorbidities (2.02±1.82 vs. 1.87±1.77, p<0.05). Among those comorbidities, bilateral kidney stone disease was associated with an increased number of depression/anxiety symptoms (350 [22.4%] vs. 247 [18.4%], p<0.05). Bilateral and unilateral kidney stone formers did not differ for calcium oxalate, calcium phosphate, uric acid, and mixed stone composition (p>0.05) (Table 1). On multivariable analysis, bilateral kidney stone disease was an independent predictor of worse HRQOL (β=−11.2, CI −19.5 to −3.0) points, p<0.05).

Poster #92. Table 1.

Baseline demographics and clinical variables of bilateral and unilateral kidney stone formers from the Wisconsin Stone Quality of Life database from 2014–2019

Bilateral (n=1566) Unilateral (n=1340) p
Age (yr), median 55.4 56.9 >0.05
Ethnicity, n (%)
 Caucasian 1316 (85.4) 1054 (79.8) <0.05
 Non-caucasian 225 (14.4) 266 (19.9)
Age of onset (yr), median (SD) 37.2 (15.8) 47 (15.9) <0.05
WISQOL score (points), median (SD) 103.9 (29.9) 106.7 (30.2) <0.05
BMI, mean (%) 30.3 29.8 >0.05
Number of events, n (%) <0.05
 Single (0–1) 121 583
 Recurrent (2–5) 679 490
 Severe recurrent (≥6) 581 121
Number of medications, mean, SD 1.86 (±1.76) 1.56 (±1.63) <0.001
Number of comorbidities <0.05
 0 339 339
 1–2 720 592
 3–4 355 296
 ≥5 152 113
Stone composition >0.05
 Calcium oxalate 335 262
 Calcium phosphate 81 61
 Uric acid 43 43
 Mixed 80 58
*

Non-standardized WISQOL score was used (min–max is 28–140).

Conclusions

Bilateral kidney stone formers had a younger age of kidney stone onset and a higher number of stone events than unilateral kidney stone formers. Presence of bilateral kidney stones negatively impacted HRQOL. Therefore, clinicians should pay closer attention to bilateral kidney stone patients on clinical presentation and their risk for disease progression.

Can Urol Assoc J. 2022 Oct;16(10 Suppl 2):S172.

Poster #93. Adult acquired buried penis: Management delays associated with malignant and premalignant disease

Robin Vasan 1, Brian Chun 1, Shyam Patnaik 1,, John Myrga 1, Christian Morrill 2, Emily Hacker 2, Paul Rusilko 1

Introduction

Adult acquired buried penis (AABP) is a morbid condition that is associated with poor quality of life and a high prevalence of urethral stricture disease, premalignant lesions, and penile cancer. Treatment delays are frequent, however, and multiple barriers to care often exist before definitive buried penis repair surgery can be performed. This study aimed to investigate the number of prior surgical procedures and other consults performed in patients with AABP prior to referral to a reconstructive urologist, along with the time delays between symptom onset, evaluation and treatment.

Methods

A single-center, retrospective review was performed for patients diagnosed with AABP from 2008–2021. Outcomes of interest included number of procedures and surgical consults performed prior to urology evaluation, delays between evaluation and treatment, and rates of premalignant and malignant disease.

Results

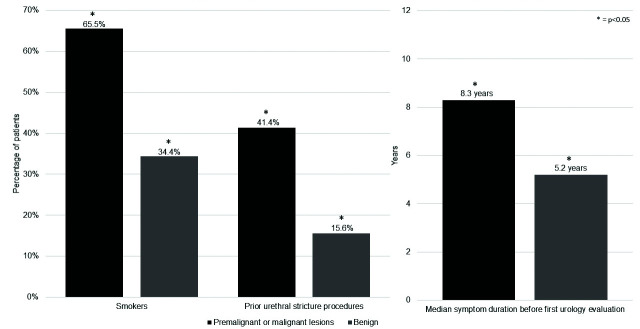
A total of 153 patients were diagnosed with AABP from 2008–2021. Most (94.5%) had seen at least one other surgical specialist prior to reconstructive urology evaluation and 29.7% had seen greater than two; 32.8% underwent other penile surgeries before AABP repair and 12.5% had undergone prior bariatric surgery. Median symptom duration and time from initial diagnosis to first urology evaluation were 6.38 and 2.30 years, respectively. A median duration of 8.0 months elapsed between first urology evaluation and AABP repair. Seven percent of patients were diagnosed with penile cancer and 35% with premalignant lesions. Smoking rates were higher among patients with premalignant and malignant lesions compared to those without (65.5% vs. 34.4%, p<0.05), as were rates of prior urethral stricture procedures (41.4% vs. 15.6%, p<0.05) and median symptom duration before first urology evaluation (8.3 vs. 5.2 years, p<0.05) (Figure 1). Demographic and socioeconomic parameters, including home area deprivation index and distance to nearest reconstructive urologist, were similar between those who underwent surgery and those who did not, as well as between those with premalignant and malignant lesions and those without. Median distance for patients to travel to their nearest reconstructive urologist was 49.5 miles.

Poster #93. Figure 1.

Poster #93. Figure 1

Smoking rates, prior urethral stricture procedure rates and symptom duration prior to urology evaluation are higher in patients with buried penis found to have premalignant or malignant disease.

Conclusions

Early surgical repair is imperative in the setting of AABP given the high prevalence of premalignant lesions and penile cancer. Inefficient referral practices and management delays may prolong the duration of morbidity and hinder the diagnosis of occult neoplastic disease.

Can Urol Assoc J. 2022 Oct;16(10 Suppl 2):S173.

Poster #94. Hypertension dampens early diuresis pattern of nocturnal polyuria syndrome

Connelly Miller 1,, Alexander Fang 1, Lakshay Khosla 1, Thomas Monaghan 1, Claire Choi 1, Dennis Robins 1, Jason Lazar 2, Jeffrey Weiss 1

Introduction

Nocturnal polyuria syndrome has been associated with a high rate of early nocturnal diuresis, hypothesized to be due to a blunting of the natural surge of antidiuretic hormone in early sleep. Conversely, hypertension is thought to cause nocturia via a rise in nocturnal natriuresis rather than free-water clearance. The effect of hypertension on the early nocturnal diuresis pattern of the nocturnal polyuria syndrome has not been studied.

Methods

We performed a retrospective analysis of voiding diaries collected from adult male patients treated for lower urinary tract symptoms at a Veterans Affairs urology clinic. We included the first diary entry with ≥2 nocturnal voids recorded for patients with a contemporaneous blood pressure reading within 30 days of the date of the diary. We then compared the volume of the first nocturnal void to the average volume of remaining nocturnal voids, the late nocturnal average voided volume. A subgroup analysis of patients without obstructive sleep apnea, congestive heart failure, chronic kidney disease, diabetes insipidus, edema, and not on diuretics, and who met two different definitions for nocturnal polyuria, nocturnal urine production ≥90 ml/hour and nocturnal polyuria index ≥0.33, was also performed.

Results

A total of 241 diaries were included from 82 patients with non-hypertensive blood pressure readings and 159 patients with hypertensive blood pressure readings. The first nocturnal voided volume differed significantly from the late nocturnal average voided volume for the overall sample (200 mL [120–300] vs. 183 mL [130–250], p=0.003) and for non-hypertensive patients (200 mL [148–300] vs. 182 mL [130–250], p<0.001), but not for hypertensive patients (180 mL [100–300] vs. 188 mL [128–258], p=0.430). In the subgroup of patients with nocturnal polyuria syndrome, non-hypertensive patients exhibited the characteristic pattern of early diuresis (Table 1), but hypertensive patients did not record a difference between the first nocturnal voided volume and the late nocturnal average voided volume.

Poster #94. Table 1.

Subgroup of patients with nocturnal polyuria syndrome

NPS by NUP≥90 ml/h NPS by NPi≥0.33
Hypertensive
 n 47 64
 FNVV in ml, median (IQR) 250 (150–350) 183 (120–298)
 LNAVV in ml, median (IQR) 240 (167–313) 170 (129–251)
 p 0.184 0.319
Non-Hypertensive
 n 23 25
 FNVV in ml, median (IQR) 275 (150–400) 200 (150–360)
 LNAVV in ml, median (IQR) 204 (175–250) 180 (136–210)
 p 0.009 0.002

NPS is nocturnal polyuria syndrome. NUP is nocturnal urine production in milliliters/hour. NPi is Nocturnal Polyuria index. FNAVV is first nocturnal voided volume in milliliters. LNAVV is late nocturnal average voided volume in milliliters. IQR is interquartile range.

Conclusions

Hypertension appears to dampen the early diuresis rate pattern found in patients with nocturnal polyuria syndrome. This has broad potential implications for understanding how to manage nocturnal polyuria, as this suggests that a complex interplay exists between distinct pathophysiological processes that may each contribute to the etiology of nocturia.

Can Urol Assoc J. 2022 Oct;16(10 Suppl 2):S173.

Poster #95. Increased levels of urine metabolites found in a female aging population with overactive bladder syndrome

Claudia Covarrubias 1, Philippe Cammisotto 1, Samer Shamout 1, Lysanne Campeau 1,2,

Introduction

Urine storage and voiding by the bladder are controlled by the peripheral and central nervous systems. Neurotrophins are essential for the maintenance and activity of nerve endings. Among them, brain-derived neurotrophic factor (BDNF) controls neuroregeneration, while its precursor BDNF triggers inflammation and apoptosis. A dysregulation in the ratio of BDNF and proBDNF could contribute to pathologies of the urinary tract and have been proposed to be markers for overactive bladder syndrome (OAB). Herein, we examined the levels of proBDNF, BDNF, and associated proteins and microRNAs in the urine of a female aging population.

Methods

Urine and blood samples from 20 controls and 20 OAB female patients between the ages of 50–80 years were obtained with validated questionnaires. ProBDNF and BDNF were measured using specific ELISA kits (Biosensis). MicroRNAs involved in the control of proBDNF synthesis were measured by RT-qPCR after polyadenylation. Activity of matrix metallopeptidase-9 (MMP-9) was measured using an enzymatic kit. Sortilin and cortisol were also measured using specific ELISA kits. Results were adjusted with creatinine levels, age, renal function, and insulin resistance.

Results

BDNF/creatinine levels were not different in the urine of controls vs. OAB patients. ProBDNF/creatinine measures were lower in the OAB population. The ratio BDNF/proBDNF was therefore higher (0.051±0.0078 vs. 0.135±0.027) in the OAB population (p<0.005). MicroRNAs known to control the translation of proBDNF mRNA by binding its 3’UTR sequence, namely MiR-26b-5p, Mir-26-1a-5p, MiR-10a-5p and MiR-103a-3p, were not expressed differently between control and OAB patients. Other miRNAs, MiR-15b-5p, MiR-142-3p and MiR-103a-3p, that control proBDNF expression through downstream or upstream pathways were not affected either. On the other hand, enzymatic activity of MMP-9, one of the main enzymes converting proBDNF to BDNF, was higher in the OAB group. The microRNA MiR-491-5p, which negatively controls MMP-9 expression, was in accordance, potently decreased in the OAB group. There was no statistical significance between the levels of sortilin or cortisol measurements found in the urine of controls when compared to OAB patients (p>0.005).

Conclusions

These results suggest that the ratio BDNF/proBDNF might be a better indicator, or potential biomarker, of OAB than BDNF alone. The decrease in proNGF levels could be the result of the enhanced activity of MMP-9 rather than transcription or translation control, highlighting the role or proteases in a bladder pathology such as OAB.

Can Urol Assoc J. 2022 Oct;16(10 Suppl 2):S173–S174.

Poster #96. Investigation of intradetrusor onabotulinum toxin A injection efficacy and safety in older adults with urge urinary incontinence

Michael Basin 1,, Anastasija Useva 1, Alexandr Pinkhasov 1, Natasha Ginzburg 1, Elizabeth Ferry 1

Introduction

Overactive bladder (OAB) complicated by urge urinary incontinence (UUI) is a common condition affecting older adults and poses a significant threat to comfort and independence. Although many treatment options for OAB exist, concerns about frailty and increased risk of side effects in the elderly makes management difficult. We investigated the safety and efficacy of intradetrusor onabotulinum toxin A (BT) in the treatment of OAB/UUI in the elderly.

Methods

A retrospective review was performed of patients >70 years of age with a diagnosis of OAB with predominant UUI who underwent intradetrusor BT injection from 2017–2021. Demographic, pre- and post-treatment clinical data were collected. Post-injection postvoid residual (PVR) was obtained within 3 weeks. Post-injection urinary retention was defined as inability to void requiring Foley catheter or clean intermittent catheterization. Urinary tract infections (UTIs) were recorded if patient was symptomatic with a positive urine culture within 3 weeks of injection.

Results

Twenty-nine patients were identified (Table 1). Median age was 77 (71–92) and all patients were female. The average number of oral medications trialed prior to BT injection was 2.6 (SD 0.9). Eight (27.6%) patients had previous percutaneous tibial nerve stimulation and none had prior sacral nerve stimulation. Pre-injection, average daily pad usage was 4.4 (1–11) and PVR was 12.2 (SD 16.9). The median BT dose was 100 (70–200). Following the first intradetrusor BT injection, the mean PVR was 41.0 (SD 74.4) and 2 (6.9%) patients developed urinary retention. Twenty-one (72.4%) patients underwent repeat injections, with urinary retention rates of 2.2% (n=1) on 46 subsequent injections. The average time between injections was 6.75 months (SD 4.8 months). Overall, the UTI rate was 13.3% (n=10). Subjectively, 93.3% noted improvement of symptoms, 5.3% had no change in symptoms, and 1.3% developed worsening symptoms.

Poster #96. Table 1.

Demographics and clinical data

Demographics
 Age 77 (71–92)
  Body mass index (BMI) 34.5 (SD 7.2)
  Parity 2 (0–7)
 Prior therapies
  # of oral medication 2.6 (SD 0.9)
  Percutaneous tibial nerve stimulation, n (%) 8 (27.6)
  Sacral nerve stimulation, n (%) 0 (0)
 Pre-treatment characteristics
  Pre-botulinum toxin A PVR (cc) 12.2 (SD 16.9)
  Pre-botulinum toxin A pad usage (pads) 4.4 (1–11)
 Outcomes
  Post-botulinum toxin A PVR (cc) 41 (SD 74.4)
  Episodes of urinary retention after 1st treatment, n (%) 2 (6.9)
  Episodes of urinary retention with subsequent treatments, n (%) 1 (2.2)
  Time between treatments (months) 6.75 (SD 4.8)
  % of UTIs within 2 weeks of treatment, n (%) 10 (13.3)
  Patients with improvement of symptoms, n (%) 70 (93.3)
  Patients with no change in symptoms, n (%) 4 (5.3)
  Patients with worsening symptoms, n (%) 1 (1.3)

Conclusions

At a time when antimuscarinics are facing new scrutiny for potential associations with cognitive decline in the elderly and the significant financial toxicity of beta-agonists, this presents a “real-world” clinical experience that demonstrates the safety and efficacy of intradetrusor onabotulinum toxin A in elderly females.

Can Urol Assoc J. 2022 Oct;16(10 Suppl 2):S174.

Poster #98. Decreasing traumatic urethral catheterization: Implementation of a standardized process of coude catheter insertion

David Miller 1,, Daniel Pelzman 1, Sarah Erpenbeck 1, Oluwaseun Orikogbo 1, Jennifer Bonfili 1, Roberta Jones 1, Kelly Pekala 1, Avinash Maganty 1, Stephen Jackman 1, Paul Rusilko 1

Introduction

Traumatic Foley catheterization leads to patient morbidity and increased healthcare costs. To address this issue, we sought to develop and implement a coude catheter education program for operating room nurses, as well as standardize the usage of a coude catheter for male patients.

Methods

A retrospective review was conducted to identify all traumatic catherizations over a 6-month period for the following surgical services: neurosurgery, trauma, and surgical oncology at our institution. At the initiation of the trial, a nursing education program was implemented that included basic urological anatomy, coude urethral catheter insertion techniques, and catheter safety. In addition, a complete coude catheter kit was sourced with the same cost of the standard straight tip catheter kit. We conducted our trial over a period of 2 months, with all catheterizations tracked. Following the trial, the process and outcomes were reviewed and then implemented for all male patients >18 years old requiring indwelling catheter placement in the operating room.

Results

On retrospective review there were 18 traumatic Foley catheterizations of patients on the three surgical services. The total cost of these traumatic catherizations was $41 353 when accounting for additional procedures, supplies, and additional OR time required for each traumatic catheterization. The average cost per patient was $2297. The implementation of the training program was seamless, with only one incorrect insertion observed during the trial and no traumatic catheterizations for 100 patients that were included in the trial. After full implementation of the process across all operating room services in June 2021 there have been 1201 catheterizations performed using a coude catheter kit, with 1 traumatic Foley placement through January 2022.

Conclusions

Implementation of the nursing education program and use of the coude catheter for all male catheterizations reduces costs, decreases iatrogenic urethral injury, and improves patient safety. Use of a coude catheter minimizes the risk of traumatic male urethral catheterization. The next steps include implementing this process for all male inpatients >18 years of age at our institution.

Can Urol Assoc J. 2022 Oct;16(10 Suppl 2):S174–S175.

Poster #99. Characterization of genital injuries secondary to foreign bodies from 2011–2020

Meher Pandher 1, Arnold Oparanozie 1,, Amy Song 1, Jasmine Mahajan 1, Courtney Berg 1, Gabriel Fernandez 1, Chrystal Chang 1, Amjad Alwaal 1, Robert Weiss 1

Introduction

Genital injuries secondary to foreign body use are uncommon but can result in significant trauma and urethral damage; however, few studies characterize the etiology of such injuries. This study aimed to identify demographic, temporal, and disposition trends of all foreign object genital injuries from 2011–2020.

Methods

The National Electronic Injury Surveillance System (NEISS) database reports consumer product-related injuries in the U.S. and provides national estimates of product-related injuries resulting in emergency department visits. The database was queried to identify 934 cases of genital injuries from 2011–2020. Data on age, sex, race, disposition, anatomy, and object involved was reported and analyzed using linear regression.

Results

Based on 934 cases, an estimated 32 810 (95% CI 26 948–38 671) patients in the U.S. suffered genital injuries due to a foreign body between 2011 and 2020. Most (65.9%) of all foreign body-related genital injuries involved the penis, 30.7% involved the urethra, and 3.5% involved the scrotum; 82.3% of patients were treated and released from the ED and 11.8% required admission after treatment, of which urethral injuries were the most common location of injury (44%). Most of these patients were aged 19–64 years (65.9%) and consumer products most implicated in genital injuries in this group included rings (51%), zippers (17%), and pens and pencils (11.3%). Consumer products most responsible for foreign body genital injury in children aged 0–18 included swimming apparel (43.4%), zippers (22.6%), kitchen gadgets (11.3%), and pens and pencils (10.2%). In patients over 65, consumer products implicated most often in genital injuries included rings (47.1%) and kitchen gadgets (17.6%). Among all the consumer products implicated in genital injuries, swimming apparel was the most benign, as all related injuries were treated and released from the ED. Pens, pencils, and massage devices were items that routinely resulted in urethral injuries, and items that most often required hospitalization. Linear regression indicated that the number of genital injuries related to foreign objects significantly increased from 2011–2020 (p<0.001).

Conclusions

When there is suspicion for urethral injuries, particularly those secondary to pens or pencils, it is imperative that urgent consults are placed to urologists, due to the rates at which these injuries require hospitalizations. Because of the damage caused to genitalia by intentional exposure to foreign bodies, educating individuals on this topic in sexual education classes is necessary to prevent future injuries.

Can Urol Assoc J. 2022 Oct;16(10 Suppl 2):S175.

Poster #100. Bathroom-related genital injuries in adults over 65 from 2011–2020

Meher Pandher 1, Arnold Oparanozie 1,, Amy Song 1, Jasmine Mahajan 1, Courtney Berg 1, Gabriel Fernandez 1, Chrystal Chang 1, Amjad Alwaal 1, Robert Weiss 1

Introduction

Genital trauma in the elderly population is responsible for significant morbidity. The etiology of genital injury in this population over the decade has been poorly characterized. Our project aimed to describe the epidemiology of bathroom-related genital injuries in patients above age 65 presenting to U.S. emergency departments (ED).

Methods

The National Electronic Injury Surveillance System (NEISS) is a stratified probability sample that provides national estimates of patients who present to the ED with consumer product-related injuries. The database was queried to find patients over 65 with bathroom product-related injuries of the pubic region and 99 cases were analyzed to derive national estimates. The variables reviewed included age, race, gender, injury type, injury location, consumer product used, and disposition.

Results

Based on 99 actual cases, an estimated 4788 adults over 65 (95% CI 3304–6272) sustained genital injuries from bathroom-related products during this 10-year study period. Of these injuries, 75.8% occurred in men. Almost half (49.5%) occurred in white patients and 9.1% occurred in black/African American patients. Most of the injuries took place among patients between the ages of 65–70 (28.2%). The vast majority (88.9%) were treated and released from the ED, while 8.1% were admitted. Consumer products most responsible for genital injuries for both genders included bathtubs (61.6%) and toilets (29.3%), and these products were also responsible for all the hospitalizations (50% and 50%, respectively). The most common injuries were to the scrotum (53.5%), vagina or vulva (20.2%), and penis (15.2%). Very few urethral injuries occurred (2.0%). Injuries were predominantly attributed to patients falling in the bathroom, shower, or off the toilet, or patients noticing a previous laceration, abrasion, or source of bleeding while bathing. Up to 8.1% of patients experienced genital injury due to malfunctions of their Foleys, and 2.0% were due to malfunctioning of their suprapubic catheters. All Foley-related injuries occurred in men in bathtubs or showers.

Conclusions

Most genital injuries occurring in bathrooms in patients over 65 are secondary to toilets and bathtubs, and few involve the urethra. These findings indicate a need to include additional bathroom safety measures in showers and next to toilets to reduce morbidity and mortality of fall-related injuries.

Can Urol Assoc J. 2022 Oct;16(10 Suppl 2):S175.

Poster #101. Insight to urology patients’ preferences regarding telemedicine

Elizabeth Ellis 1,, Lauren Gochenaur 2, Helena Temkin-Greener 3, Jean Joseph 1, Divya Ajay 1

Introduction

Due to COVID-19, telemedicine has become a common method of healthcare delivery. Our goal was to evaluate urology patients’ satisfaction with telemedicine, to examine patient preferences, and to identify opportunities for improvement in telemedicine readiness, access, and quality of care.

Methods

A total of 285 adult urology patients who completed at least one telemedicine visit from September to December 2020 were eligible to participate. A paper survey was disseminated by postal mail, but with an option to complete electronically. Those who returned completed surveys received a $15 gift card.

Results

Seventy-six patients completed the survey (response rate of 27%). The most common age bracket of the respondents was 70–79 years (37%). Most respondents were white (95%) and male (73%). A quarter of respondents (24%) lived more than 40 minutes away from the office. All respondents had healthcare insurance: 57% Medicare, 39% private insurance, and 3% Medicaid. Readiness: To prepare for the visit, many patients (49%) read the provided instructions and 11% downloaded platform software. Most (91%) patients thought they were adequately prepared. A majority (82%) were either satisfied or very satisfied with the ease of telemedicine setup. Access: Types of visits included established patients (71%), new patient visits (17%), and postoperative visits (9%). Most respondents (84%) did not have difficulty accessing the visit. Those who reported a difficulty attributed it to the clinician having difficulties and lack of familiarity with the technology. Quality of care: Wait times were short: 46% waited 0–5 minutes. All respondents were satisfied or very satisfied with the length of visit, and 90% were satisfied or very satisfied with the overall experience. Patient preferences: Compared to office visits, most patients found telemedicine equal or superior in several areas. Despite the positive experience, 35% preferred to see a clinician in person. This preference was dependent on the nature of the complaint, length of the drive, and the patient’s schedule. Patients’ preference for in-person visits was driven by the perception that they would receive higher quality of care and would be able to be examined.

Conclusions

Patients reported high levels of satisfaction and a willingness to engage with telemedicine visits. To minimize future technical disruptions, it might be prudent to offer the option of a mock telehealth visit before their scheduled appointment. We implemented a workflow in which the nurse sets up the telemedicine visit in an exam room.


Articles from Canadian Urological Association Journal are provided here courtesy of Canadian Urological Association

RESOURCES