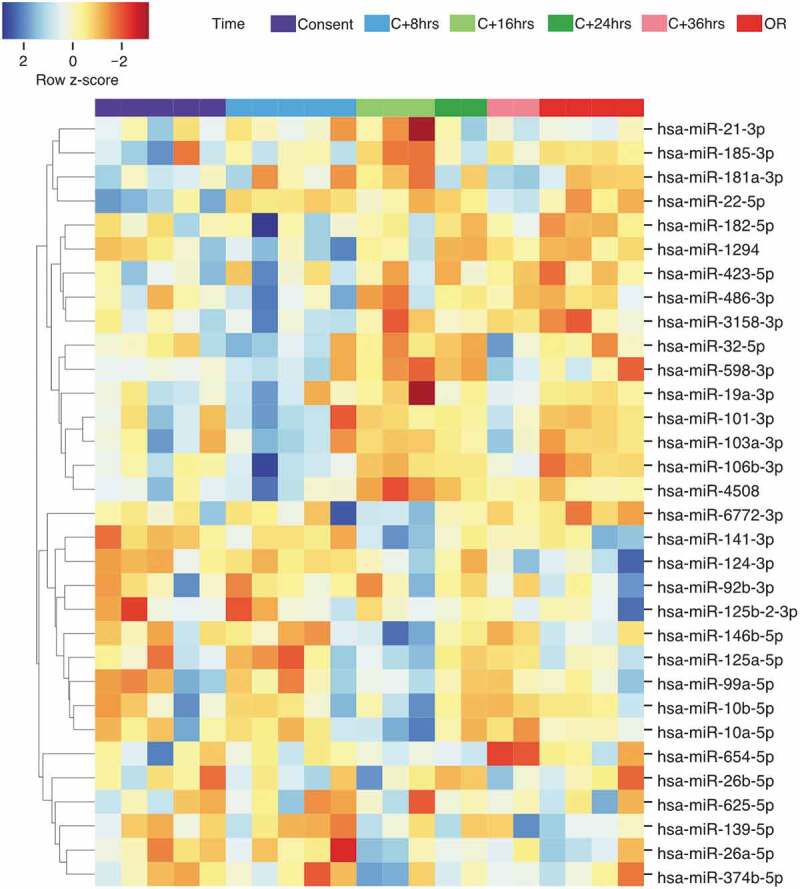
Figure 3.

Heatmap and hierarchical clustering analysis of the 32 differentially abundant miRNAs identified in the time-course analysis. The relative abundance was obtained using z-score scaling of the rlog transformed counts. A negative z-score (in red) showed miRNA abundance that are lower than the mean. A positive z-score (in blue) showed miRNA abundance that are higher than the mean). OR: organ recovery.
