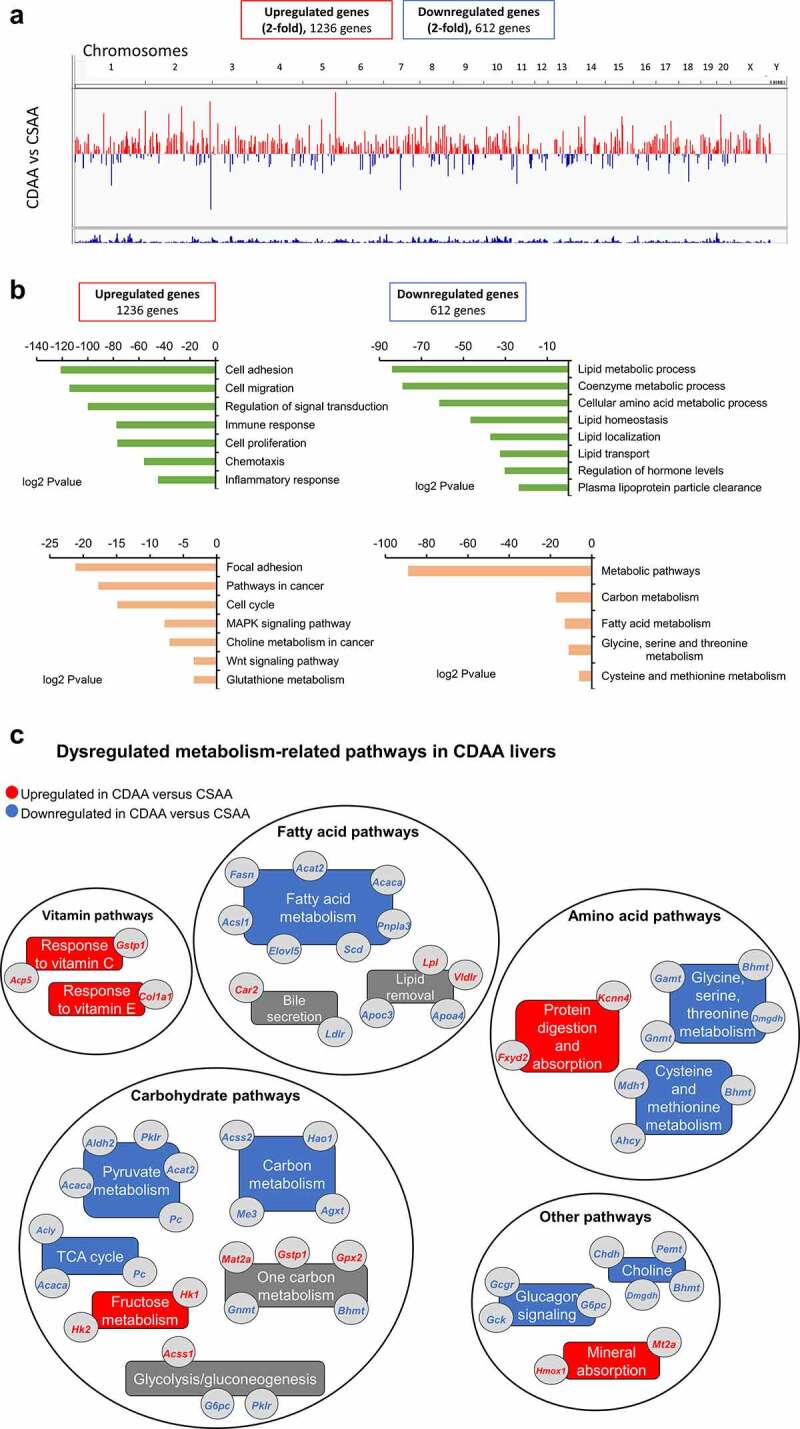
Figure 2.

The landscape of genes differentially expressed in livers of healthy rats and HCC rats, as measured by RNA sequencing. (a) A chromosomal map of differentially expressed genes in livers of rats exposed to a choline-deficient diet (CDAA) as compared to healthy rats on a choline-sufficient diet (CSAA). (b) Functional analysis of genes differentially expressed in livers of CDAA vs. CSAA rats, using Gene ontology (in green) and KEGG pathway (in Orange) analyses. (c) Detailed analysis of metabolism-related pathways and corresponding genes that are downregulated (blue) or upregulated (red) within a given pathway in CDAA rats vs. CSAA rats based on RNA-seq. Categories with downregulated or upregulated genes are marked in blue and red, respectively. Grey boxes indicate categories with genes both upregulated and downregulated.
