Abstract
The proliferative response is most frequently determined by estimating the amount of [3H]thymidine incorporated into newly synthesized DNA. The [3H]thymidine procedure requires the use of radioisotopes as well as lengthy periods of incubation (>72 h). An alternative method of assessing T-lymphocyte activation in whole-blood cultures involves the measurement of the nucleotide ATP instead of [3H]thymidine incorporation. In addition, the Luminetics assay of T-cell activation measures specific T-lymphocyte subset responses through the use of paramagnetic particles coated with monoclonal antibodies against CD antigens. This assay permits rapid (24 h) analysis of lymphocyte subset activation responses to mitogens and recall antigens in small amounts of blood.
Cell proliferation assays have been shown to be useful for monitoring T-cell immune status. Similarly, T-cell activation, as measured by determining the increase in intracellular ATP, has been correlated with proliferation. After an initial period of consumption (10), ATP levels increase, and a linear relationship between cell concentration and ATP level which is proportional to light intensity develops. This measured luminescence has been favorably correlated with cell number (1, 5, 6, 9) and the degree of activation of peripheral blood mononuclear cells (3, 4) in cell proliferation studies.
Traditionally, researchers have purified peripheral blood mononuclear cells prior to stimulation, a method requiring careful handling and multiple centrifugation steps (2). More recently, whole blood has been successfully used for these types of studies (7, 8). Whole blood is particularly useful when a large number of blood samples must be processed on a given day, when blood volume is limited, or when facilities and expertise are limited.
Proliferation testing is not widely used in clinical settings because of the relatively long period of time needed to achieve results (3 to 10 days), the lack of assay standardization, and the requirement for the use of isotopes. This paper describes an ATP assay for measuring T-cell activation which can utilize whole blood, achieve results in 24 h, does not involve the use of isotopes, and has the additional advantage of identifying the specific T-cell subset involved. The Luminetics assay of T-cell activation, supplied in a kit format which includes diluents, wash buffers, monoclonal-antibody-coated beads, standards, and controls, is suitable for use in a clinical laboratory.
To compare the ATP assay of cell activation with the cell proliferation assay ([3H]thymidine incorporation), T-lymphocyte responses to mitogens and antigens in microcultures of whole blood from healthy adult humans, obtained before and after booster vaccination with tetanus toxoid (TT) and diphtheria toxoid, were measured.
Ten healthy adults were bled two times at a 6-week interval. Immediately after the first blood collection (P1), six individuals were given a booster vaccination of TT and diphtheria toxoid. Four subjects were not administered the booster vaccine. Six weeks after the first blood collection, all subjects were bled a second time (P2). Both test methodologies were initiated within 4 h after blood collection. Whole blood was collected in Vacutainer tubes containing 45 USP units of sodium heparin (Becton-Dickinson, Rutherford, N.J.) and held at room temperature until processed, approximately 2 to 3 h. The blood was diluted 1:4 with RPMI 1640 medium (Gibco BRL). Phytohemagglutinin L (PHA-L; Sigma Chemical Co.), concanavalin A (ConA; Sigma Chemical Co.), and purified TT (Connaught Laboratories, Swiftwater, Pa.) were diluted in RPMI 1640 and used in both test systems.
In the ATP assay method, 100 μl of 1:4-diluted blood was added to 25 μl of a solution of each stimulant in triplicate round-bottomed microtiter wells. Cultures were incubated overnight in a humidified 37°C incubator with 5% CO2. Approximately 18 to 24 h later, 100 μl of a suspension of washed paramagnetic beads (107 total; Perseptive Biosystems) coated with monoclonal antibody (anti-CD4) was added to each culture. After the cultures were mixed and then incubated at 4°C for 30 min, the CD4+ cells were collected at the side of the culture well by using a strong magnet held in position for 5 min. Cells unattached to the magnetic particles were removed, and attached cells were washed three times with a solution of phosphate-buffered saline. After the final wash, lysis buffer (200 μl) was added to each well to release intracellular ATP. From each well, 100 μl was removed, and the ATP in it was quantified by the use of a luciferin-luciferase enzyme system (Sigma Chemical Co.) and a Berthold luminometer (Lumat LB9501). ATP results, reported in nanograms of ATP per milliliter, were determined by using a standard curve.
Using identical samples, proliferative responsiveness was measured by adding 50 μl of each stimulant individually to triplicate wells each containing 50 μl of 1:4-diluted blood. After the addition of 100 μl of RPMI 1640 to each well, the cultures were incubated in 5% CO2–95% humidified air at 37°C for 96 h (PHA-L and ConA) or 120 h (TT). For the final 18 h of incubation, 37 kBq (1.0 μCi) of [3H]thymidine was added to each culture. Cultures were harvested onto fiberglass filters, which were transferred to scintillation fluid, and [3H]thymidine incorporation was measured in a scintillation counter.
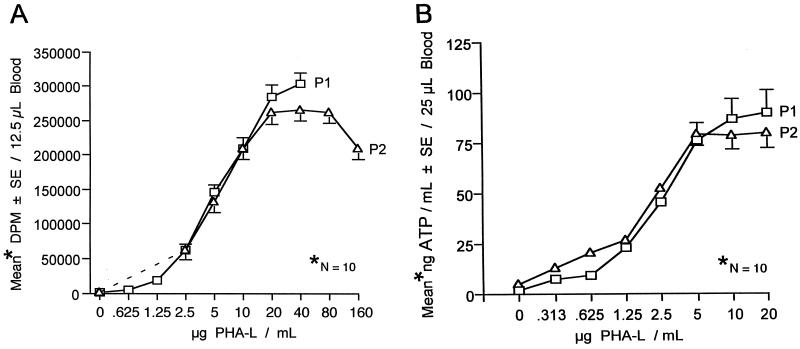
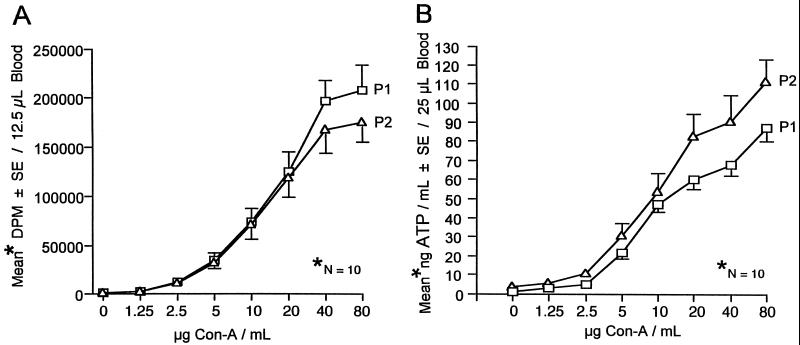
Dose responses of individuals to various concentrations of PHA-L or ConA in the ATP assay were correlated with proliferation. Responsiveness to PHA-L or ConA at P2 was not influenced by the earlier administration of a tetanus and diphtheria vaccine booster (Fig. 1 and 2).
FIG. 1.
Lymphocyte responses to PHA-L at two time periods (P1 and P2) at an interval of 6 weeks. (A) Proliferative responses of lymphocytes to PHA-L. (B) Measurement of CD4+ T-lymphocyte responses to PHA-L via determination of ATP. SE, standard error.
FIG. 2.
Lymphocyte responses to ConA at two time periods (P1 and P2) at an interval of 6 weeks. (A) Proliferative responses of lymphocytes to ConA. (B) Measurement of CD4+ T-lymphocyte responses to ConA via determination of ATP. SE, standard error.
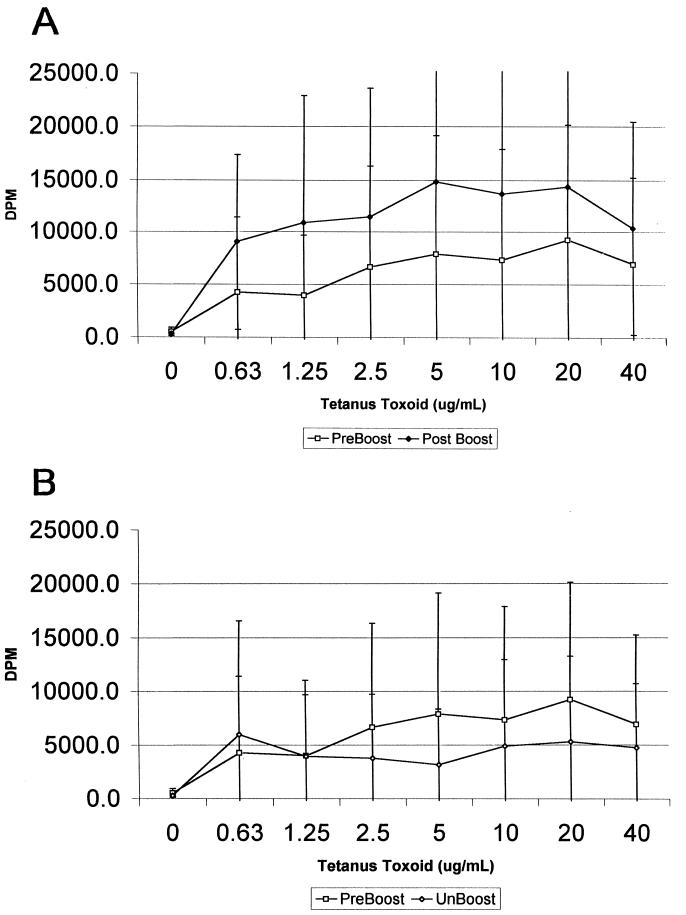
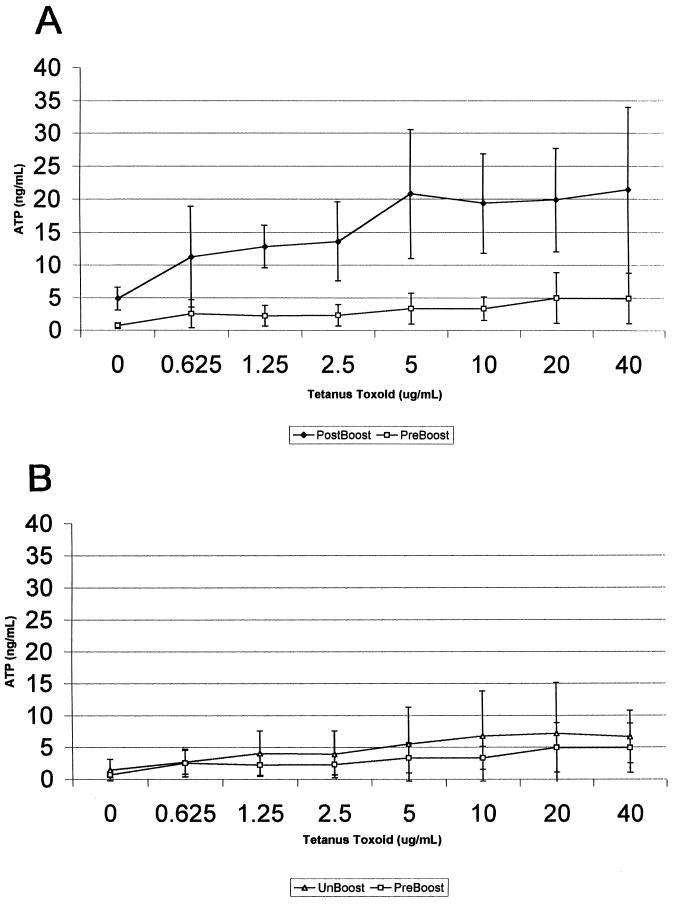
To measure the T-cell response to TT, a dilution series ranging from 0.625 to 40.0 μg of antigen/ml was used as a stimulant in both the proliferation and the ATP assays. Since lymphocyte responses to recall antigens depend on the numbers of specifically responsive cells, they tend to be weaker than the corresponding response to mitogens like PHA or pokeweed mitogen. Based on the paired-sample t test, the Luminetics assay was able to distinguish pre- and postbooster statuses with greater than 95% probability (P < 0.05) for all concentrations of stimulant used except the lowest (0.625 μg/ml; P < 0.1) (Fig. 3). The responses of unboosted individuals across the same dose-response range did not differ significantly from those of the preboosted controls (Fig. 4). The variability in the radioactive lymphoproliferation assay was such that the mean response to TT did not statistically significantly differ from that of the preboosted controls, even though responses were higher on average in the former.
FIG. 3.
(A) Proliferative responses of lymphocytes to TT before and after vaccine boost, compared by paired-sample t test. (B) Proliferative response of lymphocytes from preboosted and unboosted controls to TT antigen.
FIG. 4.
(A) Measurement of CD4+ T-lymphocyte responses to TT before and after vaccine boost (6-week interval) via determination of ATP (comparisons by paired-sample t test). (B) Measurement of CD4+ T-lymphocyte responses of preboosted and unboosted controls to TT antigen via determination of ATP.
The results indicate that whole-blood microcultures can be used to evaluate T-lymphocyte responses via assessment of increases in the levels of either ATP or DNA synthesis compared to those of unstimulated controls. A variety of mitogens and antigens can be used at relatively low concentrations. In contrast to the measurement of [3H]thymidine incorporation, which takes 96 to 120 h, ATP results can be obtained in 24 h. In addition, because no radioactive materials are employed, handling and waste disposal are simplified. While the CD4 subset of T cells was exclusively measured in this study, other subsets could be as easily selected for measurement, simultaneously, by setting up appropriate replicate samples.
Lymphocytes stimulated by mitogens or antigens divide in response to a series of activation events. These include clustering of cell surface receptors, increased uptake of metabolites and ions, increased turnover of phospholipids, synthesis of cytokines, and changes in intracellular ATP levels. Therefore, activation events will correlate with proliferation but are also expected to be earlier indicators of the response to immune stimuli.
As immune reconstitution becomes more important in the assessment of disease management and as cytokine therapies become available, there will be an increasing need to measure cellular immune function more rapidly. The ATP assay system provides a faster, easier-to-use method of measuring T-cell activation in response to a variety of stimuli. It has clear applications in monitoring of infectious diseases, vaccine efficacy, transplant acceptance, and response to cancer therapy. In the future, it may prove useful in determining responses to nutritional supplements and in evaluating the effects of aging.
Acknowledgments
We acknowledge the support of Larry Uhteg and Jessie Chithams in the statistical analysis of the data.
REFERENCES
- 1.Andreotti P E, Linder D, Hartmann D M, Johnson L J, Harel G A, Thaker P H. ATP lymphocyte activation assay application for lymphokines and cytokines. In: Szalay A A, Stanley P E, Kircka L J, editors. Bioluminescence and chemiluminescence: current status. New York, N.Y: John Wiley & Sons; 1993. pp. 257–261. [Google Scholar]
- 2.Boyum A. Separation of lymphocytes, lymphocyte subgroups and monocytes: a review. Lymphology. 1977;10:71–76. [PubMed] [Google Scholar]
- 3.Bulanova E G, Budagyan V M, Romanova N, Brovko L, Ugarova N. Bioluminescent assay for human lymphocyte blast transformation. Immunol Lett. 1995;46:153–155. doi: 10.1016/0165-2478(95)00032-z. [DOI] [PubMed] [Google Scholar]
- 4.Campbell A K. Chemiluminescence: principles and applications in biology and medicine. Chichester, United Kingdom: Ellis Harwood; 1988. pp. 267–312. [Google Scholar]
- 5.Crouch S P M, Kozlowski R, Slater K J, Fletcher J. The use of ATP bioluminescence as a measure of cell proliferation and cytotoxicity. J Immunol Methods. 1993;160:81–88. doi: 10.1016/0022-1759(93)90011-u. [DOI] [PubMed] [Google Scholar]
- 6.Ishizaka A, Tono-oka T, Matsumoto S. Evaluation of the proliferative response of lymphocytes by measurement of intracellular ATP. J Immunol Methods. 1984;72:127–132. doi: 10.1016/0022-1759(84)90440-x. [DOI] [PubMed] [Google Scholar]
- 7.Kramer T, Moore R J, Shippee R L, Friedl K E, Martinez-Lopez L, Chan M M, Askew E W. Effects of food restriction in military training on T-lymphocyte responses. Int J Sports Med. 1977;18:S84–S90. doi: 10.1055/s-2007-972704. [DOI] [PubMed] [Google Scholar]
- 8.Kramer T R. Committee on Military Nutrition Research (ed.) 1999. Application of whole-blood cultures to field study measurements of cellular immune function in vitro; pp. 249–262. Military strategies for sustainment of nutrition and immune function in the field. National Academy Press, Washington, D.C. [Google Scholar]
- 9.Petty R D, Sutherland L, Hunter E, Cree I. Comparison of MTT and ATP-based assays for the measurement of viable cell number. J Biolumin Chemilumin. 1995;10:29–34. doi: 10.1002/bio.1170100105. [DOI] [PubMed] [Google Scholar]
- 10.White A G, Raju K T, Keddie S, Abouna G M. Lymphocyte activation: changes in intracellular adenosine triphosphate and deoxyribonucleic acid synthesis. Immunol Lett. 1989;22:47–50. doi: 10.1016/0165-2478(89)90141-7. [DOI] [PubMed] [Google Scholar]


