Abstract
Non-alcoholic fatty liver disease is the most common chronic liver disease and is associated with chronic kidney disease. The fibrosis-4 index and non-alcoholic fatty liver disease score are widely used as non-invasive diagnostic methods for non-alcoholic fatty liver disease. However, the relationship between these markers and specific renal histopathologies in chronic kidney disease remain unclear. This study included 179 patients aged between 16 and 80 years who underwent renal biopsy. We examined the association between the fibrosis-4 index or non-alcoholic fatty liver disease score and change in estimated glomerular filtration rate 12 months after kidney biopsy for each renal histopathology. Renal histopathologies were determined by renal biopsy. Our results showed that there was a significant negative correlation between the fibrosis-4 index and estimated glomerular filtration rate. In nephrosclerosis, the non-alcoholic fatty liver disease score and estimated glomerular filtration rate tended to have a negative correlation, albeit without significance. In IgA nephropathy, both the fibrosis-4 index and non-alcoholic fatty liver disease score were significantly negatively correlated with estimated glomerular filtration rate. Furthermore, the fibrosis-4 index was not associated with urinary protein-to-creatinine ratio or renal function markers such as urinary b2 microglobulin and urinary N-acetyl-d-glucosamine. Our kidney biopsy-based study showed that the liver fibrosis markers fibrosis-4 index and non-alcoholic fatty liver disease score were negatively correlated with the estimated glomerular filtration rate in nephrosclerosis and IgA nephropathy.
Subject terms: Nephrology, Kidney, Kidney diseases
Introduction
Chronic kidney disease is associated with increased risks of mortality and morbidity. Furthermore, CKD is also associated with diabetes mellitus, including diabetic kidney disease (DKD)1. Obesity and insulin resistance are the most common causes of CKD2,3. It has been reported that non-alcoholic fatty liver disease (NAFLD) is a clinicopathological condition that encompasses a variety of chronic liver diseases ranging from asymptomatic hepatic fat accumulation to progressive liver disease, with clinical symptoms resembling alcoholic liver disease despite the absence of excessive alcohol consumption4,5. A recent study revealed that the prevalence of NAFLD diagnosed by ultrasound was estimated to be about 25%6. It is estimated that either NAFLD or non-alcoholic steatohepatitis (NASH) will be the most common indication for liver transplantation by 20307. NAFLD is a multisystem disease that is associated with various diseases such as diabetes mellitus, obesity, metabolic syndrome, cardiovascular diseases, and CKD8. The fibrosis-4 (FIB-4) index and NAFLD fibrosis score (NFS) are simple and validated diagnostic markers used to stratify the degree of liver fibrosis according to risk in patients with suspected NAFLD9. Moreover, these non-invasive fibrosis markers have been shown to be associated with the prevalence of CKD in recent studies10. However, there have been no reports on the association between these fibrosis markers and decreased estimated glomerular filtration rate (eGFR) by renal histopathology classification as determined by kidney biopsy. Thus, we performed this renal pathology-based study to elucidate whether the FIB-4 index and NFS can predict eGFR decline in CKD patients.
Results
We determined the clinical characteristics of the 179 cases after excluding patients who underwent kidney biopsy. The median age of the study participants was 51 years, and 96 patients (53.6%) were female. The median body mass index was 22.7, and the median FIB-4 index was 0.96. The other median values are as follows: systolic blood pressure (SBP), 129 mmHg; diastolic blood pressure (DBP), 78 mmHg; serum creatinine (Cr), 76.02 mmol/L; blood urea nitrogen (BUN), 5 mmol/L; estimated glomerular filtration rate (eGFR), 64 mL/min/1.73 m2; urine protein-to-creatinine ratio, 0.538; N-acetyl-β-d-glucosaminidase (urinary NAG), 8.9 IU/L; and urinary β2 microglobulin (urinary β2 MG), 198 mg/L (Table 1). The underlying diseases are as follows: nephrosclerosis (10 cases, 5.6%), IgA nephropathy (74 cases, 41.3%), minimal change disease (24 cases, 13.4%), diabetic nephropathy (7 cases, 3.9%), lupus nephritis (12 cases, 6.7%), membranous nephropathy (18 cases, 10.1%), ANCA-associated glomerulonephritis (9 cases, 5.0%), interstitial nephritis (9 cases, 5.0%), and others (16 cases, 8.9%) (Table 2).
Table 1.
Patient characteristics.
| Variables | All patients (n = 179) |
|---|---|
| Age (years) | 51 (16–80) |
| Female gender | 96 (53.6%) |
| Body mass index | 22.7 (14.3–45.7) |
| SBP (mmHg) | 129 (90–236) |
| DBP (mmHg) | 78 (40–142) |
| BUN (mmol/L) | 5 (2.5–35.7) |
| Serum creatinine (µmol/L) | 76.02 (26.69–38.13) |
| eGFR (mL/min/1.73m2) | 64 (9–140) |
| Urinary β2 MG (mg/L) | 198 (47–73,162) |
| Urinary NAG (IU/L) | 8.9 (1.0–221.1) |
| Urine protein/creatine ratio | 0.538 (0.04–28.86) |
| FIB-4 index | 0.96 (0.19–6.58) |
| NFS | − 1.78 (− 4.88 to − 2.74) |
SBP systolic blood pressure, DBP diastolic blood pressure, BUN blood urea nitrogen, eGFR estimated glomerular filtration rate, urinary β2 MG urinary β2 microglobulin, urinary NAG urinary N-acetyl-β-d-glucosaminidase, FIB-4 index fibrosis-4 index, NFS non-alcoholic fatty liver disease score.
Table 2.
Underlying diseases in study.
| Underlying disease | Number (%) |
|---|---|
| Nephrosclerosis | 10 (5.6) |
| IgA nephropathy | 74 (41.3) |
| Minimal change disease | 24 (13.4) |
| Diabetic nephropathy | 7 (3.9) |
| Lupus nephritis | 12 (6.7) |
| Membranous nephropathy | 18 (10.1) |
| ANCA-associated glomerulonephritis | 9 (5.0) |
| Interstitial nephritis | 9 (5.0) |
| Others | 16 (8.9) |
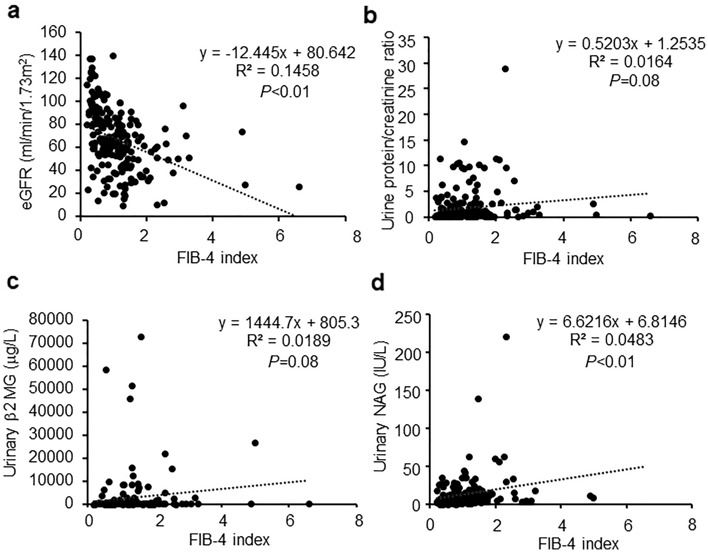
We calculated the FIB-4 index and eGFR before renal biopsy for all diseases. The results showed that there was a weak but negative correlation between the FIB-4 index and eGFR (R2 = 0.1458, P < 0.01, Fig. 1a). In contrast, the FIB-4 index was not correlated with the urinary protein-to-creatinine ratio (R2 = 0.0164, P = 0.08, Fig. 1b) and urinary β2 MG (R2 = 0.0819, P = 0.08, Fig. 1c). Furthermore, there was a negative correlation between the FIB-4 index and urinary NAG (R2 = 0.0483, P < 0.01, Fig. 1d).
Figure 1.
Associations of the FIB-4 index and renal function markers. (a) Correlation between the FIB-4 index and estimated glomerular filtration rate. (b) Correlation between the FIB-4 index and urine protein-creatinine ratio. (c) Correlation between the FIB-4 index and urinary b2 microglobulin. (d) Correlation between the FIB-4 index and urinary N-acetyl-b-d-glucosaminidase.
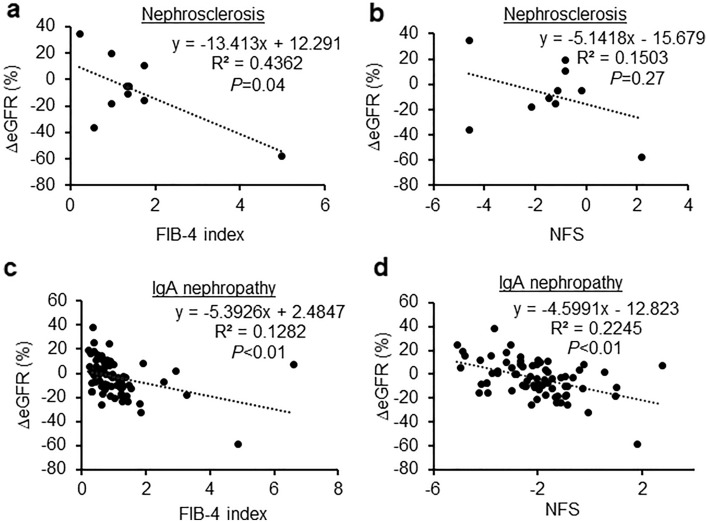
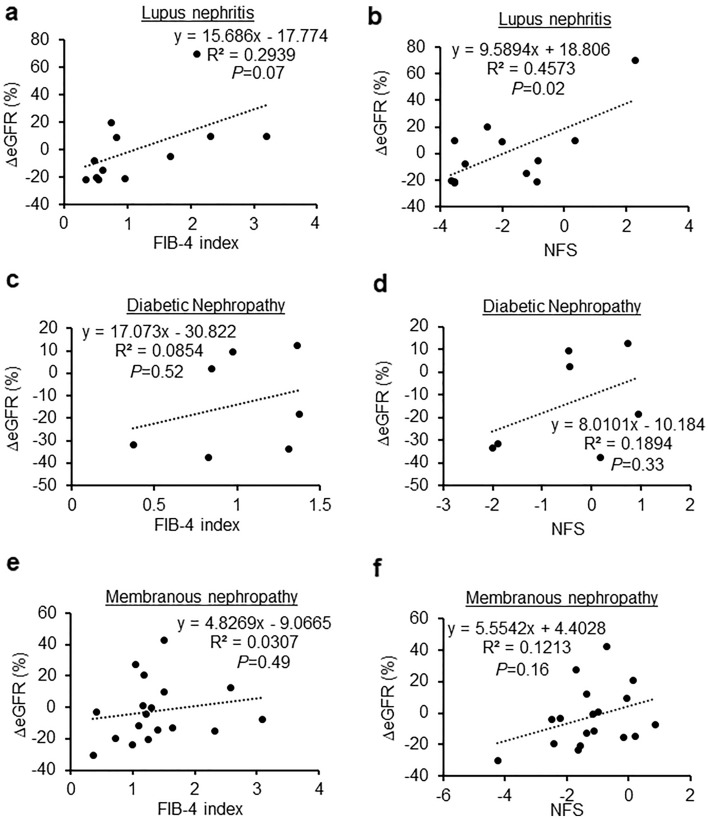
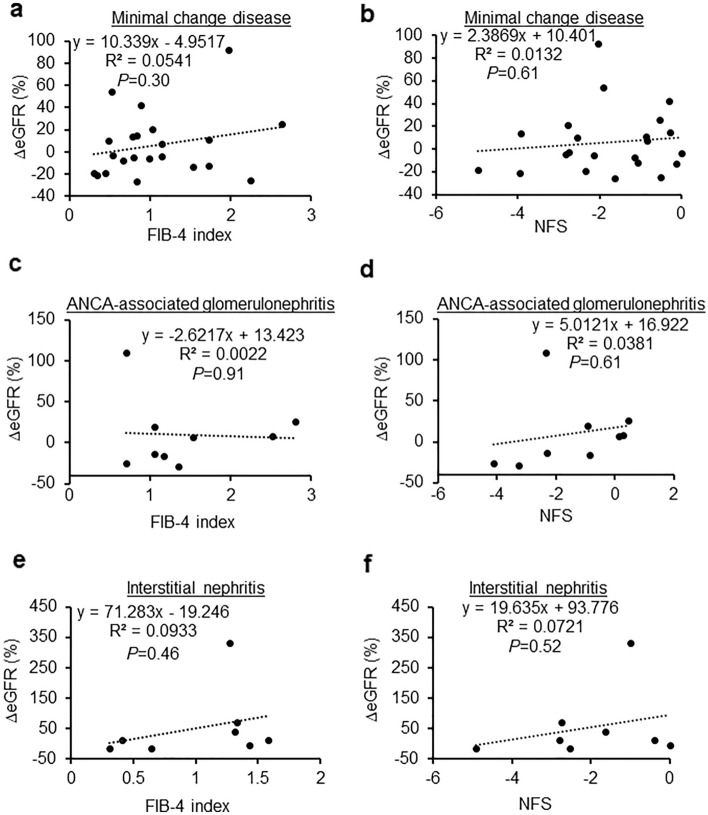
Next, we examined the relationship between FIB-4 index and NFS, and the rate of change in eGFR before and 12 months after renal biopsy. In nephrosclerosis, we found that the FIB-4 index was significantly negatively correlated with the eGFR (R2 = 0.4362, P = 0.04, Fig. 2a). Additionally, the correlation between NFS and eGFR tended to be negative, albeit without statistical significance (R2 = 0.1503, P = 0.27, Fig. 2b). In IgA nephropathy, the FIB-4 index (R2 = 0.1282, P < 0.01, Fig. 2c) and NFS (R2 = 0.2245, P < 0.01, Fig. 2d) were significantly negatively correlated with the eGFR. The rate of change in eGFR was not negatively associated with either FIB-4 or NFS in lupus nephritis (R2 = 0.2939, P = 0.07; R2 = 0.4573, P = 0.02, respectively; Fig. 3a,b), diabetic nephropathy (R2 = 0.0854, P = 0.52; R2 = 0.1894, P = 0.33, respectively; Fig. 3c,d), membranous nephropathy (R2 = 0.0307, P = 0.49; R2 = 0.1213, P = 0.16, respectively; Fig. 3e,f), minimal change disease (R2 = 0.0541, P = 0.30; R2 = 0.0132, P = 0.61, respectively; Fig. 4a,b), ANCA-associated glomerulonephritis (R2 = 0.0022, P = 0.91; R2 = 0.0381, P = 0.61, respectively; Fig. 4c,d), or interstitial nephritis (R2 = 0.0933, P = 0.46; R2 = 0.721, P = 0.52, respectively; Fig. 4e,f).
Figure 2.
Associations between the change in estimated glomerular filtration rate and fibrosis markers in nephrosclerosis and IgA nephropathy. (a,b) Correlation between the change in the estimated glomerular filtration rate and the FIB-4 index (a) and NFS (b) in nephrosclerosis. (c,d) Correlation between the change in the estimated glomerular filtration rate and the FIB-4 index (c) and NFS (d) in IgA nephropathy.
Figure 3.
Associations between the change in estimated glomerular filtration rate and fibrosis markers in lupus nephritis, diabetic nephropathy, and membranous nephropathy. (a,b) Correlation between the change in the estimated glomerular filtration rate and the FIB-4 index (a) and NFS (b) in lupus nephritis. (c,d) Correlation between the change in the estimated glomerular filtration rate and the FIB-4 index (c) and NFS (d) in diabetic nephropathy. (e,f) Correlation between the change in the estimated glomerular filtration rate and the FIB-4 index (e) and NFS (f) in membranous nephropathy.
Figure 4.
Associations between the change in estimated glomerular filtration rate and fibrosis markers in minimal change disease, ANCA-associated glomerulonephritis, and interstitial nephritis. (a,b) Correlation between the change in the estimated glomerular filtration rate and the FIB-4 index (a) and NFS (b) in minimal change disease. (c,d) Correlation between the change in the estimated glomerular filtration rate and the FIB-4 index (c) and NFS (d) in ANCA-associated glomerulonephritis. (e,f) Correlation between the change in the estimated glomerular filtration rate and the FIB-4 index (e) and NFS (f) in interstitial nephritis.
Next, we have checked in the high FIB-4 index group (≥ 1.3). In nephrosclerosis, we found that the FIB-4 index was more significantly negatively correlated with the rate of change in eGFR when examined in all cases including the low FIB-4 index (< 1.3) (R2 = 0.8115, P < 0.01, Fig. 5a). A similar trend was observed in interstitial nephritis, but the difference was not statistically significant (R2 = 0.4291, P = 0.29, Fig. 5b). However, other diseases did not show any changes when classified by high FIB-4 index levels.
Figure 5.
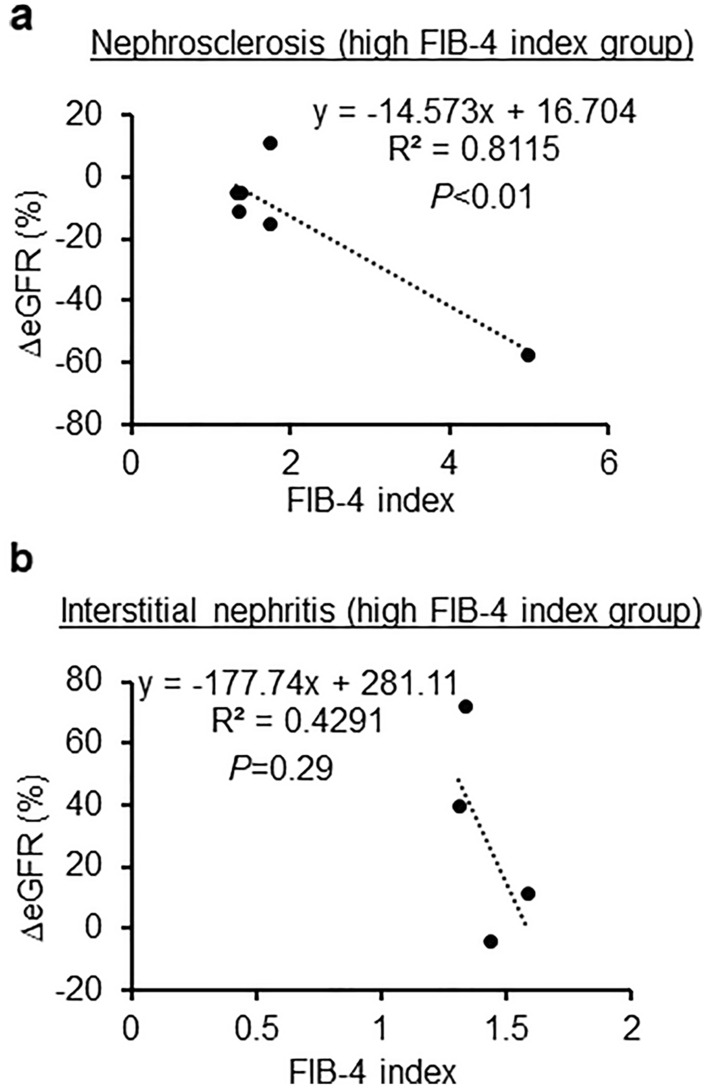
Associations between the change in estimated glomerular filtration rate and FIB-4 index in nephrosclerosis and IgA nephropathy of high FIB-4 index group. (a) Nephrosclerosis in high FIB-4 index group. (b) IgA nephropathy in high FIB-4 index group.
The association between the rate of change in eGFR and the levels of Cr, BUN, and urinary β2 MG before kidney biopsy was revealed by multivariate analysis (Table 3). As shown in Table 4, multivariate analysis showed that the rate of change in eGFR and FIB-4 index were independently associated in both nephrosclerosis and IgA nephropathy, even adjusting for relevant factors.
Table 3.
Multivariate analysis of factors associated with the rate of change in estimated glomerular filtration rate.
| Variables | β value | SE value | F value | 95% CI | P value |
|---|---|---|---|---|---|
| Age (years) | − 0.027 | 0.039 | 0.481 | − 0.105–0.050 | 0.49 |
| Body mass index | 0.002 | 0.007 | 0.057 | − 0.013–0.016 | 0.81 |
| SBP (mmHg) | − 0.036 | 0.051 | 0.505 | − 0.137–0.064 | 0.48 |
| DBP (mmHg) | − 0.051 | 0.033 | 2.387 | − 0.116–0.014 | 0.12 |
| Serum creatinine (µmol/L) | 0.006 | 0.001 | 19.023 | 0.003–0.009 | < 0.01 |
| BUN (mmol/L) | 0.093 | 0.023 | 17.142 | 0.049–0.138 | < 0.01 |
| Urine protein/creatine ratio | 0.001 | 0.001 | 0.011 | − 0.014–0.016 | 0.92 |
| Urinary NAG (IU/L) | 0.067 | 0.051 | 1.707 | − 0.034–0.169 | 0.19 |
| Urinary b2MG (µg/L) | 71.799 | 19.631 | 13.376 | 33.041–110.556 | < 0.01 |
SE standard error, CI confidential interval, SBP systolic blood pressure, DBP diastolic blood pressure, BUN blood urea nitrogen, urinary β2 MG urinary β2 microglobulin, urinary NAG urinary N-acetyl-β-d-glucosaminidase.
Table 4.
Multivariate analysis between the rate of change in estimated glomerular filtration rate and FIB-4 index in each renal pathology.
| Variables | β value | SE value | F value | 95% CI | P value |
|---|---|---|---|---|---|
| Nephrosclerosis | − 13.413 | 5.391 | 6.190 | − 25.846 to − 0.981 | 0.04 |
| IgA nephropathy | − 5.393 | 1.657 | 10.588 | − 8.696 to − 2.088 | < 0.01 |
| Lupus nephritis | 0.019 | 0.009 | 4.163 | − 0.002–0.039 | 0.07 |
| Diabetic nephropathy | 0.005 | 0.007 | 0.467 | − 0.014–0.024 | 0.52 |
| Membranous nephropathy | 4.827 | 6.782 | 0.506 | − 9.551–19.205 | 0.49 |
| Minimal change disease | 10.339 | 9.670 | 1.143 | − 9.832–30.511 | 0.30 |
| ANCA-associated glomerulonephritis | − 2.621 | 21.291 | 0.015 | − 52.969–47.726 | 0.91 |
| Interstitial nephritis | 71.283 | 90.700 | 0.618 | − 150.651–293.217 | 0.46 |
SE standard error, CI confidential interval.
Discussion
In the present study, we examined the relationship between each renal histopathology as determined by biopsy and non-invasive fibrosis markers. In nephrosclerosis, we found a statistically significant negative correlation between the FIB-4 index and eGFR, whereas the NFS and eGFR tended to have a negative correlation, albeit insignificant. Furthermore, in IgA nephropathy, both the NFS and FIB-4 index had statistically significant negative correlations with eGFR. Meanwhile, the pre-renal biopsy eGFR and FIB-4 index were negatively correlated in all subjects. This is consistent with previous reports, since patients eligible for renal biopsy suffered from CKD.
Our results showed that there was an association, albeit very weak, between the FIB-4 index and changes in eGFR. This may be due to the wide range of eGFR (1–100 ml/min/1.73 m2 or even higher), resulting in greater variability.
Recent studies have indicated that NAFLD could affect CKD, including DKD11. The FIB-4 index and NFS are widely used hepatic fibrosis markers for the diagnosis of NAFLD or NASH. Furthermore, the FIB-4 index could be useful for the prediction of the development of cardiovascular diseases12. It has been reported that the FIB-4 index is an indicator of inflammation; FIB-4 index is calculated using the platelet count, which contributes to thrombotic inflammatory actions owing to their ability to functionally interact with activated endothelial cells, leukocytes, and coagulation-related proteins13. Several studies have shown that inflammation is involved in the development of CKD14,15. As previously reported, nuclear factor NF-kappa-B (NF-kB) acts via inflammation and protein kinase C to activate the expression of cytokines; NF-kB is transferred to the nucleus, promptly activating the subsequent transcription of tumor necrosis factor-α, vascular cell adhesion molecule 1, or interleukin-6 in the kidneys of CKD patients3,16,17.
Previous reports have indicated that the activation of the TGF-β/Smad pathway is associated with the FIB-4 index and NFS18. We reported that Smad1 signaling plays a significant role in increasing the extracellular matrix, such as type 4 collagen and α-smooth muscle actin, in mesangial cells19. Inflammatory processes inevitably cause damage; as part of the healing process, glomerulosclerosis increases the mesangial extracellular matrix, leading to a decreased glomerular filtration rate14,20. Our results showed that the FIB-4 index and NFS were negatively correlated with eGFR in nephrosclerosis and IgA nephropathy, which are both characterized by an increase in mesangial extracellular matrix.
Obesity is the most common risk factor for NAFLD and an independent risk for developing CKD21. Furthermore, we have reported the mechanisms of developing obesity-related CKD3,14–16,22. NAFLD is one of the most common causes of chronic liver disease in clinical practice in its entire spectrum of conditions, ranging from simple lipidosis to steatohepatitis and cirrhosis23–25. It has been reported that liver fibrosis and fatty liver are crucial in the development of DKD26. In contrast, another study using multivariate analysis showed that the presence of NAFLD was not a significant predictor of the development of DKD11. In this regard, the association between NAFLD and DKD remains inconsistent. Although patients in our study tended to be obese (median value of body mass index: 22.7), we could not find any correlation between the FIB-4 index and eGFR in patients with type 2 diabetes.
Unlike eGFR, there was no clear correlation between urinary protein or tubulointerstitial markers and FIB-4 index. It has been reported that the FIB-4 index may be associated with vascular endothelial function27, which is a mechanism of glomerulosclerosis caused by glomerular endothelial dysfunction3,17. Thus, the FIB-4 index may be more reflective of glomerulosclerotic lesions. In contrast, proteinuria, which is mainly caused by podocyte dysfunction, may not be associated with the FIB-4 index, which is associated with glomerular endothelial cells28,29.
This study has several limitations. First, liver diseases, such as NASH or NAFLD, were not evaluated by imaging and liver biopsy. Second, we conducted a retrospective analysis of a cohort from a single center. Finally, some diseases, especially nephrosclerosis, had a small number of cases.
Conclusion
The FIB-4 index and NFS, which are non-invasive fibrosis markers, could be predictive markers of reduced eGFR, especially in nephrosclerosis and IgA nephropathy.
Material and methods
Patient groups
All procedures performed in studies involving human participants were in accordance with the ethical standards of the institutional and/or national research committee and with the 1964 Helsinki Declaration and its later amendments or comparable ethical standards. The ethics committee of Osaka Medical and Pharmaceutical University approved this study (approval number: 2020-095). Written informed consent was obtained from all subjects. This study included a retrospective cohort of 179 cases who underwent kidney biopsy at Osaka Medical and Pharmaceutical University Hospital between April 2015 and July 2020. Data were collected and analyzed retrospectively by using electronic medical records maintained by the Department of Nephrology at Osaka Medical and Pharmaceutical University Hospital. Cr, BUN, eGFR, urine protein-to-creatinine ratio, urinary NAG, urinary β2 MG, and patient characteristics (e.g., underlying diseases, age, sex, blood pressure, and body mass index) were searched from the electronic medical records and kidney biopsy database. No diagnosis of fatty liver was diagnosed by liver biopsy or ultrasonography.
Kidney biopsy
Kidney specimens were obtained with a 16-gauge biopsy needle (Bard, New Providence, NJ). Specimens were fixed in 10% formalin, and the prepared sections were stained with hematoxylin–eosin, Masson trichrome, periodic acid silver methenamine, or periodic acid-Schiff. At least three pathologists evaluated each specimen.
Definition of non-invasive fibrosis markers
The degree of liver fibrosis was evaluated by the FIB-4 index and NFS. FIB-4 was calculated using the following formula: age (years) × aspartate aminotransferase (AST, IU/L) / platelet (109/L) × √ alanine aminotransferase (ALT, IU/L). High FIB-4 index group was defined as 1.3 or higher30. NFS was calculated using the following formula: − 1.675 + 0.037 × age (years) + 0.094 × body mass index (kg/m2) + 1.13 × impaired fasting glucose/diabetes (yes = 1, no = 0) + 0.99 × AST (IU/L) / ALT (IU/L)—0.013 × platelet (109/L)—0.66 × albumin (g/dL).
Calculation of eGFR
Levels of serum creatinine were measured in all samples using an enzymatic method in laboratories, and the values are represented using two decimal places. The eGFR of each patient was calculated using the following formula: 194 × serum creatinine − 1.094 × age − 0.287 × 0.739 (if female). The rate of change in eGFR was used to evaluate renal function in each period and was calculated using the following formula: ((eGFR 12 months after kidney biopsy—eGFR before kidney biopsy))/eGFR before kidney biopsy) × 100.
Statistical analyses
Continuous variables are presented as medians. Comparisons were made between groups using the Mann–Whitney U test; categorical variables were presented as numbers (percentage) and compared using Pearson’s Chi-squared test and Fisher’s exact test, as appropriate. All analyses were performed using StatView (SAS Institute, Cary, CA, USA) and Excel software. Statistical significance was defined as P < 0.05.
Acknowledgements
The authors thank Dr. Tatsuhiko Mori (Osaka Medical and Pharmaceutical University) for the discussions on the statistical analysis and renal pathology. The authors also thank to Ms. Yumiko Ohgami for preparation of the renal pathology data. This work is supported by grants to A.M. from JSPS KAKENHI Grant Number 22K08368, the Osaka Kidney Foundation Grant Number OKF21-0003 and Takeda Medical Foundation.
Author contributions
A.M. contributed to the conception and design of the study. Material preparation, data collection, and analyses were performed by A.M. The first draft of the manuscript was written by A.M.
Data availability
The data that support the findings of this study are available in the figshare at https://figshare.com/articles/dataset/raw_data_update_xlsx/19590235, but restrictions apply to the availability of these data, and so are not publicity available. Data are however available from the author upon reasonable request and with permission of figshare.
Competing interests
A.M. received a speaker’s honorarium from Otsuka, Kyowa Kirin, Mitsubishi Tanabe, Torii, Kowa, Sumitomo Pharma, Bayer, Eli Lilly, Astellas, and Boehringer Ingelheim. A.M. received research grants from Kyowa Kirin, Sumitomo Pharma, Otsuka, Torii, Daiichi-Sankyo, Mitsubishi Tanabe, Boehringer Ingelheim, and Eli Lilly.
Footnotes
Publisher's note
Springer Nature remains neutral with regard to jurisdictional claims in published maps and institutional affiliations.
References
- 1.Diabetes C, et al. The effect of intensive treatment of diabetes on the development and progression of long-term complications in insulin-dependent diabetes mellitus. N. Engl. J. Med. 1993;329:977–986. doi: 10.1056/NEJM199309303291401. [DOI] [PubMed] [Google Scholar]
- 2.Kramer HJ, et al. Increasing body mass index and obesity in the incident ESRD population. J. Am. Soc. Nephrol. 2006;17:1453–1459. doi: 10.1681/ASN.2005111241. [DOI] [PubMed] [Google Scholar]
- 3.Mima A, et al. Glomerular-specific protein kinase C-beta-induced insulin receptor substrate-1 dysfunction and insulin resistance in rat models of diabetes and obesity. Kidney Int. 2011;79:883–896. doi: 10.1038/ki.2010.526. [DOI] [PMC free article] [PubMed] [Google Scholar]
- 4.Fuster D, Samet JH. Alcohol use in patients with chronic liver disease. N. Engl. J. Med. 2018;379:2579. doi: 10.1056/NEJMra1715733. [DOI] [PubMed] [Google Scholar]
- 5.Carmiel-Haggai M, Cederbaum AI, Nieto N. A high-fat diet leads to the progression of non-alcoholic fatty liver disease in obese rats. FASEB J. 2005;19:136–138. doi: 10.1096/fj.04-2291fje. [DOI] [PubMed] [Google Scholar]
- 6.Sorino P, et al. Development and validation of a neural network for NAFLD diagnosis. Sci. Rep. 2021;11:20240. doi: 10.1038/s41598-021-99400-y. [DOI] [PMC free article] [PubMed] [Google Scholar]
- 7.Cotter TG, Rinella M. Nonalcoholic fatty liver disease 2020: The state of the disease. Gastroenterology. 2020;158:1851–1864. doi: 10.1053/j.gastro.2020.01.052. [DOI] [PubMed] [Google Scholar]
- 8.Chon YE, et al. Decrease in waist-to-hip ratio reduced the development of chronic kidney disease in non-obese non-alcoholic fatty liver disease. Sci. Rep. 2020;10:8996. doi: 10.1038/s41598-020-65940-y. [DOI] [PMC free article] [PubMed] [Google Scholar]
- 9.Castera L, Friedrich-Rust M, Loomba R. Noninvasive assessment of liver disease in patients with nonalcoholic fatty liver disease. Gastroenterology. 2019;156:1264–1281. doi: 10.1053/j.gastro.2018.12.036. [DOI] [PMC free article] [PubMed] [Google Scholar]
- 10.Hara M, et al. Non-invasive fibrosis assessments of non-alcoholic fatty liver disease associated with low estimated glomerular filtration rate among CKD patients: The Fukuoka Kidney disease Registry Study. Clin. Exp. Nephrol. 2021;25:822–834. doi: 10.1007/s10157-020-02018-z. [DOI] [PubMed] [Google Scholar]
- 11.Saito H, et al. High FIB4 index is an independent risk factor of diabetic kidney disease in type 2 diabetes. Sci. Rep. 2021;11:11753. doi: 10.1038/s41598-021-88285-6. [DOI] [PMC free article] [PubMed] [Google Scholar]
- 12.Vieira Barbosa J, et al. Fibrosis-4 index can independently predict major adverse cardiovascular events in nonalcoholic fatty liver disease. Am. J. Gastroenterol. 2022;117:453–461. doi: 10.14309/ajg.0000000000001606. [DOI] [PubMed] [Google Scholar]
- 13.Fraser DA, et al. A structurally engineered fatty acid, icosabutate, suppresses liver inflammation and fibrosis in NASH. J. Hepatol. 2021;76:800–811. doi: 10.1016/j.jhep.2021.12.004. [DOI] [PubMed] [Google Scholar]
- 14.Mima A. Inflammation and oxidative stress in diabetic nephropathy: New insights on its inhibition as new therapeutic targets. J. Diabetes Res. 2013;2013:248563. doi: 10.1155/2013/248563. [DOI] [PMC free article] [PubMed] [Google Scholar]
- 15.Mima A, Yasuzawa T, King GL, Ueshima S. Obesity-associated glomerular inflammation increases albuminuria without renal histological changes. FEBS Open Bio. 2018;8:664–670. doi: 10.1002/2211-5463.12400. [DOI] [PMC free article] [PubMed] [Google Scholar]
- 16.Mima A. Diabetic nephropathy: Protective factors and a new therapeutic paradigm. J. Diabetes Compl. 2013;27:526–530. doi: 10.1016/j.jdiacomp.2013.03.003. [DOI] [PubMed] [Google Scholar]
- 17.Mima A, et al. Protective effects of GLP-1 on glomerular endothelium and its inhibition by PKCbeta activation in diabetes. Diabetes. 2012;61:2967–2979. doi: 10.2337/db11-1824. [DOI] [PMC free article] [PubMed] [Google Scholar]
- 18.Dawood AA, Saleh AA, Elbahr O, Gohar SF, Habieb MS. Inverse relationship between the level of miRNA 148a–3p and both TGF-beta1 and FIB-4 in hepatocellular carcinoma. Biochem. Biophys. Rep. 2021;27:101082. doi: 10.1016/j.bbrep.2021.101082. [DOI] [PMC free article] [PubMed] [Google Scholar]
- 19.Mima A, et al. Activation of Src mediates PDGF-induced Smad1 phosphorylation and contributes to the progression of glomerulosclerosis in glomerulonephritis. PLoS ONE. 2011;6:e17929. doi: 10.1371/journal.pone.0017929. [DOI] [PMC free article] [PubMed] [Google Scholar]
- 20.Fogo AB. Mesangial matrix modulation and glomerulosclerosis. Exp. Nephrol. 1999;7:147–159. doi: 10.1159/000020595. [DOI] [PubMed] [Google Scholar]
- 21.Kiapidou S, Liava C, Kalogirou M, Akriviadis E, Sinakos E. Chronic kidney disease in patients with non-alcoholic fatty liver disease: What the Hepatologist should know? Ann. Hepatol. 2020;19:134–144. doi: 10.1016/j.aohep.2019.07.013. [DOI] [PubMed] [Google Scholar]
- 22.Mima A, Qi W, King GL. Implications of treatment that target protective mechanisms against diabetic nephropathy. Semin. Nephrol. 2012;32:471–478. doi: 10.1016/j.semnephrol.2012.07.010. [DOI] [PMC free article] [PubMed] [Google Scholar]
- 23.Adams LA, Angulo P, Lindor KD. Nonalcoholic fatty liver disease. CMAJ. 2005;172:899–905. doi: 10.1503/cmaj.045232. [DOI] [PMC free article] [PubMed] [Google Scholar]
- 24.Day CP. Non-alcoholic fatty liver disease: Current concepts and management strategies. Clin. Med. (Lond) 2006;6:19–25. doi: 10.7861/clinmedicine.6-1-19. [DOI] [PMC free article] [PubMed] [Google Scholar]
- 25.Tolman KG, Fonseca V, Dalpiaz A, Tan MH. Spectrum of liver disease in type 2 diabetes and management of patients with diabetes and liver disease. Diabetes Care. 2007;30:734–743. doi: 10.2337/dc06-1539. [DOI] [PubMed] [Google Scholar]
- 26.Han E, Lee YH. Non-alcoholic fatty liver disease: The emerging burden in cardiometabolic and renal diseases. Diabetes Metab. J. 2017;41:430–437. doi: 10.4093/dmj.2017.41.6.430. [DOI] [PMC free article] [PubMed] [Google Scholar]
- 27.Lambrecht J, et al. A PDGFRbeta-based score predicts significant liver fibrosis in patients with chronic alcohol abuse, NAFLD and viral liver disease. EBioMedicine. 2019;43:501–512. doi: 10.1016/j.ebiom.2019.04.036. [DOI] [PMC free article] [PubMed] [Google Scholar]
- 28.Mundel P, Reiser J. Proteinuria: An enzymatic disease of the podocyte? Kidney Int. 2010;77:571–580. doi: 10.1038/ki.2009.424. [DOI] [PMC free article] [PubMed] [Google Scholar]
- 29.Mima A, et al. Glomerular VEGF resistance induced by PKCdelta/SHP-1 activation and contribution to diabetic nephropathy. FASEB J. 2012;26:2963–2974. doi: 10.1096/fj.11-202994. [DOI] [PMC free article] [PubMed] [Google Scholar]
- 30.Kim MC, et al. Serum zinc level and hepatic fibrosis in patients with nonalcoholic fatty liver disease. PLoS ONE. 2020;15:e0240195. doi: 10.1371/journal.pone.0240195. [DOI] [PMC free article] [PubMed] [Google Scholar]
Associated Data
This section collects any data citations, data availability statements, or supplementary materials included in this article.
Data Availability Statement
The data that support the findings of this study are available in the figshare at https://figshare.com/articles/dataset/raw_data_update_xlsx/19590235, but restrictions apply to the availability of these data, and so are not publicity available. Data are however available from the author upon reasonable request and with permission of figshare.


