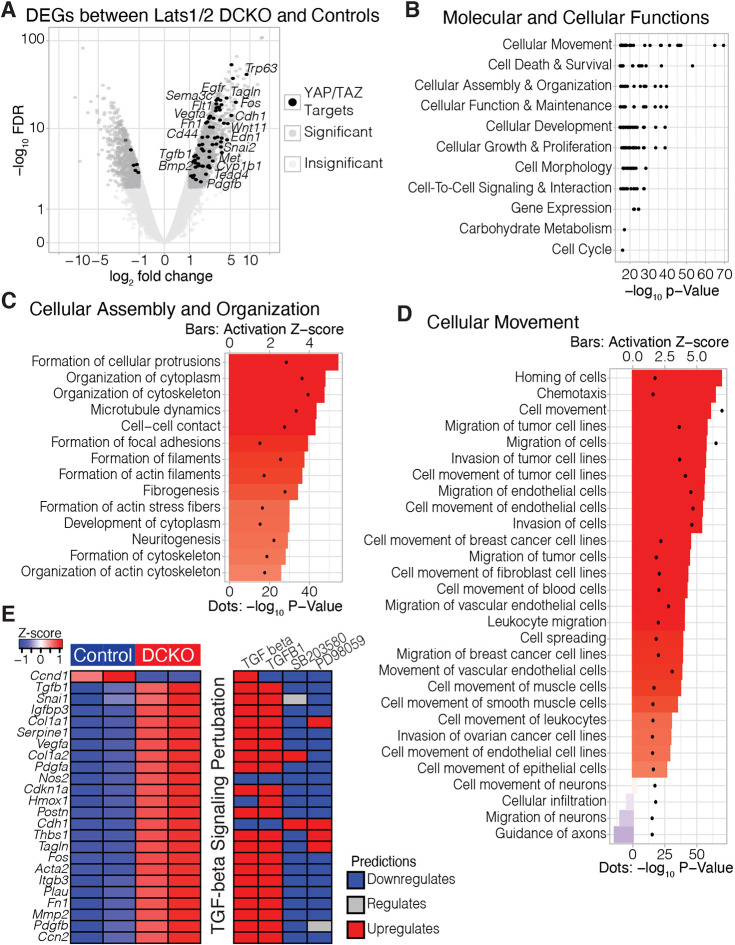
Fig. 3.
Transcriptional profiling of Lats1/2 DCKO neural tubes shows disruption to pathways associated with cell migration, cytoskeleton and neurogenesis. (A) Volcano plot of differential gene expression between DCKO and control NTs at E10.5. Significant genes (FDR<0.01; |log2FC|>1) are in dark gray. Significant genes predicted to be upregulated by TAZ and/or YAP are highlighted in black. (B) Ranked order of the most significant molecular and cellular function terms identified by Ingenuity Pathway Analysis (IPA). Labels indicate parent terms, and black dots represent significant child terms. (C,D) Child terms under ‘cellular assembly and organization’ (C) and ‘cellular movement’ (D) ranked by activation Z-score, i.e. the consistency of gene expression changes associated with each term. Activation Z-scores are indicated by bars; P-values are represented by dots. (E) Per replicate heatmap (left) displaying the intersection of TGFB target genes identified by TGFB, TGFB1, SB203580 and PD98059, and how those genes are predicted to react to the application of any of those compounds (right).

