Abstract
The Kirsten rat sarcoma (KRAS) oncoprotein has been on drug hunters list for decades now. Initially considered undruggable, recent advances have successfully broken the jinx through covalent inhibition that exploits the mutated cys12 in the switch II binding pocket (KRASG12C). Though this approach has achieved some level of success, patients with mutations other than cys12 are still uncatered for. KRASG12D is the most frequent KRAS mutated oncoprotein. It is only until recently, MRTX1133 has been discovered as a potential inhibitor of KRASG12D. This study seeks to unravel the structural binding mechanism of MRTX1133 as well as identify potential drug leads of KRASG12D based on structural binding characteristics of MRTX1133. It was revealed that MRTX1133 binding stabilizes the binding site by increasing the hydrophobicity which resultantly induced positive correlated movements of switches I and II which could disrupt their interaction with effector and regulatory proteins. Furthermore, MRTX1133 interacted with critical residues; Asp69 (− 4.54 kcal/mol), His95 (− 3.65 kcal/mol), Met72 (− 2.27 kcal/mol), Thr58 (− 2.23 kcal/mol), Gln99 (− 2.03 kcal/mol), Arg68 (− 1.67 kcal/mol), Tyr96 (− 1.59 kcal/mol), Tyr64 (− 1.34 kcal/mol), Gly60 (− 1.25 kcal/mol), Asp12 (− 1.04 kcal/mol), and Val9 (− 1.03 kcal/mol) that contributed significantly to the total free binding energy of − 73.23 kcal/mol. Pharmacophore-based virtual screening based on the structural binding mechanisms of MRTX1133 identified ZINC78453217, ZINC70875226 and ZINC64890902 as potential KRASG12D inhibitors. Further, structural optimisations and biochemical testing of these compounds would assist in the discovery of effective KRASG12D inhibitors.
Subject terms: Computational biology and bioinformatics, Drug discovery, Chemistry
Introduction
Kirsten Rat Sarcoma (KRAS) viral oncogene is the most studied of the Ras family of proteins (HRAS, NRAS and KRAS) with the most mutations that result in a range of cancers including colorectal cancer (CRC), non-small cell lung cancer (NSCLC) and pancreatic adenocarcinoma (PDAC)1. In these cancers, KRAS is responsible for approximately 45% of cases in CRC, 35% in NSCLC and 90% in PDAC with poor prognosis and resistance to standard-of-care chemotherapy, denoting a critically unmet medical need that requires novel therapies to target KRAS2. However, unlike other oncogenic proteins such as Vascular Endothelial Growth Factor Receptor (VEGFR) and Epidermal Growth Factor Receptor (EGFR) that are easily druggable3,4, drugging KRAS was hampered by the lack of a well-defined binding site and its high affinity towards an abundance of GDP/GTPin the cytosol until recently5,6.
KRAS rotates between a GTP-bound and GDP-bound states representing an active and an inactive states respectively whose conversion is controlled by GEFs which produce the exchange from GDP to GTP, and GAPswhich influence the hydrolysis of GTP7,8. The activation by binding GTP perturbs the effector protein binding regions of KRAS by altering their conformations9 which resultantly activate downstream signaling pathways10,11. The mutations at codon 12 to other residue with a wide steric footprint hinders the binding of KRAS with GTPase activating proteins (GAPs) thereby interfering with GTP hydrolysis12. This interference locks KRAS in its innately active GTP-bound state hence favoring KRAS effector pathways activation13. Being a cellular signal transducer, the activation of KRAS biologically affects three downstream signaling pathways such as the rapidly accelerated fibrosarcoma-mitogen-activated protein kinase kinase-extracellular signal-regulated kinase (RAF-MEK-ERK)14, RAL guanine nucleotide dissociation stimulator-RAL (RALGDS-RAL)15 and phosphoinositide 3-kinase-protein kinase B-mammalian target of rapamycin (PI3K-AKT-Mtor)16. Responding to other stimuli and growth factors, KRAS together with its downstream pathways regulate cellular functions including survival, proliferation, migration, differentiation, adhesion and apoptosis which becomes corrupted upon mutations of KRAS resulting in over activation and cancer17. These mutations which mostly occurat codon 12, 13 and 61 ( G12D, G12V,G12C, G13D and Q61R) accounting for 70% of cases with missense mutation at codon 12 and 13 limiting the interaction of the protein with GAPs thus preventing the switching off of KRAS18. Due to the reasons stated in the first stanza, it took several decades of research to finally drug KRAS. However, this breakthrough is limited to G12C wherein the inhibitory activity depends on an electrophilic warhead forming a stable covalent bond with the nucleophilic head of the mutated cysteine19 thus these inhibitors occupy the induced switch II pocket20,21. This selective targeting of KRASG12C has left KRAS cancer patients driven by other mutations with unmet medical needs, spurring further search for inhibitors with novel mechanism of action to reversibly inhibit KRAS. KRASG12D is the most common occurring mutation among the KRAS driven tumors representing 33% of cases18 and has therefore been on the top list of drug hunters, however, due to the absence of a reactive residue within the binding pocket, developing inhibitors has been challenging wherein limited cellular activities were observed22–24. Nonetheless, the constant perseverance through optimization and structure-based activity improvements by drug developers has yielded MRTX1133, a reversible, potent and selective KRASG12D inhibitor which has shown efficacy in KRASG12D mutant xenograft mouse tumor model25.
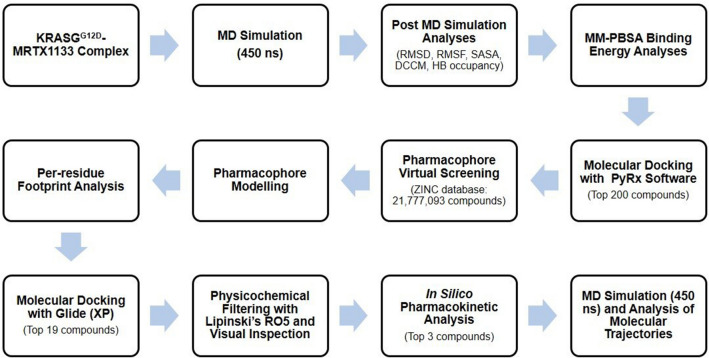
In this current study, we sought to investigate and provide molecular insights and conformational dynamics bases for MRTX1133 evasion of KRASG12D resistance through molecular dynamics simulations and structural analysis (Fig. 1). These insights would be further exploited for the design of structure-based pharmacophore towards the identification of hit compounds with KRASG12D inhibitory potentials from the ZINC database.
Figure 1.
Schematic diagram of the approach applied to this study. First four sections indicate the characterization approach applied to MRTX1133, while rest of the sections depict the process of hit compounds identification.
Methodology
System preparation
The x-ray diffraction crystal structure with 1.3 Å resolution in complex with MRTX1133 and GDP was retrieved from the protein data bank (PDB ID: 7RPZ)26. The retrieved protein was prepared using UCSF Chimera candidate version 1.13.127 by removing all nonstandard residues including water molecules. The prepared complex, which included the KRASG12D, MRTX1133 and the GDP was saved as a KRASG12D-MRTX1133 complex. The protein containing only the GDP was also saved as holo. The systems (KRASG12D-MRTX1133 and holo protein) were then prepared for MD simulation by adding amber charges to MRTX1133 and the GDP, while all atoms of the protein complexes were minimized using the protein preparation wizard of Schrödinger Maestro (Schrödinger Suite 2017–4 Protein Preparation Wizard, 2018).
Molecular dynamics (MD) simulations
The systems set up were taken through a long-range molecular dynamics simulation. The graphical processing unit version of Particle Mesh Ewald Molecular Dynamics (PMEMD) engine in AMBER 18 package28 was used to perform the simulation. The AMBER force field (FF14SB)29 and the integrated pdb4amber program were used to parameterize and modify the proteins, respectively, while the GDP and MRTX1133 were parameterized using the antechamber module of AMBER18. This module was also used to create partial atomic charges for the ligands. Afterwards, the tLeap module of AMBER 18 was utilized to neutralize the systems by adding Na+ and Cl− counter ions as well as solvating the systems by suspending them in Transferable Intermolecular Potential with 3 Points (TIP3P) water box of 10 Å. Input coordinates and topology files for the systems were then generated using the tLeap module. The systems were then initially minimized for 2500 steps with the steepest descent and then switched to conjugate gradient algorithm for further 5000 steps minimization using 500 kcal/molÅ−2 restraint potential. Afterwards the systems were then heated gradually from 0 to 300 K for 5 ps in isothermal-isobaric NTP ensemble with Langevin thermostat at a pressure of 1 bar using Brendsen barostat30. Equilibrations were then performed to relax the systems at 300 K for 1000 ps without energy restraint. Molecular dynamics production was then performed for 450 ns with the SHAKE algorithm31 used to restrain all hydrogen bonds at 2 fs time step.
Post MD analysis
The trajectories and coordinates generated from the MD simulations were all analyzed using the CPPTRAJ and PTRAJ modules32 of AMBER 18. Origin data tool33 was used to plot all graphs whiles visualization of snapshots was performed with Discovery Studio (BIOVIA 2017) and UCSF Chimera27,34.
Thermodynamics estimations
We utilized the molecular mechanics Poisson-Boltzmann surface area (MM-PBSA) method to predict the binding free energy of the complexes using the mmpbsa.py module35 incorporated in AMBER 18. This method is widely used due to its efficiency and low cost. From each of the trajectories generated from the systems, the binding free energy was averaged over 30,000 snapshots using a time step of 50 ps. The energies calculated from this method are depicted as follows:
| 1 |
| 2 |
where ΔGbind is taken to be the sum of the gas phase and solvation energy terms less the entropy (TΔS) term
| 3 |
where Egas is the total of the AMBER force field internal energy terms. Eint (bond, angle and torsion), the covalent van der Waals (Evdw) and the non-bonded electrostatic energy component (Eele). The solvation energy is denoted by the equation:
| 4 |
| 5 |
The polar solvation contribution is denoted as GPB and Gnon-polar represents the non-polar contribution energy and is computed from the solvent assessable surface area (SASA) which is obtained by the use of 1.4 Å water probe radius. Per-residue decomposition analyses were also performed to estimate individual energy contribution of the residues of the substrate pocket to the affinity and stabilisation of the compounds.
Dynamic cross correlation matrices (DCCM)
Analysis of the dynamic cross correlation of MD simulation trajectory is used to investigate the correlated motion of residual-based fluctuations during the course of simulation. This investigation was performed on the two switches of the protein which are very critical for interaction with effector proteins. The cross-correlation coefficient Cij for the pair of C–α atoms i and j were calculated based on the formula below:
| 6 |
where Δrj and Δri are the displacement from the mean locations of the jth and ith atom respectively. The cross-correlation coefficient Cij has a range of + 1 to − 1 wherein the lower and upper limits denote fully anti-correlated and correlated movements during the course of simulation. The CCPTRAJ module incorporated in AMBER 18 package was used to calculate the dynamic cross-correlation.
Principal component analysis (PCA)
We used the PCA approach to evaluate changes in the compound’s dynamics and conformations during the period of simulation in reference to the MRTX1133. This method comprises the eigenvalues and eigenvectors which respectively informs on the quantum and direction of motions. The two principal components were calculated by employing the CPPTRAJ module, whereas the conformational behaviours were projected along the directions of these two components (ev1/PC1 vs. ev2/PC2).
Pharmacophore modelling
The phase model was utilized to generate a pharmacophore model centred on PRED analysis of the KRASG12D-MRTX1133 complex. The residues that contributed energies above − 1.0 kcal/mol to the total free binding energy of MRTX1133 complexing were identified and their respective interactions with the moieties on MRTX1133 were used as the bases for the pharmacophore model.
Virtual screening and docking of hits
The pharmacophore model created was then used for virtual screening of the ZINC database36 for inhibitors that possessed good fitness with RMSD values less than 0.9 Å. The retrieved inhibitors were then prepared for structure-based screening with PyRx software37 with a grid box of center: x = 0.48195, y = 3.92564, and z = − 22.5689 with size of: x = 20.183, y = 17.1422, and z = 18.9123. Compounds that showed binding energies lower than − 8.5 kcal/mol were eliminated whiles those scoring − 8.6 kcal/mol and above were further processed for docking with Glide38.The KRASG12D protein was prepared using the protein preparation wizard suit incorporated in Schrödinger. For the binding site, a grid box centred at MRTX1133 was utilized to cater for maximum length of the ligand. OPLS3e force field39 was applied to input partial charges and default van der Waals scaling was employed. The selected compounds were flexibly docked with extra precision (XP), with a maximum of writing out one pose per compound as well as post docking minimisation of the compounds. MRTX1133 was redocked and the docking conformation was realigned with its co-crystalized conformation to determine the root mean square deviation (RMSD) to validate the docking program.
ADME and toxicity prediction
The pharmacokinetics of the hit compounds were analysed with SwissADME40, an online server that evaluates the hit compounds functionality inside the body. Evaluating the toxicity of compounds is also an important part of the drug development process. This allows for the determining of the toxic features of a compound through the estimated lethal dose (LD50) in mg/kg weight. ProTox-II, an online server to determine the toxicity of compounds by incorporating fragment propensity, machine learning and molecular similarity was utilized41. The compounds are classified into categories ranging from class I to VI based on their safety according to the globally harmonized system of classification of labelling chemicals42,43.
MD simulation of hit compounds
The simulation of selected hit compounds was performed using the same protocol used for the KRASG12D-MRTX1133 complex as explained above.
Results and discussion
The KRAS protein and its other family members (HRAS and NRAS) consist of two main components, a membrane-targeting hyper variable region (HVR) and the conserved catalytic domain44. The conserved domain is made up of five alpha helices that surrounds six beta sheets and engages in interactions with regulators and effectors which is conditioned by conformational changes of two flexible regions. These flexible regions, switch I and Switch II cover residue 30–38 and 59–76 respectively45. We therefore investigated the impact of MRTX1133 on these switches.
MRTX1133 binding stabilizes KRASG12D binding site
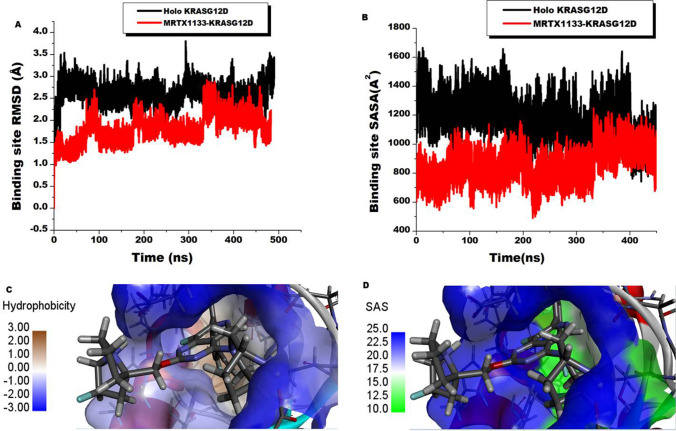
Binding allosterically to KRASG12D, MRTX1133 effectiveness as a small molecule inhibitor is to instigate a communication across the structure to a spatially distant site specifically the switches (I and II) whose conformational changes influence the catalytic domain’s interactions with effector and regulatory proteins46. This communication will depend on the immediate impact of the small molecule on the binding pocket of the protein. Thus, we first sought to determine the effect of MRTX1133 binding on the allosteric binding pocket residues by computing the deviations of the C–α atoms of the pocket residues over 450 ns simulation relative to the starting structure. The root-mean square deviation (RMSD) matric was therefore utilized and the results displayed in Fig. 2. The occupied site showed an average RMSD values of 1.80 Å, while the unoccupied pocket displayed RMSD values of 2.61 Å. These results indicate MRTX1133 presence induced stability of the pocket residues, a deviation from the normal state. An analysis of the solvent accessibility surface area (SASA) of the pocket was also investigated and shown in Fig. 2. Average SASA results of 1169.66 A2 and 856.44 A2 were presented by the holo and MRTX1133 sites respectively. This matric is informative of the surface area of the pocket that is exposed to solvent interaction and thus could also be indicative of the folding and/or realignment of the residues towards the hydrophilic or hydrophobic core of the protein. As observed, the presence of MRTX1133 reduced the surface area of the site that is available for external interaction in a holo state by 313.22 A2. Thus, the site residues favored the hydrophobic core of the protein in MRTX1133 presence. The hydrophobicity as presented in Fig. 2C estimates the degree of affinity between the residues side chains and water. This feature is critical for the stabilization and folding of the protein structure47. As observed, the deeper the residues in the pocket the higher the hydrophobicity. This is depicted by the color bar wherein high hydrophilicity is denoted by blue color whiles hydrophobicity is brown. Taken together, the stability and the increase in hydrophobicity of the site residues could condition signaling to the protein–protein interface that influences its overall therapeutic effect.
Figure 2.
Comparative stability and solvent accessibility surface area of the binding site of KRASG12D upon the binding of MRTX1133 and the holo protein. (A) Shows the RMSD plots of the C-a atoms of the binding site residues indicating MRTX1133 binding stabilized the residues (red) relative to the holo (black). (B) Shows the SASA plots of the binding site residues indicating a reduction in surface area availability upon MRTX1133 binding (red) relative to the holo protein (black). (C) Shows the hydrophobicity of the binding site. (D) Shows the solvent accessible of area of the binding site.
Since proteins are sensitive to stimuli, these induced changes could be the initiation process for the inhibition of KRAS. To further ascertain the impact of these changes on distant critical domains, we investigated the residual response to these pocket site changes.
KRAS switches reacts to binding site changes through correlated residual movements
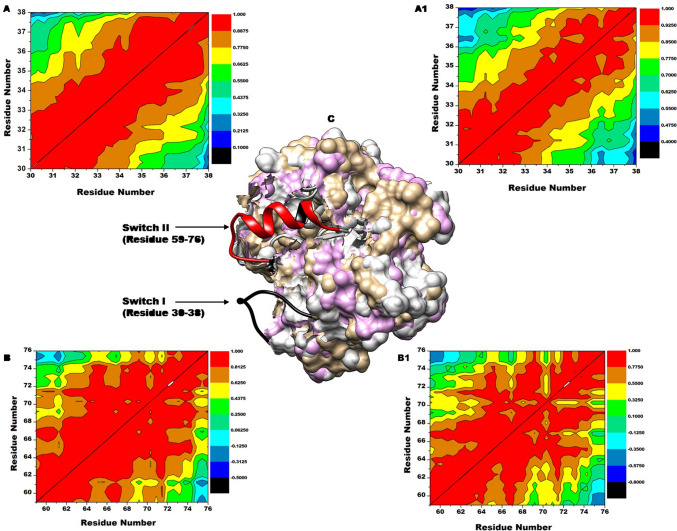
The variations in internal correlation movements of the residues of switch I and II were analyzed by cross-correlation matrices of the C–α atoms fluctuations. Figure 3 shows the DCCM plots of switch I and II. The most negative regions (blue–black) and the most positive regions (yellow–red) reflect strong anti-correlated movements and strong correlated motions of the specific residues respectively. Juxtaposing the movements of switch I in a complexed state (Fig. 3A) and the holo (Fig. 3A1) shows a more correlated movement of the residues of the complexed switch than the holo as evidenced by the degree of red regions presented. This trend was observed in the comparison of switch II of the complexed state (Fig. 3B) and the holo switch II (Fig. 33B1). Generally, the binding of MRTX1133 presented strong correlated residual movements of Switch I and II than the unbound (holo) over the period of simulation. This is observed from the degree of positive (red) regions depicted by the Fig. 3. This differential observation could influence the switches interaction with effector and regulator proteins thus highlighting the basis of MRTX1133 inhibitory prowess.
Figure 3.
Cross-correlation matrices of the fluctuations of coordinates of C–a atoms of the switches around their mean positions during the 450 ns simulation. DCCM plots of switch I MRTX1133 complex (A), Switch I holo (A1), Switch II MRTX1133 complex (B), and (B1) Switch II holo protein. This indicates MRTX1133 complexing induced a more corelated movement. (C) KRAS structure showing switch I (black) and switch II (red).
Atomistic interactions underscoring the potency of MRTX1133
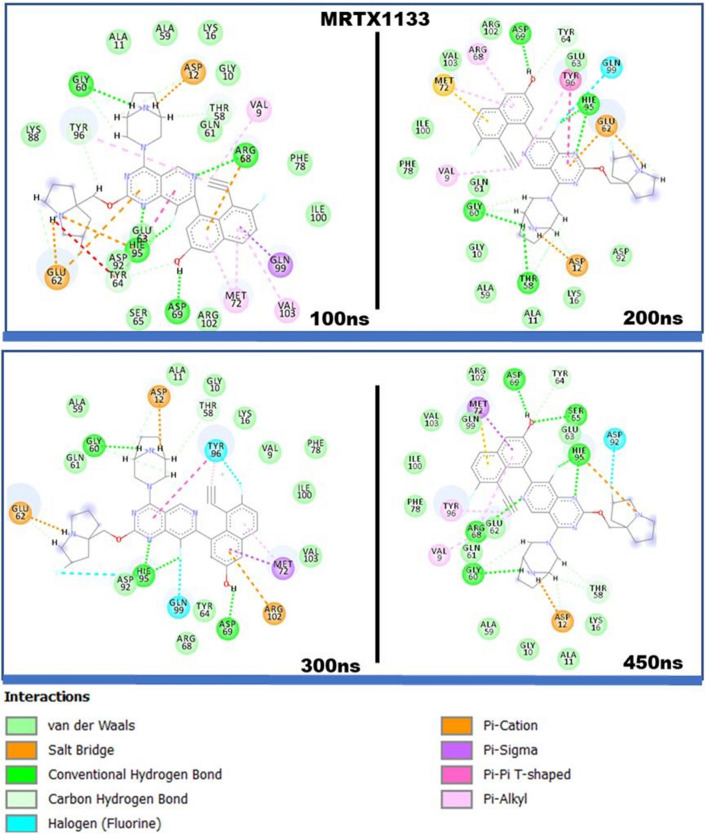
Upon attaining the impact of the binding of MRTX1133 on the structural dynamics of the protein, we further probed at the atomic level to ascertain the underlying interactions that accounts for the observable structural changes. Thus, six snapshots were taken from the 450 ns simulation trajectory for analysis. Trajectories generated during the process of simulation contain events that helps to unravel structural activities and atomistic insights that occurred at a specific time-frame48. Snapshot visualization analysis revealed MRTX1133 formed varied bond types with the binding site residues. While some of these interactions endured though the 450 ns simulations, others were altered during the process as observed in Fig. 4. The sp2 hybridized O atom of Gly60 was observed to form a conventional hydrogen bond with the HNO3 atom of MRTX1133in all the observed snapshots. Asp69 and His 95 were also observed to form an enduring hydrogen bond with the compound. The sp2 hybridized OD1 atom of Asp69 interacted with the H02 atom of MRTX1133, while the HE2 atom of His95 interacted with both the sp2 hybridized NO1 and sp3 hybridized F01 atoms of MRTX1133. Thr58 interacted with the HN03 atom of the compound through the sp2 hybridized O atom, which was observed at 100 ns, 200 ns, and 300 ns. Arg68 was also observed to interact through conventional hydrogen bond through the HH21 atom and the sp2 hybridized N03 atom of MRTX1133 at 200 ns and 300 ns, while Ser65 was observed to interact at only 300 ns through the H atom and the sp3 hybridized O02 atom. To highlight the percentage of time occupied by these interactions in the 450 ns simulation period, the hydrogen bond occupancy was calculated and presented in Table 1. The hydrogen bond occupancy captures hydrogen interactions including those occurred outside the trajectory captured by the snapshots.
Figure 4.
2D interactions of MRTX1133 with KRASG12D binding site residues. Snapshots depicts interactions at 100 ns, 200 ns, 300 ns and 450 ns. MRTX1133 engages in varying interactions.
Table 1.
Dynamic hydrogen bond interactions of MRTX1133 at KRASG12D binding site over the 450 ns MD simulation.
| Compounds | H-acceptor | H-donor | Occupancy (%) | Average distance (Å) |
|---|---|---|---|---|
| MRTX1133 | ASP69-OD1 | MRTX1133-HO02 | 99.7 | 2.59 |
| ASP12-OD1 | MRTX1133-HN02 | 65.4 | 2.80 | |
| GLY60-O | MRTX1133-HN03 | 53.9 | 2.82 | |
| GLU62-OE1 | MRTX1133-H06 | 50.1 | 2.79 | |
| THR58-O | MRTX1133-HN03 | 43.4 | 2.80 | |
| MRTX1133-N01 | HIS95-HE2 | 39.9 | 2.91 | |
| MRTX1133-N03 | ARG68-HH11 | 20.5 | 2.91 | |
| MRTX1133-F01 | GLN99-HE22 | 10.2 | 2.88 | |
| GLU63-O | MRTX1133-H02 | 5.0 | 2.90 | |
| MRTX1133-O02 | SER65-H | 2.5 | 2.74 | |
| MRTX1133-N01 | TYR64-HH | 0.9 | 2.95 | |
| ALA59-O | MRTX1133-HN03 | 0.7 | 2.87 | |
| MRTX1133-N02 | TYR96-HH | 0.5 | 2.83 | |
| MRTX1133-F02 | LYS88-HZ3 | 0.2 | 2.90 |
Thermodynamics of MRTX1133
The binding of a ligand to proteins underpins a variety of recognition processes in biological systems. Among these range of processes is the binding energy which underscores the affinity of the ligand and receptor. The free binding energy therefore provides information on the spontaneity, ligand permeation and reaction kinetics49. The free binding energy profile of MRTX1133 was therefore estimated using the MM-PBSA method as outlined earlier and presented in Table 2. MRTX1133 showed total free binding energy (ΔG) of − 73.16 kcal/mol. This low binding energy is indicative of its spontaneity and permeation in to the hydrophobic core of the protein thus engaging in many interactions with the site residues which result in more release of energy. This observation could therefore explain the low pERK IC50 of 2 nM recorded experimentally for MRTX1133 thus its observed potency. The gas phase, electrostatic and van der Waals interaction were observed as prominent contributors to the total free binding energy.
Table 2.
Binding energy profile of MRTX1133 compounds.
| System | Energy components (kcal/mol) | ||||
|---|---|---|---|---|---|
| KRASG12D-MRTX1133 | − 62.40 ± 4.73 | − 633.03 ± 30.37 | − 695.43 ± 29.75 | 622.27 ± 29.75 | − 73.16 ± 5.15 |
ΔEele = electrostatic energy; ΔEvdW = van der Waals energy; ΔGbind = total binding free energy; ΔGsol = solvation free energy ΔG = gas phase free energy.
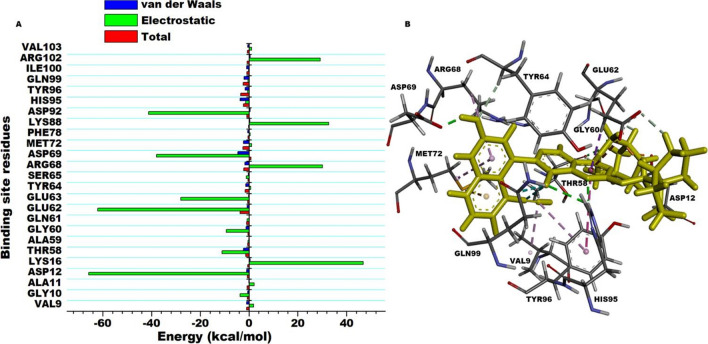
Since the binding interactions between the ligand and the binding site residues is crucial to the quantum of energy released (total free binding energy), we decomposed the total free binding energy into individual residue contributions. This allowed us to identify the residues that individually contributed the most towards the complexing and stability of MRTX1133. The results are presented in Fig. 5. Asp69 (− 4.54 kcal/mol), His95 (− 3.65 kcal/mol), Met72 (− 2.27 kcal/mol), Thr58 (− 2.23 kcal/mol), Gln99 (− 2.03 kcal/mol), Arg68 (− 1.67 kcal/mol), Tyr96 (− 1.59 kcal/mol), Tyr64 (− 1.34 kcal/mol), Gly60 (− 1.25 kcal/mol), Asp12 (− 1.04 kcal/mol), and Val9 (− 1.03 kcal/mol) were observed as residue with prominent contributions. Others include: Ile100 (− 0.98 kcal/mol), Glu62 (− 0.73 kcal/mol), Arg102 (− 0.53 kcal/mol), Gly10 (− 0.50 kcal/mol), Val103 (− 0.48 kcal/mol) and Phe78 (− 0.48 kcal/mol) as depicted in Fig. 4. We therefore monitored these residues interactions with MRTX1133 over 450 ns simulation period to ascertain the functional groups of the ligand they engaged with.
Figure 5.
Per-residue decomposition analysis showing binding site residue energy contributions towards the complexing of MRTX1133. Electrostatic energy featured prominently towards the total free binding energy. (A) Shows the energy plots. (B) Shows the interacting residues.
Pharmacophore model generation
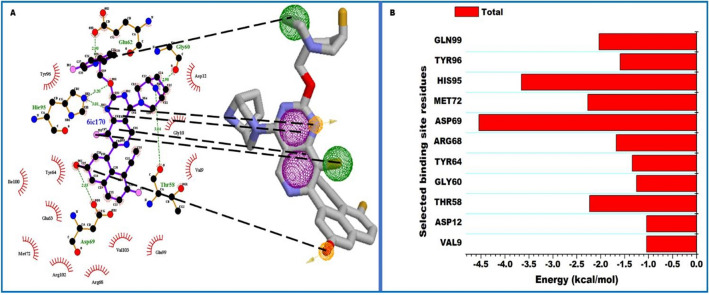
The functional or structural components of a bioactive compound that possess biological activity is often referred to as pharmacophores. These elements define important, steric and electronic function-determining points necessary for an optimal interaction with a pharmacological target, thus they represent a common denominator of a class of compounds that exhibit a similar pharmacological profile and are therefore recognized by the same site of the target protein50. A pharmacophore should therefore satisfy the criterial of interacting with crucial binding site residues. As such, we therefore identified the components of MRTX1133 that interacted with the residues that resulted in high energy contributions as crucial elements for pharmacophore modelling. Per-residue decomposition (PRED)-centered pharmacophore model was therefore generated from the 450 ns simulations performed for MRTX1133. Residues with contributions higher than − 1 kcal/mol to the total free binding energy of MRTX1133as presented above were monitored for the period of simulation to identify functional groups they engaged with. These crucial functional groups on MRTX1133 and their interactions is shown in Fig. 6. The functional groups were then used to create a pharmacophore model for compounds screening in ZINC database.
Figure 6.
A pharmacophore model of MRTX1133. (A) 2D illustration of MRTX1133 interacting with binding site residues after 450 ns MD simulation. (B) The selected pharmacophoric moieties in MRTX1133, which interacted with the most negative energy contributing binding site residues. (C) PRED plot highlighting only the total binding energy contributed by the selected active site residues.
Pharmacophore based virtual screening
The pharmacophore hypothesis generated was used as a 3D structural query with several combinations. The ZINC database was therefore screened for matching compounds. On zincpharmer, the 2 aromatic rings of the pyridopyrimidine, 2 hydrogen acceptors and 4 hydrophobic moieties were selected due to their interaction with the high energy contributing residues. Molecular weight ≤ 500 Da, rotatable bonds ≤ 10 were set as pre-requisite for the generation of ideal hits. A total of 21,777,093 compounds were screened. An initial 200 compounds were retrieved. These hit compounds were then docked into the allosteric binding site occupied by MRTX1133 using PyRx software and the compounds exhibiting high docking scores were further selected. Nineteen (19) compounds were selected and further subjected to docking using GLIDE docking suit incorporated in Schrödinger with an extra precision (XP). Three compounds were then selected from the compounds for further analysis. The results of the compounds are presented in Table 3 and in Table S1.
Table 3.
Summary of binding energy scores obtained from PyRx and Glide XP for the identified top four compounds.
| ZINC Compound ID | Pyrx docking score (kcal/mol) | Glide XP Score (kcal/mol) | 2D Structure |
|---|---|---|---|
| ZINC78453217 | − 10.1 | − 9.77 |

|
| ZINC70875226 | − 10.6 | − 9.34 |

|
| ZINC64890902 | − 9.8 | − 10.0 |

|
| MRTX1133 | − 11.4 | − 10.92 |

|
Hit compound interactions within the binding pocket
After the docking of the compounds, the interactions that characterized their binding was further investigated. The type of interactions exhibited by a compound in the binding site of a protein is crucial in determining it therapeutic influence on the protein51. After docking the selected compounds, we sought to ascertain the interactions that feature between the compounds and the binding site residues. We thus visualized the complexes in comparison to MRTX1133. The known inhibitor, MRTX1133, was observed to engage in differential interactions with the site residues. Key among the interaction types are conventional and carbon hydrogen interactions, pi anon and alkyl interactions, van der Waals and halogen interactions. These interactions between the inhibitor and the residues varied depending on the functional groups. The selected compounds were also observed to interact with the site residues through similar interaction types as presented in Fig. 7.
Figure 7.
2D molecular interactions of MRTX1133 and selected compounds within the binding site of KRAS allosteric binding site. The selected compounds and MRTX1133 show similar interactions with the binding site residues suggesting the selected compounds have the potential to elicit similar therapeutic effects.
Physicochemical properties and drug-likeness of the selected hits
To ascertain information into the drug-likeness of the hit compounds and their pharmacokinetic properties, a comparative analysis between the compounds and MRTX1133 was performed. The physicochemical properties of the three hit compounds and the other selected compounds were evaluated and presented in Tables 4 and S2 respectively. SwissADME, an online server was employed to profile their physicochemical properties.
Table 4.
Physiochemical properties of the top 3 hit compounds relative to MRTX1133.
| Physiochemical properties | Compounds | |||
|---|---|---|---|---|
| ZINC78453217 | ZINC70875226 | ZINC64890902 | MRTX1133 | |
| Formula | C16H20FN3O2 | C19H20N6O3 | C17H19N5O4 | C33H33F3N6O2 |
| MW (g/mol) | 305.35 | 380.40 | 357.36 | 602.65 |
| MLog Po/w | 2.66 | 1.46 | 1.48 | 3.25 |
| LogS (Ali) (mol/L) | − 3.42 | − 3.13 | − 2.71 | − 5.44 |
| Class | Soluble | Soluble | Soluble | Moderately soluble |
| TPSA (A2) | 62.39 | 124.90 | 122.88 | 109.42 |
| Molar Refractivity | 84.32 | 103.55 | 95.39 | 173.75 |
| H-bond acceptors | 6 | 5 | 6 | 8 |
| H-bond donors | 1 | 2 | 2 | 3 |
| Rotatable bonds | 3 | 6 | 6 | 5 |
| Lipinski violations | No; 0 | No; 0 | No; 0 | Yes; 1 |
| Toxicity | ||||
| LD50 (mg/kg) | 1000 | 200 | 649 | 2500 |
| Toxicity class | 4 | 3 | 4 | 5 |
aHBD = number of hydrogen bond donors (HBD ≤ 5); HBA = number of hydrogen bond donors (HBD ≤ 10); TPSA = total polar surface area; MLOGP = predicted octanol/water partition coefficient (MLOGP < 4.15); MW = molecular weight (g/mol) (MW ≤ 500); Rotatable bonds ≤ 8; TPSA = Topological polar surface area (≤ 140).
Generally, an increase in the molecular weight of a therapeutic agent reduces its concentration at the intestinal epithelial surface and hence decreases absorption52. Studies have, therefore, reported that this could prevent passive diffusion of the agent across the bilayer membrane. Thus, it is suggested that the molecular weight of drug candidates should be less than 500 g/mol in accordance with the Lipinski’s rule of five (RO5)53,54. The selected compounds together with the hits all possessed molecular weight within the acceptable range for drug-like molecules as presented in Tables 4 and S2. Interestingly, these compounds outscored MRTX1133 regarding the molecular weight suggesting they would possess better intestinal absorption and cellular uptake.
Also, to determine the impact of molecular weight on bioactivity is the number of rotatable bonds, an excellent definition of molecular flexibility55 (Lu et al. 2004). Verber et al.56 reported that the number of rotatable bonds increases with an increase in molecular weight. According to the Lipinski’s RO5, the number of rotatable bonds of a drug-like compound should be less than 10; this enhances absorption and bioavailability55,57,58. As observed from our evaluation, all the compound possessed rotatable bonds below 10 including MRTX1133 which possessed 5 rotatable bonds. LogP is the logarithm of the coefficient of chemical compounds’ permeation across n-octanol and water (Coctanol/Cwater) and thus estimates the hydrophilicity of chemical compounds59. High MLogP figure depicts a reduction in aqueous solubility and this could result in reduction of compound absorption. The hit compounds all showed lower MLogP values lower than MRTX1133 (Table 4). Again, LogS which is indicative of membrane permeability was used to evaluate the aqueous solubility of the selected and hit compounds in comparison to MRTX1133. An acceptable range of 0 to − 6 for aqueous solubility accounts for 95% of approved drugs60. The compounds all fell within the acceptable range and are therefore classified as soluble while MRTX1133 was classified as moderately soluble.
The topological polar surface area (TPSA) strings the oxygen and nitrogen (surface polar atoms) in relation with the hydrogen atoms that are attached in a compound. It helps in determining the potential of a compound to traverse the cells wherein a low TPSA value depicts the compound can permeate the cell61,62. It also offers information on the volume and molecular size which controls a compound’s physiological transport across the lipid bilayer including the blood–brain barrier (BBB) and gastrointestinal tract (GIT)63. Elevated TPSA has been reported to interfere with the transportability of potential drugs which therefore reduces their bioactivity64. As presented in Table 3, two compounds, ZINC70875226 and ZINC64890902 exhibited TPSA values higher than MRTX1133 whiles ZINC78453217exhibited the least. All compounds however fell well with the acceptable range of TPSA of ≤ 140 Å2.
Hydrogen bond (HB) is one of the key factors that have been suggested to influence the solubility of therapeutic agents since they have to be severed to accelerate the transportation of the agents across the lipid bilayer membrane65. Therefore, a high number of HB affects permeation by passive diffusion as a result of the reduction in partitioning from the aqueous environment into the lipid bilayer membrane. Hydrogen bond acceptors (HBA) and hydrogen bond donors (HBD) are therefore indicators of hydrogen bonding of a compound. According to the Lipinski’s RO5, drug-like compounds should possess HBA ≤ 10 and HBD of ≤ 5 as the basis for oral bioavailability and activity52. The results computed in Tables 4 and S2 shows that all selected and hit compounds qualify for adequate hydrogen bond acceptance and donation.
Impact of hit compounds on the conformational dynamics of KRASG12D
The three hit compounds identified from the zinc database were further subjected to verification through molecular dynamics simulations. The four compounds were simulated for a period of 450 ns to reveal possible molecular events that underscore their binding to KRASG12D. Unlike molecular docking that only proffer analysis on static complexes, molecular dynamics provides the opportunity to assess the events of the complexes over a period of time mimicking real-life situations. The complexes involving the compounds; ZINC78453217, ZINC70875226, and ZINC64890902 were therefore simulated. The compounds stability within the binding site and their permeation into the hydrophobic core of the protein together with their impact on the stability of the binding site as well as the global conformation dynamics of KRASG12D upon ligation were investigated.
Hit compounds penetrates deeper into the hydrophobic core of KRASG12D with resultant stability
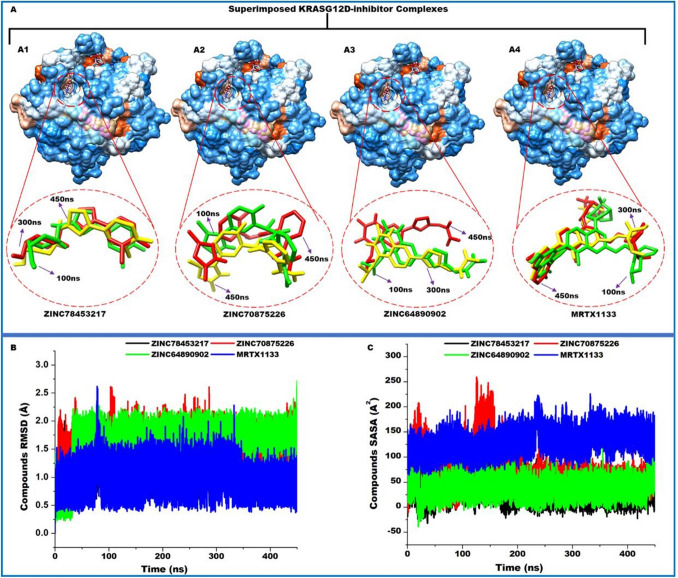
The solvent accessibility surface area (SASA) of the compounds was evaluated to ascertain the surface area available for aqueous interaction during the simulation period. This information provides insights into the level of penetration of the compounds into the hydrophobic core of the protein66. Deeper penetration will therefore decrease the surface area availability of the compounds and vice versa. The compounds presented average SASA values of 34.89 ± 15.37A2, 75.48 ± 36.56A2, and 128.08 ± 39.10A2 for ZINC78453217, ZINC70875226, and ZINC64890902 respectively. These results depict ZINC78453217 penetrated deeper into the hydrophobic core compared to the other compounds since it presented the least available solvent accessible surface area. Binding and permeation of a compound to a protein is conditioned by intermolecular interactions which consequently influences the stability of the compound within the binding pocket. As such, the stability of the compounds was estimated. The root mean-square deviation matric was utilized to compute the atomic deviations of the compounds during the 450 ns period of simulation. This matric is informative on the extent to which atomic positions vary over time which is indicative of the stability of the compounds. The compounds exhibited average RMSD values of 1.25 ± 0.17 Å, 1.55 ± 0.20 Å, and 1.84 ± 0.28 Å for ZINC78453217, ZINC70875226, and ZINC64890902 respectively while MRTX1133 presented 0.97 ± 0.12 Å. These results indicate general stability of the compounds within the binding site. As observed from the values and Fig. 8, ZINC78453217 which exhibited the least SASA, is the most stable among the hit compounds suggesting it could possess higher therapeutic potentials. Afterwards we sought to determine the impact of these compounds on the binding pocket.
Figure 8.
(A) Superimposition of KRASG12D complexed with ZINC78453217, ZINC70875226, ZINC64890902 and MRTX1133. Insert shows the binding orientation of each inhibitor at 100 ns, 300 ns, and 450 ns. (B) Comparative inhibitor stability plots using RMSD metrics for ZINC78453217, ZINC70875226, ZINC64890902 and MRTX1133. (C) Comparative inhibitor SASA plots of ZINC78453217, ZINC70875226, ZINC64890902 and MRTX1133.
The differential positioning and stability of the compounds relative to MRTX1133 was further ascertained by conducting the PCA of the compounds. We clustered the compounds movements in the direction of two principal components: PC1 and PC2. From this computation presented in Fig. 9, it is observed that the motions of ZINC64890902 over the simulation period is more dispersed than the other compounds including MRTX1133. ZINC78453217 was observed to display more compact motion during the simulation period while ZINC70875226 showed moderate dispersed motion relative MRTX1133. The compact motion exhibited by ZINC78453217 among the selected compounds corroborates with the RMSD and SASA findings wherein it showed the most stable with the least exposure to solvent environment among the compounds.
Figure 9.
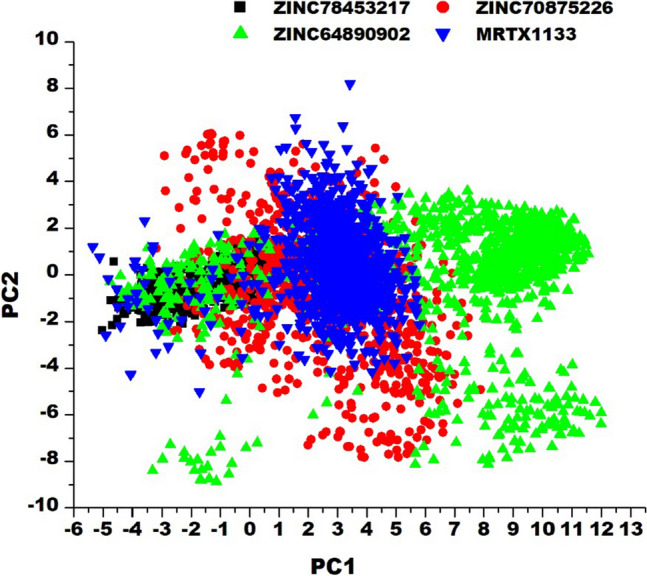
Principal component analysis of the motions of the selected compounds at the allosteric binding site of KRASG12D.
Hit compounds disrupt binding site conformations
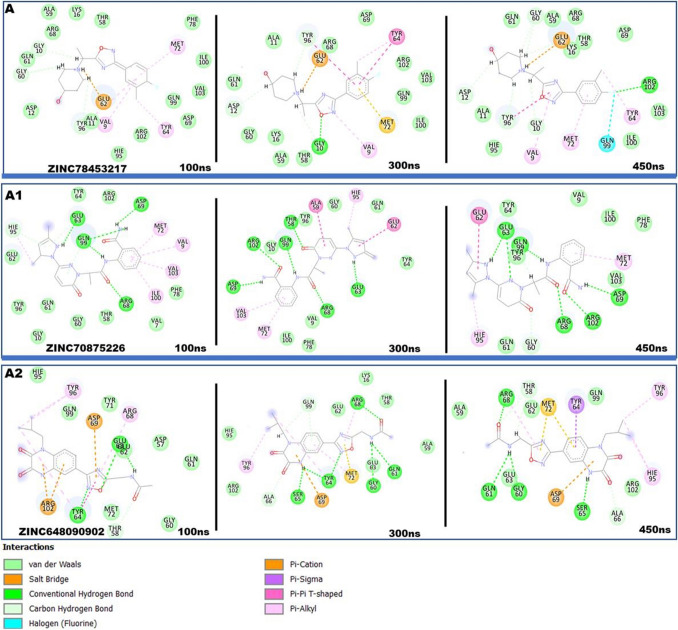
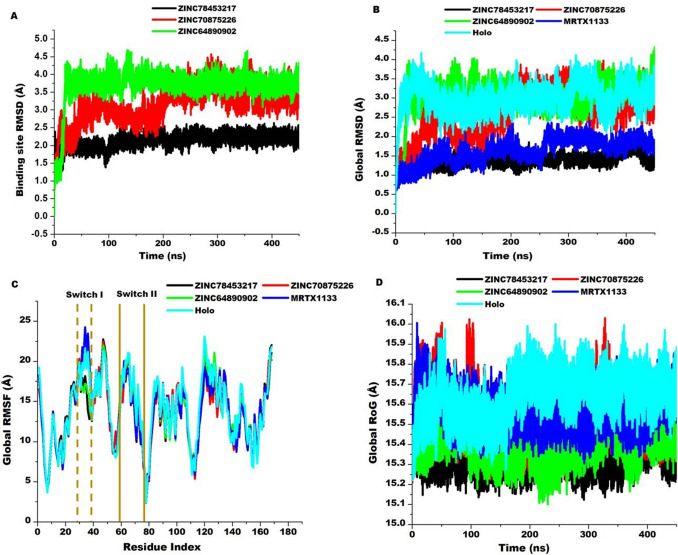
The inhibitory or activation ability of bioactive compounds is often underscored by conformational changes they induce on the target protein. Conformational changes beyond or below a certain threshold result in the disruption of the basal functionalities of the protein67. Thus, this phenomenon has been exploited by drug developers to contain certain abnormal protein activities. The effect of the compounds on the binding site of KRASG12D was therefore evaluated. Effects of compounds on the binding site and on the protein as a whole is often underscored by interactions that characterize the compound’s binding. We, therefore, visualized snapshots from the simulation and the results presented in Fig. 10. This revealed the compounds engaged in varying interaction types during the course of simulation. The RMSD of the C–α atoms of the binding site residues were determined. As Fig. 11 discloses, the compounds exhibited varying effects on the binding site. They presented average values of 2.12 ± 0.18 Å, 3.16 ± 0.48 Å, and 3.69 ± 0.46 Å, for ZINC78453217, ZINC70875226, and ZINC64890902, respectively. ZINC78453217 induced a stable binding site comparatively below MRTX1133 and the holo (Fig. 2) whiles the other compounds destabilized the binding site beyond the holo. These observations suggest the compounds elicit bioactivity on the KRASG12D binding pocket and therefore suggests their potentials as therapeutic agents.
Figure 10.
2D interactions of hit compounds with KRASG12D binding site residues. Snapshots depicts interactions at 100 ns, 200 ns, 300 ns and 450 ns. (A) Shows ZINC78453217 interactions with the binding site residues. (A1) Shows ZINC70875226 interaction with the binding site residues. (A2) Shows ZINC64890902 interactions with the binding site interactions.
Figure 11.
Comparative RMSD, RMSF and RoG plots of the hit compounds, MRTX1133 and unbound (holo) KRASG12D protein. (A) Shows the binding site RMSD elicited by the binding of the hit compounds. (B) Depicts the global stability of KRASG12D upon compounds binding. (C) Shows the residual fluctuations exhibited by the global protein residues during the simulation period. Highlights (deep yellow) show the switches regions. (D) Shows the RoG exhibited by the global protein. The bound conformations are contrasted to the unbound (Holo).
Hit compounds induces global stability with reduced flexibility of KRASG12D
Proteins are sensitive to external stimuli and thus in most instances react through global conformational changes. These changes as earlier stated could influence the normal functions of the proteins. We, therefore, sought to determine the impact of the hit compounds on the entire KRASG12D through estimating the stability, flexibility and compactness. These was achieved through estimating the RMSD, the root mean-square fluctuation (RMSF) and the radius of gyration (RoG) of the C–α atoms of the protein over the 450 ns simulation period. While, the RMSD is informative of the general stability and system convergence over the period of simulation and therefore expresses the confidence in the ensuing deductions, the RMSF discloses the flexibility of the protein while RoG expresses the compactness of the protein. Higher RMSF values indicate more flexibility and vice versa while high RoG values indicate less compactness. As presented in Fig. 9, the systems presented average RMSD values of 1.38 ± 0.14 Å, 2.65 ± 0.56 Å, 3.00 ± 0.46 Å, 1.64 ± 0.13 Å and 3.46 ± 0.49 Å for the ZINC78453217, ZINC70875226, ZINC64890902, MRTX1133 and the holo respectively. The highest stability of the protein was observed with when ZINC78453217 was bound. This compound stabilized the protein below MRTX1133. Generally, the compounds induced elevated stability of the protein relative to the unbound. Probing the flexibility of KRASG12D showed a general reduction in the flexibility of the residues during the simulation period. Average RMSF values of 13.52 ± 4.05 Å, 13.65 ± 4.16 Å, 13.93 ± 4.33 Å, 13.73 ± 4.11 Å and 14.11 ± 4.36 Å for ZINC78453217, ZINC70875226, ZINC64890902, MRTX1133 and the holo protein, respectively. Zoning into the fluctuations that characterized the switches upon complexing with the compounds revealed ZINC78453217 and ZINC64890902 induced a reduction switch I residues fluctuations relative to the unbound. The other compounds together with MRTX1133 increased switch I fluctuation beyond the unbound. All the compounds however, reduced the fluctuations of Switch II residues below the unbound. The RoG also presented a similar trend of global protein behavior with the RMSF. A general reduction in the RoG values relative to the unbound was observed as presented in Fig. 11. This reduction indicates increased compactness and rigidity of KRASG12D upon the compounds binding corroborating the reduced fluctuations of the residues. Average RoG values of 15.34 ± 0.05 Å, 15.52 ± 0.11 Å, 15.40 ± 0.07 Å, 15.58 ± 0.08 Å, and 15.64 ± 0.10 Å for ZINC78453217, ZINC70875226, ZINC64890902, MRTX1133 and holo protein respectively.
Binding energy landscape of hit compounds
The binding energy profile of the hit compounds were evaluated using the MM-PBSA method due to its popularity68. The binding energies are pivotal to ligand–protein complexing by disclosing the spontaneity, folding, permeation and kinetic reactions of the ligation process50. Higher binding affinity (most negative) indicates the strength of interactions involved in the ligation and thus reveals the potency of the compound. The hit compounds’ energy profiles were therefore determined and presented in Table 5. Average total binding free energies (ΔG) of − 38.69 ± 2.76 kcal/mol, − 41.80 ± 7.67 kcal/mol, and − 35.24 ± 3.99 kcal/mol were estimated for ZINC78453217, ZINC70875226 and ZINC64890902 respectively.
Table 5.
Binding energy profile of hit compounds.
| System | Energy components (kcal/mol) | ||||
|---|---|---|---|---|---|
| ZINC78453217 | − 41.23 ± 2.79 | − 296.46 ± 12.51 | − 337.69 ± 11.97 | 301.93 ± 11.97 | − 35.76 ± 3.14 |
| ZINC70875226 | − 47.00 ± 5.87 | − 41.62 ± 9.77 | − 88.62 ± 13.51 | 46.82 ± 7.17 | − 41.80 ± 7.67 |
| ZINC64890902 | − 40.35 ± 2.76 | − 262.97 ± 24.03 | − 303.33 ± 23.81 | 268.09 ± 21.92 | − 35.24 ± 3.99 |
ΔEele = electrostatic energy; ΔEvdW = van der Waals energy; ΔGbind = total binding free energy; ΔGsol = solvation free energy ΔG = gas phase free energy.
These results suggest spontaneous compounds complexing with KRASG12D with ZINC70875226 showing the highest energy. The variations in the binding free energies presented by the compounds could be due to the type of interactions that accompany their binding. Though these compounds generally presented lower total free binding energies compared to MRTX1133, nonetheless their impact on the protein indicates they elicit bioactive potentials and could therefore be optimized to improve their activity. Contributing significantly to the total free binding energies are electrostatic, van der Waals and the gas phase energies.
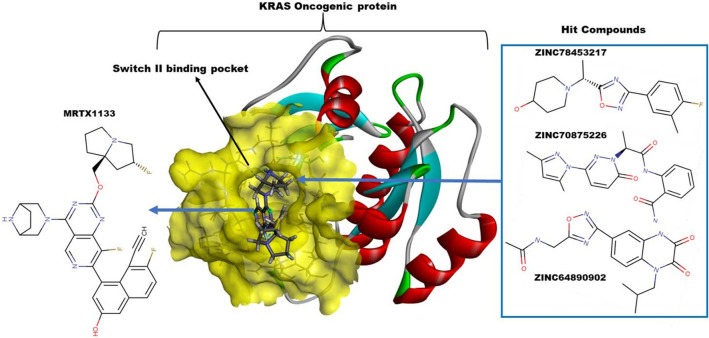
To summarize the entire study, ZINC78453217, ZINC70875226 and ZINC64890902 are identified as the most promising inhibitors of KRASG12D (Fig. 12).
Figure 12.
Most promising inhibitors of KRASG12D.
Conclusion
Oncogenic KRAS has eluded drug developers for decades until covalent inhibition was strategically employed to target the mutated cysteine within the switch II binding pocket. Though this has achieved some success, cancers driven by other mutations has not been successful. The development of MRTX1133 to target KRASG12D has therefore been a sign of relief. In our quest to unravel the molecular events that highlight its potentials to inhibit KRASG12D as well as identify potential inhibitors based on its structural characteristics through PRED, we employed MD simulations and other computational techniques. The 450 ns simulation of MRTX1133 in complex with KRASG12D revealed MRTX1133 binding stabilized the binding site with a consequential reduction in the surface area of the site available for aqueous interaction. These changes resulted in a strong positive correlated movement of switch I and II which could disrupt KRASG12D interaction with effector and regulatory proteins. Again, the MRTX1133 was shown to exhibit strong binding affinity (− 73.16 ± 5.15 kcal/mol) with KRASG12D corroborating experimental findings. This energy was then decomposed into individual residue contributions revealing Asp69, His95, Met72, Tyr64, Gly60, Asp12 and Val9 contributed the highest towards the binding energy. A pharmacophore was subsequently developed based on the prominent moieties of MRTX1133 that the high-energy contributing residues interacted. The pharmacophore model was then employed to screen the ZINC database towards identifying potential KRASG12D binders. Through molecular docking, MD simulation and ADMET analysis, ZINC78453217, ZINC70875226 and ZINC64890902 were identified as the most promising binders of KRASG12D. Further structural analysis through MD simulation showed the identified compounds particularly ZINC78453217 exhibited similar impact on KRASG12D through the stabilization of the global protein, reduction in flexibility and increase in compactness of the global protein. The successful application of multidisciplinary computational drug discovery approaches has allowed the identification of diverse potential therapeutic agents laying the ground work for experimental exploration of the suggested compounds. Further optimisations and validation of these compounds could aid in the discovery of effective KRASG12D inhibitors.
Supplementary Information
Acknowledgements
Authors wish to acknowledge the Centre for High Performance Computing, Cape Town, South Africa for providing computational resources.
Author contributions
Conceptualization: A.R.I., N.M., C.A., and M.R.; methodology: A.R.I., N.M., C.A., and M.R.; data curation: A.R.I., N.M., and C.A.; formal analysis: A.R.I., N.M., and M.R.; data analysis: A.R.I. and C.A.; investigation: S.M.A., S.G.A., and J.K.; project administration: A.R.I. and M.R.; resources: A.R.I., N.M., C.A., and M.R.; original draft: A.R.I. and N.M.; writing—review and editing: A.R.I., N.M., M.R., and J.K.; funding acquisition: S.M.A., S.G.A., and J.K. All authors read and approved the final version of the manuscript.
Data availability
All data generated or analyzed during this study are included in this published article [and its supplementary information files].
Competing interests
The authors declare no competing interests.
Footnotes
Publisher's note
Springer Nature remains neutral with regard to jurisdictional claims in published maps and institutional affiliations.
Supplementary Information
The online version contains supplementary material available at 10.1038/s41598-022-22668-1.
References
- 1.Huang L, et al. KRAS mutation: From undruggable to druggable in cancer. Signal Transduct. Target Therapy. 2021;6(1):1–20. doi: 10.1038/s41392-021-00780-4. [DOI] [PMC free article] [PubMed] [Google Scholar]
- 2.Herdeis L, et al. Stopping the beating heart of cancer: KRAS reviewed. Curr. Opin. Struct. Biol. 2021;71:136–147. doi: 10.1016/j.sbi.2021.06.013. [DOI] [PubMed] [Google Scholar]
- 3.Gounder MM, et al. Sorafenib for advanced and refractory desmoid tumors. N. Engl. J. Med. 2018;379:2417–2428. doi: 10.1056/NEJMoa1805052. [DOI] [PMC free article] [PubMed] [Google Scholar]
- 4.Soria J-C, et al. Osimertinib in untreated EGFR-mutated advanced non-small-cell lung cancer. N. Engl. J. Med. 2018;378:113–125. doi: 10.1056/NEJMoa1713137. [DOI] [PubMed] [Google Scholar]
- 5.Cox AD, et al. Drugging the undruggable RAS: Mission possible? Nat. Rev. Drug Discov. 2014;13:828–851. doi: 10.1038/nrd4389. [DOI] [PMC free article] [PubMed] [Google Scholar]
- 6.Simanshu DK, Nissley DV, McCormick F. RAS proteins and their regulators in human disease. Cell. 2017;170:17–33. doi: 10.1016/j.cell.2017.06.009. [DOI] [PMC free article] [PubMed] [Google Scholar]
- 7.Sprang SR. G proteins, effectors and GAPs: Structure and mechanism. Curr. Opin. Struct. Biol. 1997;7:849–856. doi: 10.1016/S0959-440X(97)80157-1. [DOI] [PubMed] [Google Scholar]
- 8.Cherfils J, Zeghouf M. Regulation of small GTPases by GEFs, GAPs, and GDIs. Physiol. Rev. 2013;93:269–309. doi: 10.1152/physrev.00003.2012. [DOI] [PubMed] [Google Scholar]
- 9.Wittinghofer A, Pai EF. The structure of Ras protein: A model for a universal molecular switch. Trends Biochem. Sci. 1991;16:382–387. doi: 10.1016/0968-0004(91)90156-p. [DOI] [PubMed] [Google Scholar]
- 10.Bourne HR, Sanders DA, McCormick F. The GTPase superfamily: A conserved switch for diverse cell functions. Nature. 1990;348:125–132. doi: 10.1038/348125a0. [DOI] [PubMed] [Google Scholar]
- 11.Downward J. Targeting RAS signalling pathways in cancer therapy. Nat. Rev. Cancer. 2003;3:11–22. doi: 10.1038/nrc969. [DOI] [PubMed] [Google Scholar]
- 12.Hunter JC, et al. Biochemical and structural analysis of common cancer-associated KRAS mutations. Mol. Cancer Res. 2015;13:1325–1335. doi: 10.1158/1541-7786.MCR-15-0203. [DOI] [PubMed] [Google Scholar]
- 13.Ostrem JML, Shokat KM. Direct small-molecule inhibitors of KRAS: From structural insights to mechanism-based design. Nat. Rev. Drug Discov. 2016;15:771–785. doi: 10.1038/nrd.2016.139. [DOI] [PubMed] [Google Scholar]
- 14.Wood KW, et al. ras mediates nerve growth factor receptor modulation of three signal-transducing protein kinases: MAP kinase, Raf-1, and RSK. Cell. 1992;68:1041–1050. doi: 10.1016/0092-8674(92)90076-o. [DOI] [PubMed] [Google Scholar]
- 15.Hofer F, et al. Activated Ras interacts with the Ral guanine nucleotide dissociation stimulator’. Proc. Natl. Acad. Sci. U.S.A. 1994;91:11089–11093. doi: 10.1073/pnas.91.23.11089. [DOI] [PMC free article] [PubMed] [Google Scholar]
- 16.Brunn GJ, et al. Direct inhibition of the signaling functions of the mammalian target of rapamycin by the phosphoinositide 3-kinase inhibitors, wortmannin and LY294002. EMBO J. 1996;15:5256–5267. doi: 10.1002/j.1460-2075.1996.tb00911.x. [DOI] [PMC free article] [PubMed] [Google Scholar]
- 17.Hamarsheh S, et al. Immune modulatory effects of oncogenic KRAS in cancer. Nat. Commun. 2020;11:5439. doi: 10.1038/s41467-020-19288-6. [DOI] [PMC free article] [PubMed] [Google Scholar]
- 18.Prior IA, Hood FE, Hartley JL. The frequency of Ras mutations in cancer. Can. Res. 2020;80:2969–2974. doi: 10.1158/0008-5472.CAN-19-3682. [DOI] [PMC free article] [PubMed] [Google Scholar]
- 19.Dunnett-Kane V, et al. Mechanisms of resistance to krasg12c inhibitors. Cancers. 2021;13:1–14. doi: 10.3390/cancers13010151. [DOI] [PMC free article] [PubMed] [Google Scholar]
- 20.Fell J, et al. Discovery of Tetrahydropyridopyrimidines as Irreversible Covalent Inhibitors of KRAS-G12C with In Vivo Activity. ACS Med. Chem. Lett. 2018 doi: 10.1021/acsmedchemlett.8b00382. [DOI] [PMC free article] [PubMed] [Google Scholar]
- 21.Nagasaka M, et al. KRAS G12C game of Thrones, which direct KRAS inhibitor will claim the iron throne? Cancer Treat. Rev. 2020;84:101974. doi: 10.1016/j.ctrv.2020.101974. [DOI] [PMC free article] [PubMed] [Google Scholar]
- 22.Maurer T, et al. Small-molecule ligands bind to a distinct pocket in Ras and inhibit SOS-mediated nucleotide exchange activity. Proc. Natl. Acad. Sci. U.S.A. 2012;109(14):5299–5304. doi: 10.1073/pnas.1116510109. [DOI] [PMC free article] [PubMed] [Google Scholar]
- 23.Sun Q, et al. Discovery of small molecules that bind to K-Ras and inhibit Sos-mediated activation. Angew. Chem. Int. Ed. Engl. 2012;51:6140–6143. doi: 10.1002/anie.201201358. [DOI] [PMC free article] [PubMed] [Google Scholar]
- 24.Kessler D, et al. Drugging all RAS isoforms with one pocket. Future Med. Chem. 2020;12:1911–1923. doi: 10.4155/fmc-2020-0221. [DOI] [PubMed] [Google Scholar]
- 25.Wang X, et al. Identification of MRTX1133, a noncovalent, potent, and selective KRASG12D inhibitor. J. Med. Chem. 2022;65:3123–3133. doi: 10.1021/acs.jmedchem.1c01688. [DOI] [PubMed] [Google Scholar]
- 26.Berman HM, et al. The protein data bank. Nuclic Acids Res. 2000;28:235–242. doi: 10.1093/nar/28.1.235. [DOI] [PMC free article] [PubMed] [Google Scholar]
- 27.Pettersen EF, et al. UCSF Chimera - A visualization system for exploratory research and analysis. J. Comput. Chem. 2004;25:1605–1612. doi: 10.1002/jcc.20084. [DOI] [PubMed] [Google Scholar]
- 28.Case, D. A. et al. ‘Amber 18’ (2018).
- 29.Maier JA, et al. ff14SB: Improving the accuracy of protein side chain and backbone parameters from ff99SB. J. Chem. Theory Comput. 2015;11:3696–3713. doi: 10.1021/acs.jctc.5b00255. [DOI] [PMC free article] [PubMed] [Google Scholar]
- 30.Larini L, Mannella R, Leporini D. Langevin stabilization of molecular-dynamics simulations of polymers by means of quasisymplectic algorithms. J. Chem. Phys. 2007;126:104101. doi: 10.1063/1.2464095. [DOI] [PubMed] [Google Scholar]
- 31.Gonnet P. P-SHAKE: A quadratically convergent SHAKE in O (n2) J. Comput. Phys. 2007;220:740–750. doi: 10.1016/j.jcp.2006.05.032. [DOI] [Google Scholar]
- 32.Roe DR, Cheatham TE. PTRAJ and CPPTRAJ: Software for processing and analysis of molecular dynamics trajectory data. J. Chem. Theory Comput. 2013;9:3084–3095. doi: 10.1021/ct400341p. [DOI] [PubMed] [Google Scholar]
- 33.Seifert E. OriginPro 9.1: Scientific data analysis and graphing software—software review. J. Chem. Inf. Model. 2014;54:1552–1552. doi: 10.1021/ci500161d. [DOI] [PubMed] [Google Scholar]
- 34.Rudrapal M, et al. In silico screening of phytopolyphenolics for the identification of bioactive compounds as novel protease inhibitors effective against SARS-CoV-2. J. Biomol. Struct. Dyn. 2021 doi: 10.1080/07391102.2021.1944909. [DOI] [PubMed] [Google Scholar]
- 35.Miller BR, et al. MMPBSA. py: An Efficient program for end-state free energy calculations. J. Chem. Theory Comput. 2012;8:3314–3321. doi: 10.1021/ct300418h. [DOI] [PubMed] [Google Scholar]
- 36.Koes DR, Camacho CJ. ZINCPharmer: Pharmacophore search of the ZINC database’. Nucleic Acids Res. 2012;40:409–414. doi: 10.1093/nar/gks378. [DOI] [PMC free article] [PubMed] [Google Scholar]
- 37.Dallakyan S, Olson AJ. Small-molecule library screening by docking with PyRx’. Methods Mol. Biol. 2015;1263:243–250. doi: 10.1007/978-1-4939-2269-7_19. [DOI] [PubMed] [Google Scholar]
- 38.Repasky MP, Shelley M, Friesner RA. Flexible ligand docking with Glide. Curr. Protoc. Bioinf. 2007 doi: 10.1002/0471250953.bi0812s18. [DOI] [PubMed] [Google Scholar]
- 39.Roos K, et al. OPLS3e: Extending force field coverage for drug-like small molecules. J. Chem. Theory Comput. 2019;15:1863–1874. doi: 10.1021/acs.jctc.8b01026. [DOI] [PubMed] [Google Scholar]
- 40.Daina A, Michielin O, Zoete V. SwissADME: A free web tool to evaluate pharmacokinetics, drug-likeness and medicinal chemistry friendliness of small molecules’. Sci. Rep. 2017;7:1–13. doi: 10.1038/srep42717. [DOI] [PMC free article] [PubMed] [Google Scholar]
- 41.Banerjee P, et al. ProTox-II: A webserver for the prediction of toxicity of chemicals. Nucleic Acids Res. 2018;46:W257–W263. doi: 10.1093/nar/gky318. [DOI] [PMC free article] [PubMed] [Google Scholar]
- 42.Drwal MN, et al. ProTox: A web server for the in silico prediction of rodent oral toxicity. Nucleic Acids Res. 2014;42:53–58. doi: 10.1093/nar/gku401. [DOI] [PMC free article] [PubMed] [Google Scholar]
- 43.Banerjee P, Dehnbostel FO, Preissner R. Prediction is a balancing act: Importance of sampling methods to balance sensitivity and specificity of predictive models based on imbalanced chemical data sets. Front. Chem. 2018 doi: 10.3389/fchem.2018.0036. [DOI] [PMC free article] [PubMed] [Google Scholar]
- 44.Pantsar T. The current understanding of KRAS protein structure and dynamics. Comput. Struct. Biotechnol. J. 2020;18:189–198. doi: 10.1016/j.csbj.2019.12.004. [DOI] [PMC free article] [PubMed] [Google Scholar]
- 45.Li Y, Han L, Zhang Z. Understanding the influence of AMG 510 on the structure of KRASG12C empowered by molecular dynamics simulation. Comput. Struct. Biotechnol. J. 2022;20:1056–1067. doi: 10.1016/j.csbj.2022.02.018. [DOI] [PMC free article] [PubMed] [Google Scholar]
- 46.Gasper R, Wittinghofer F. The Ras switch in structural and historical perspective. Biol. Chem. 2019;401:143–163. doi: 10.1515/hsz-2019-0330. [DOI] [PubMed] [Google Scholar]
- 47.Karyagina A, et al. Analysis of conserved hydrophobic cores in proteins and supramolecular complexes. J. Bioinform. Comput. Biol. 2006;4:357–372. doi: 10.1142/S0219720006001837. [DOI] [PubMed] [Google Scholar]
- 48.Likhachev IV, Balabaev NK, Galzitskaya OV. Available instruments for analyzing molecular dynamics trajectories. Open Biochem. J. 2016;10:1–11. doi: 10.2174/1874091X01610010001. [DOI] [PMC free article] [PubMed] [Google Scholar]
- 49.Raha K, Merz KM. Calculating binding free energy in protein-ligand interaction. Ann. Rep. Comput. Chem. 2005;1:113–130. doi: 10.1016/S1574-1400(05)01009-1. [DOI] [Google Scholar]
- 50.Wermuth CG, et al. Glossary of terms used in medicinal chemistry (IUPAC Recommendations 1998) Pure Appl. Chem. 1998;70:1129–1143. doi: 10.1351/pac199870051129. [DOI] [Google Scholar]
- 51.Durrant JD, McCammon JA. Molecular dynamics simulations and drug discovery. BMC Biol. 2011;9:71. doi: 10.1186/1741-7007-9-71. [DOI] [PMC free article] [PubMed] [Google Scholar]
- 52.Renukuntla J, et al. Approaches for enhancing oral bioavailability of peptides and proteins. Int. J. Pharm. 2013;447:75–93. doi: 10.1016/j.ijpharm.2013.02.030. [DOI] [PMC free article] [PubMed] [Google Scholar]
- 53.Lipinski CA, et al. Experimental and computational approaches to estimate solubility and permeability in drug discovery and development settings. Adv. Drug Deliv. Rev. 2001;46:3–26. doi: 10.1016/s0169-409x(00)00129-0. [DOI] [PubMed] [Google Scholar]
- 54.Omran Z, Rauch C. Acid-mediated Lipinski’s second rule: Application to drug design and targeting in cancer. Eur. Biophys. J. 2014;43:199–206. doi: 10.1007/s00249-014-0953-1. [DOI] [PMC free article] [PubMed] [Google Scholar]
- 55.Lu J, et al. Influence of molecular flexibility and polar surface area metrics on oral bioavailability in the rat. J. Med. Chem. 2004;47:6104–6107. doi: 10.1021/jm0306529. [DOI] [PubMed] [Google Scholar]
- 56.Veber D, et al. Molecular properties that influence the oral bioavailability of drug candidates. J. Med. Chem. 2002;45:2615–2623. doi: 10.1021/jm020017n. [DOI] [PubMed] [Google Scholar]
- 57.Di L, Kerns EH, Carter GT. Drug-like property concepts in pharmaceutical design. Curr. Pharm. Des. 2009;15:2184–2194. doi: 10.2174/138161209788682479. [DOI] [PubMed] [Google Scholar]
- 58.Vallianatou T, Giaginis C, Tsantili-Kakoulidou A. The impact of physicochemical and molecular properties in drug design: Navigation in the “drug-like” chemical space. Adv. Exp. Med. Biol. 2015;822:187–194. doi: 10.1007/978-3-319-08927-0_21. [DOI] [PubMed] [Google Scholar]
- 59.Lipinski CA. Drug-like properties and the causes of poor solubility and poor permeability. J. Pharmacol. Toxicol. Methods. 2000;44:235–249. doi: 10.1016/s1056-8719(00)00107-6. [DOI] [PubMed] [Google Scholar]
- 60.Wang J, Hou T. Recent advances on aqueous solubility prediction. Comb. Chem. High Throughput Screen. 2011;14:328–338. doi: 10.2174/138620711795508331. [DOI] [PubMed] [Google Scholar]
- 61.Ertl P, Rohde B, Selzer P. Fast calculation of molecular polar surface area as a sum of fragment-based contributions and its application to the prediction of drug transport properties. J. Med. Chem. 2000;43:3714–3717. doi: 10.1021/jm000942e. [DOI] [PubMed] [Google Scholar]
- 62.Prasanna S, Doerksen RJ. Topological polar surface area: A useful descriptor in 2D-QSAR. Curr. Med. Chem. 2009;16:21–41. doi: 10.2174/092986709787002817. [DOI] [PMC free article] [PubMed] [Google Scholar]
- 63.Shityakov S, et al. Analysing molecular polar surface descriptors to predict blood-brain barrier permeation. Int. J. Comput. Biol. Drug Des. 2013;6:146–156. doi: 10.1504/IJCBDD.2013.052195. [DOI] [PubMed] [Google Scholar]
- 64.Daga PR, et al. Physiologically based pharmacokinetic modeling in lead optimization. 2. Rational bioavailability design by global sensitivity analysis to identify properties affecting bioavailability. Mol. Pharm. 2018;15:831–839. doi: 10.1021/acs.molpharmaceut.7b00973. [DOI] [PubMed] [Google Scholar]
- 65.Penniston JT, et al. Passive permeation of organic compounds through biological tissue: A non-steady-state theory. Mol. Pharmacol. 1969;5:333–341. [PubMed] [Google Scholar]
- 66.Agoni C, et al. Extended double bond conjugation in the chalcone framework favours MAO-B inhibition: A structural perspective on molecular dynamics. Comb. Chem. High Throughput Screen. 2022;25:2059–2069. doi: 10.2174/1386207325666220214110717. [DOI] [PubMed] [Google Scholar]
- 67.Schweizer L, Mueller L. Arey Pharmacology and Therapeutics. San Diego: Academic Press; 2014. protein conformational dynamics and signaling in evolution and pathophysiology; pp. 209–249. [Google Scholar]
- 68.Wang C, et al. Recent developments and applications of the MMPBSA method. Front. Mol. Biosci. 2018 doi: 10.3389/fmolb.2017.00087. [DOI] [PMC free article] [PubMed] [Google Scholar]
Associated Data
This section collects any data citations, data availability statements, or supplementary materials included in this article.
Supplementary Materials
Data Availability Statement
All data generated or analyzed during this study are included in this published article [and its supplementary information files].


