Abstract
Objective
To identify novel DNA methylation-regulated differentially expressed genes (MeDEGs) in RA by integrated analysis of DNA methylation and RNA-Seq data.
Methods
The transcription and DNA methylation profiles of 9 RA and 15 OA synovial tissue were generated by RNA-Seq and Illumina 850K DNA methylation BeadChip. Gene set enrichment analysis (GSEA) and Weighted gene co-expression network analysis (WGCNA) were used to analyze methylation-regulated expressed genes by R software. The differentially expressed genes (DEGs), differentially methylated probes (DMPs), differentially methylated genes (DMGs) were analyzed by DESeq and ChAMP R package. The functional correlation of MeDEGs was analyzed by Gene Ontology (GO) and Kyoto Encyclopedia of Genes and Genomes (KEGG). The protein–protein interaction (PPI) network of MeDEGs was constructed by STRING and Reactome FI Cytoscape Plugin. Correlation analysis between methylation level and mRNA expression was conducted with R software.
Results
A total of 17,736 genes, 25,578 methylated genes and 755,852 methylation probes were detected. A total of 16,421 methylation-regulated expressed genes were obtained. The GSEA showed that these genes are associated with activation of immune response, adaptive immune response, Inflammatory response in C5 (ontology gene sets). For KEGG analysis, these genes are associated with rheumatoid arthritis, NF-kappa B signaling pathway, T cell receptor signaling pathway. The WGCNA showed that the turquoise module exhibited the strongest correlation with RA (R = 0.78, P = 1.27 × 10− 05), 660 genes were screened in the turquoise module. A total of 707 MeDEGs were obtained. GO analysis showed that MeDEGs were enriched in signal transduction, cell adhesion for BP, enriched in plasma membrane, integral component of membrane for CC, and enriched in identical protein binding, calcium ion binding for MF. The KEGG pathway analysis showed that the MeDEGs were enriched in calcium signaling pathway, T cell receptor signaling pathway, NF-kappa B signaling pathway, Rheumatoid arthritis. The PPI network containing 706 nodes and 882 edges, and the enrichment p value < 1.0 × 10− 16. With Cytoscape, based on the range of more than 10 genes, a total of 8 modules were screened out. Spearman correlation analysis showed RGS1(cg10718027), RGS1(cg02586212), RGS1(cg10861751) were significantly correlated with RA.
Conclusions
RGS1 can be used as novel methylated biomarkers for RA.
Supplementary Information
The online version contains supplementary material available at 10.1186/s12967-022-03664-5.
Keywords: Rheumatoid arthritis, Synovial tissue, DNA methylation, RNA-seq, Differentially expressed genes
Introduction
Rheumatoid arthritis (RA) is an autoimmune disease characterized by synovitis and system inflammation that can affect many tissues, including the synovial tissue, leading to joint swelling and pain [1, 2]. Its pathogenesis is still not very clear, genetic and environmental have been proved to be the important factors [3]. Epigenetic factors provide a mechanism that links genetics, regulation of gene expression, and environmental risk factors [4]. Epigenetics including histone acetylation and methylation have been identified to be associated with the development of RA [5].
DNA methylation is accomplished by transferring the methyl group from the methyl donor S-adenosylmethionine to the DNA by DNA methyltransferase, leading to the formation of 5-methylcytosine (5-mC). Studies on methylation have focused on the role of 5mC in CpG-rich regions (called CpG islands), where they are enriched in promoters near transcription start sites and their methylation blocks transcription initiation [6].
Transcriptomics is tissue-specific and as such offers an avenue for the investigation of effects localized to cells that are likely to play an important role in the etiology of diseases [7]. RNA sequencing (RNA-Seq) technology has become a primary tool of transcriptomics research to characterize expression within certain cell types and tissues. Illumina methylation BeadChip is a popular method for assaying methylation of CpG sites across the human genome. The Illumina MethylationEPIC (EPIC) array uses the Infinium probe technology and shares 452,453 common probes [8].
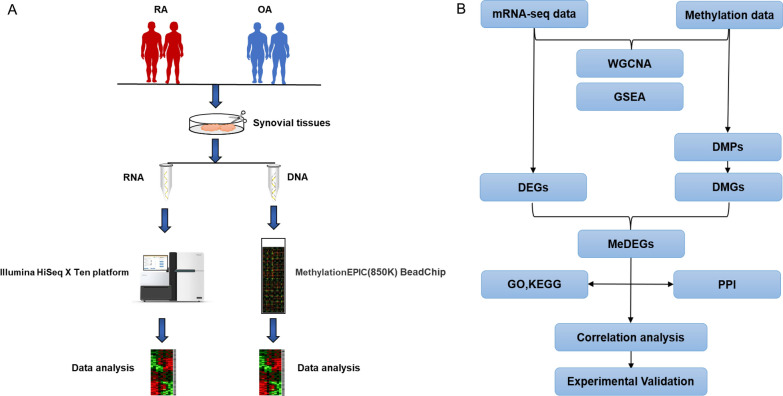
In the present study, we performed RNA-Seq and 850k methylation array on 9 RA and 15 OA synovial tissues to identify methylation-regulated differentially expressed genes (MeDEGs). The analysis process was shown in Fig. 1. This will be of profound significance for clarifying the role of methylation in RA and identifying the candidate biomarker for RA future research.
Fig. 1.
Flowchart for analysis. A Experimental flowchart; B Data analysis flowchart. RNA-seq: RNA-sequencing; mRNA: messenger RNA; GO: Gene Ontology; KEGG: Kyoto Encyclopedia of Genes and Genomes; DEGs: Differentially expressed genes; DMPs: differentially methylated probes; DMGs: differentially methylated genes; MeDEGs: methylation-regulated differentially expressed genes. WGCNA: weighted gene co-expression network analysis
Materials and methods
Sample collection
Synovial tissue is derived from RA and OA patients after knee joint replacement at Shanghai Guanghua Hospital of Integrated Traditional Chinese and Western Medicine. This study was approved by the Ethics Committee of Guanghua Hospital of Integrated Traditional Chinese and Western Medicine (approval number: 2018-K-12) and written consent was collected before the surgery from the patients.
Transcriptome sequencing
Total RNA was extracted using the Trizol reagent (Thermo Fisher, Waltham, MA, USA) following the manufacturer’s protocol. RNA integrity was evaluated using the Agilent 2100 Bioanalyzer (Agilent Technologies, Santa Clara, CA, USA). The total RNA that had a standard of RNA integrity number (RIN) ≥ 7.0, 28 S/18S ≥ 0.7 was subjected to RNA-Seq. The libraries were constructed using TruSeq Stranded mRNA LTSample Prep Kit (Illumina, San Diego, CA, USA) according to the manufacturer’s instructions. The libraries were sequenced on an Illumina HiSeq X Ten platform. QC data was shown in Additional file 1: Fig. S1.
Illumina 850K (EPIC) DNA methylation array
Genomic DNA was extracted from synovial tissue with the MagMAX™-96 DNA Multi-Sample Kit (Thermo Fisher Scientific, Waltham, MA, USA) according to the manufacturer’s instructions. Genome-wide methylation was detected by the Illumina Human Methylation 850K Beadchip (Zhuoli Tech, Shanghai, China). DNA concentration and integrity were assessed by a NanoDrop 2000 spectrophotometer (Thermo Fisher Scientific, Waltham, MA, USA) and agarose gel electrophoresis, respectively. DNA was bisulfite-treated using the Zymo Research EZ DNA methylation-Glod Kits (Zymo Research, Irvine, CA, USA). Bisulfite-converted DNA was analyzed on an Illumina Infinium Methylation EPIC 850K BeadChip (Illumina). Microarray data were extracted, and the DNA methylation level was calculated using GenomeStudio Methylation Module v1.8 software (Version 2011.1) with default parameters. QC data was shown in Additional file 1: Fig. S1.
The gene set enrichment analysis
Gene set enrichment analysis (GSEA) is used to determine the statistically significant differences between two groups about a defined set of genes. The analysis was conducted using the clusterProfiler package of R software, and the data set was from the Molecular Signatures Database v7.2 (MSigDB) downloaded from the GSEA-MSigDB website. The MSigDB is a database of gene sets for performing gene set enrichment analysis [9]. |NES|>1, P < 0.05, FDR ≤ 0.25 were selected as the cut-off criteria indicating statistically significant differences. KEGG gene sets, C5: ontology gene sets are the target data sets for our study. The R codes were provided in Additional file 2.
The weighted gene co-expression network analysis
Weighted gene co-expression network analysis (WGCNA) is used to construct the gene coexpression network and identify the functional modules [10]. The WGCNA was down by the WGCNA R software package [11]. Firstly, we normalized the samples first and then removed the outlier samples. The soft threshold power must be selected according to the standard scale-free networks, and all differential genes were calculated by a power function. Subsequently, the adjacency matrix was transformed into a topological overlap matrix (TOM), and the corresponding dissimilarity (1-TOM) was calculated. The dynamic tree cut method was performed to identify the module by hierarchically clustering genes [12]. The minModuleSize = 25. The Pearson correlation analysis was conducted to examine the relationship among gene modules to identify the module with the strongest association with RA.
Identification of DEGs, DMPs, and DMGs
DEGs were performed using the DESeq R package [13]. Adjust P-value (False Discovery Rate) < 0.05 and |log2FoldChange| ≥1.5 were set as the threshold for significant differential expression. The ChAMP R package [14] was used to analyze the Methylation data. The criteria for the selection of DMPs are FDR < 0.05 and |Δβ| ≥ 0.1.
Functional enrichment analysis
The MeDEGs were annotated by the GO functional enrichment analysis which included biological process (BP), molecular function (MF), cellular component (CC), and KEGG pathway analysis [15]. KEGG is a database resource for elucidating the genes’ function at the molecular and higher levels, including biochemical pathways [16]. The annotation and visualization were performed by the clusterProfiler R package [17]. The enrichment analysis was performed by a hypergeometric test. P < 0.05 was chosen as the cut-off criterion indicating a statistically significant difference. The R codes were provided in Additional file 2.
The protein–protein interaction network construct and hub gene identified
The protein–protein interaction (PPI) network of MeDEGs was constructed by the STRING database. STRING is capable of fully describing user gene lists and functional genomic datasets and allows the creation and sharing of highly customized and enhanced protein-protein association networks [18]. The “minimum required interaction score” choose high confidence (0.7). The PPI network was displayed by Reactome functional interactions (FI) Cytoscape Plugin. Reactome FI Cytoscape Plugin can be used to find network patterns by the Reactome database [19].
Correlation analysis between methylation level and mRNA expression
R software was used to explore the association between methylation level and expression by spearman correlation analysis. R ≥ 0.4, P < 0.05 was used as the criterion for screening correlation. The R codes were provided in Additional file 2.
Results
The results of the transcriptome and DNA methylation array
A total of 17,736 genes were detected in our transcriptome sequencing data. In our Illumina 850K DNA methylation array sequencing data, a total of 25,578 methylated genes and 755,852 methylation probes were detected.
The GSEA of methylation-regulated expressed genes
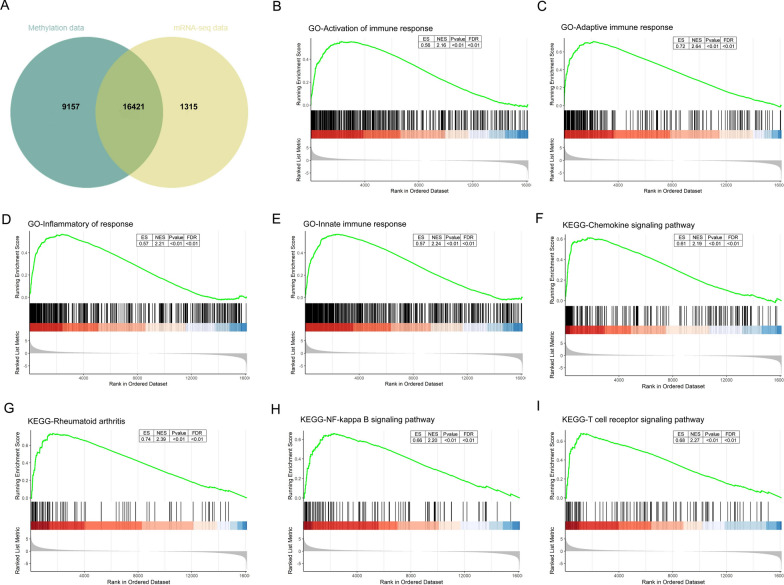
The intersection of the two sets of sequencing data was used to obtain methylation-regulated expressed genes. A total of 16,421 methylation-regulated expressed genes were obtained. The Venn diagram is shown in Fig. 2A. The first part is the Enrichment score line graph: the score at the highest peak is the ES value of the gene set. In the second part, the black lines represent gene positions in the sorted gene table. The leading edge subset is the part of the genes corresponding to the origin to the peak ES of the green curve, indicating the genes that have a major contribution to the enrichment. The third part is the distribution of the rank values of all genes after sorting. The genes corresponding to the red part of the heat map are highly expressed in RA, the genes corresponding to the blue part are highly expressed in OA, and the signal-to-noise ratio corresponding to each gene is shown in the gray area map [20]. The GSEA shown that these genes are associated with activation of immune response, adaptive immune response, Inflammatory response, Innate immune response in C5 (ontology gene sets). For KEGG analysis, these genes are associated with chemokine signaling pathway, rheumatoid arthritis, NF-kappa B signaling pathway, T cell receptor signaling pathway. Normalized Enrichment Score (NES) and FDR were presented in the upper right corner of the plot (Fig. 2B–I).
Fig. 2.
GSEA of methylation-regulated expressed genes. A Venn diagram of methylation-regulated expressed genes; B–E C5 (ontology gene sets); C–I KEGG sets; GSEA: Gene Set Enrichment Analysis. ES: enrichment score; NES: normalized enrichment score. The green line means enrichment profile. The red part of the heat map represents the genes are highly expressed in RA, blue part represents the genes are highly expressed in OA, the gray area of map represents the signal-to-noise ratio of each gene
The WGCNA of methylation-regulated expressed genes
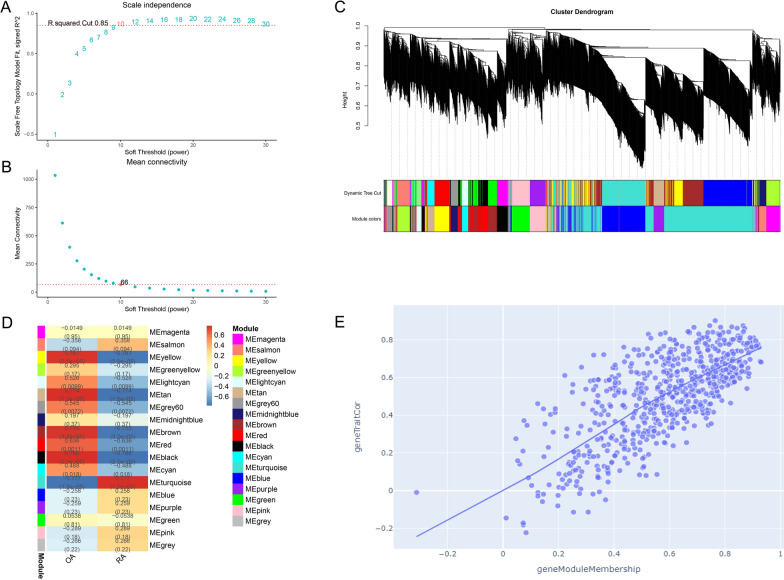
The soft-thresholding power was ten which was determined based on R squared cut of 0.85 (Fig. 3A, B). Eighteen modules were identified based on average hierarchical clustering and dynamic tree clipping (Fig. 3C). The turquoise module exhibited the strongest correlation with RA (R = 0.78, P = 1.27 × 10− 05) (Fig. 3D). 660 genes were screened in the turquoise module for subsequent analysis (Fig. 3E).
Fig. 3.
Identification of RA-related module. A Graph of scale independence, B graph of mean connectivity, C cluster dendrogram of the co-expression network modules, D cluster plot analysis of the relationship between RA and modules. E Scatter plot analysis of the turquoise module
Identification of DEGs, DMGs, and DMPs
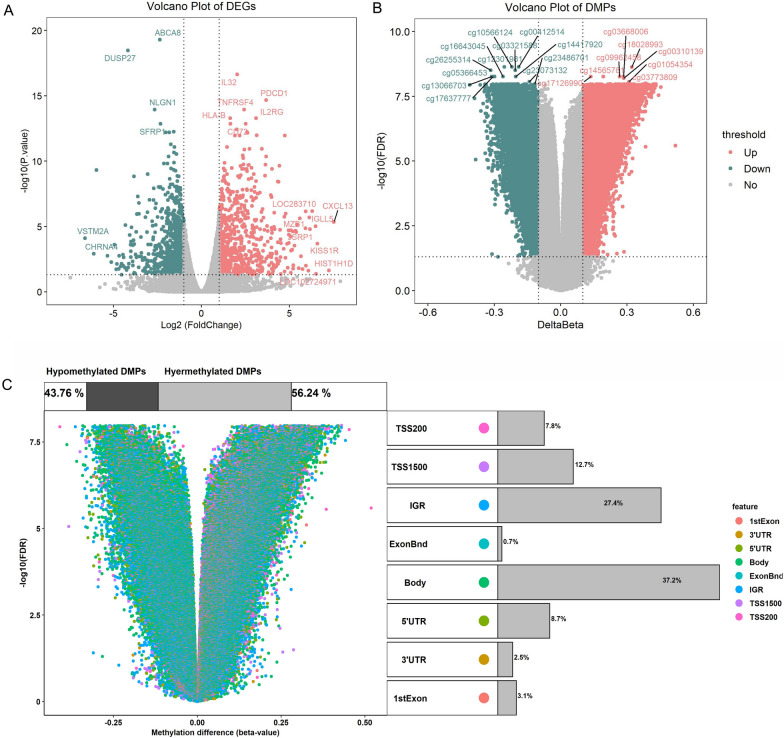
In our transcriptome sequencing data, 851 DEGs and 16250 DMGs were identified. The volcano plots were shown in Fig. 4A and B. Differential methylation probes are distributed differently in each region, among which the promoter region (1stExon,5’UTR, TSS1500, TSS200) accounts for about 32.3% (Fig. 4C).
Fig. 4.
Differentially expressed genes and differentially methylated probes in RA. A The volcano plot of DEGs; B the volcano plot of DMPs. The red dots represent up-regulation and the green dots represent down-regulation; C the Distribution of DMPs
The GO and KEGG analysis of MeDEGs
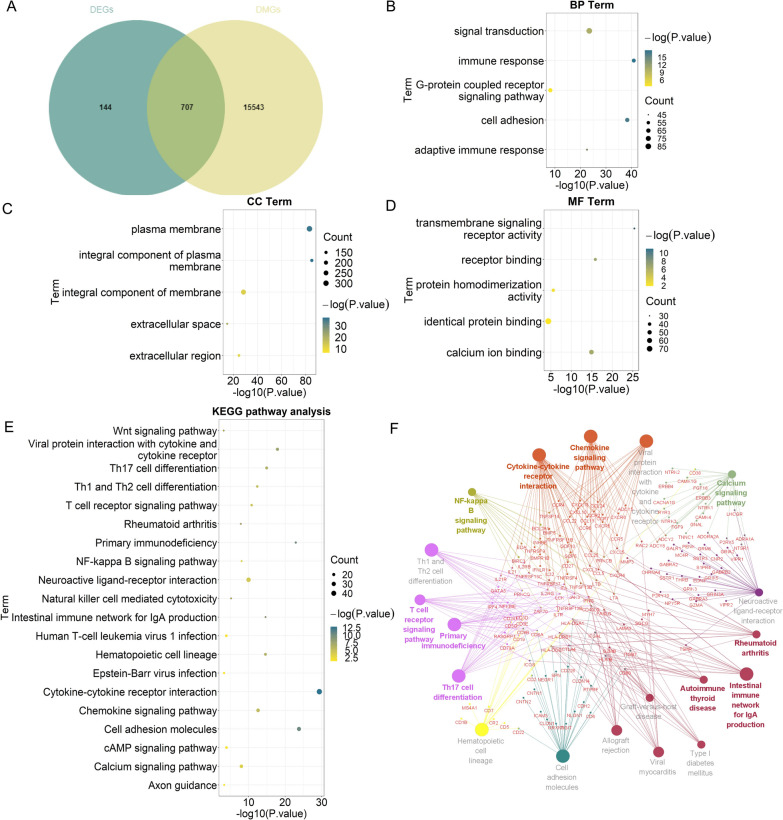
The intersection of DEGs and DMGs was used to obtain MeDEGs. A total of 707 MeDEGs were obtained. The Venn diagram is shown in Fig. 5A. The results of GO functional enrichment analysis showed that MeDEGs were enriched in signal transduction, cell adhesion, G-protein coupled receptor signaling pathway for BP (Fig. 5B), enriched in plasma membrane, integral component of membrane, integral component of plasma membrane for CC (Fig. 5C), and enriched in identical protein binding, calcium ion binding, protein homodimerization activity for MF (Fig. 5D). The KEGG pathway analysis showed that the MeDEGs were enriched in cytokine–cytokine receptor interaction, calcium signaling pathway, T cell receptor signaling pathway, NF-kappa B signaling pathway, Rheumatoid arthritis (Fig. 5E, F).
Fig. 5.
The GO and KEGG pathway analysis of MeDEGs. A The Venn diagram of MeDEGs; B BP terms; C CC terms; D MF terms; E, F KEGG pathway enrichment terms. BP: biological process; MF: molecular function; CC: cell component; MeDEGs: methylation-regulated differentially expressed genes; KEGG: Kyoto Encyclopedia of Genes and Genomes; GO: Gene Ontology. The size of the dots represent the number of enriched genes, and the color represents the value of P value. The bigger the dot, the higher the column, the more genes are enriched. The darker the color, the smaller the P value
The PPI network analysis and hub genes screened
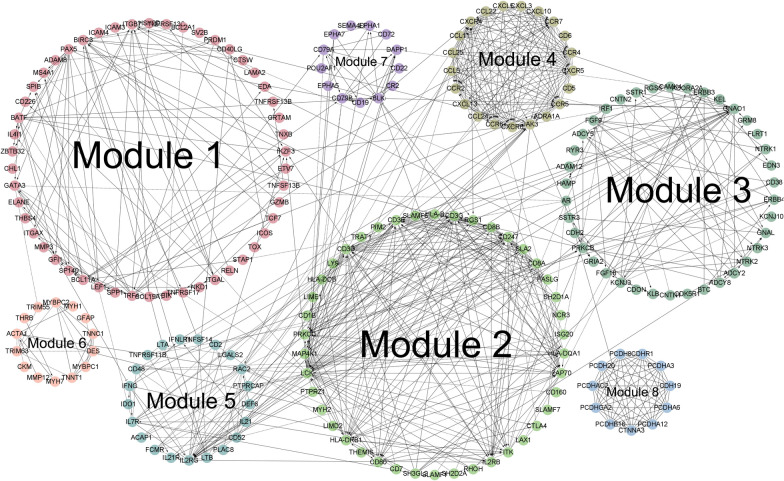
Based on the STRING database, the PPI network contains 706 nodes and 882 edges, and the enrichment P-value < 1.0 × 10− 16. With the Reactome FI Cytoscape Plugin, based on the range of more than 10 genes, a total of 8 modules were screened out (Fig. 6). Genes in module 1 are mainly related to pathways including Intestinal immune network for IgA production, NF-kappa B signaling pathway. Genes in module 2 are mainly related to pathways including Th17 cell differentiation, T cell receptor signaling pathway, Th1 and Th2 cell differentiation. Genes in module 5 are mainly related to pathways including JAK-STAT signaling pathway, Inflammatory bowel disease. Genes in module 6 and module 8 are mainly related to pathways including Wnt signaling pathway.
Fig. 6.
Protein–protein interaction network. Digital from ‘1’ to ‘8’ represent different modules constructed by Reactome functional interactions Cytoscape Plugin. Each edge between any two proteins (dots) indicates an interaction
Based on the turquoise module analyzed by WGCNA and the network modules constructed by PPI, we identified SPP1, RGS1, RAC2, MMP3, IL32, CD52, CCL5 as our hub genes. Detailed information on genes and probes can be found in Table 1.
Table 1.
Detailed information on genes and probes
| ProbeID | Gene | FDR | deltaBeta | Methylation_status | Group |
|---|---|---|---|---|---|
| cg02549628 | SPP1 | 1.91 × 10− 06 | − 0.17 | Hypomethylated | TSS1500 |
| cg20261167 | SPP1 | 1.90 × 10− 03 | − 0.12 | Hypomethylated | 1stExon |
| cg15460348 | SPP1 | 2.57 × 10− 03 | − 0.11 | Hypomethylated | 1stExon |
| cg10718027 | RGS1 | 2.25 × 10− 08 | − 0.28 | Hypomethylated | TSS200 |
| cg02586212 | RGS1 | 6.91 × 10− 08 | − 0.23 | Hypomethylated | 1stExon |
| cg10861751 | RGS1 | 9.57 × 10− 08 | − 0.21 | Hypomethylated | TSS200 |
| cg08235798 | RAC2 | 2.91 × 10− 04 | − 0.11 | Hypomethylated | TSS1500 |
| cg16466334 | MMP3 | 9.53 × 10− 03 | 0.12 | Hypermethylated | TSS200 |
| cg01594685 | IL32 | 7.42 × 10− 05 | 0.10 | Hypermethylated | TSS1500 |
| cg23403079 | CD52 | 3.91 × 10− 07 | − 0.22 | Hypomethylated | TSS200 |
| cg08572767 | CD52 | 1.00 × 10− 06 | − 0.19 | Hypomethylated | TSS200 |
| cg07188645 | CCL5 | 4.22 × 10− 04 | − 0.12 | Hypomethylated | TSS1500 |
| cg19411729 | CCL5 | 5.14 × 10− 03 | − 0.10 | Hypomethylated | TSS1500 |
Correlation analysis between methylation level and mRNA expression
Spearman correlation analyses showed significant associations between DNA methylation levels of 3 probes and mRNA expressions of RGS1. RGS1 (cg10718027) (R = − 0.73), RGS1(cg02586212) (R = − 0.80), RGS1(cg10861751) (R = − 0.82) (Fig. 7A–C). Other correlations are shown Additional file 3: Fig. S3.
Fig. 7.
DNA methylation/mRNA correlation plots for differential methylation positions/genes. R: spearman correlation coefficient
Discussion
RA is an autoimmune disease, its occurrence is a complex biological process, including the abnormal expression of immune-related genes, the activation of immune-related pathways [21]. Thus, it is important to identify the genes and signaling pathways involved in the pathogenic process in RA. Sequencing or microarray combined with bioinformatics analysis has become an effective method to reveal the molecular mechanism of numerous diseases. Huo et al. [22] determined that abnormal methylation of CDC20 and CCNA2 may be effective in predicting the prognosis of RA with microarray combined with bioinformatics analysis. For RA, some studies combing microarray with bioinformatics analysis have revealed differential methylation signals at S100A6 and EFCAB4B promoter regions in the whole blood [23], CD86, RAB20, XAF1, FOLR3, LTBR, KCNH8, DOK7, PDGFA, PITPNM2, and CELSR1 in B cells [24], and IFN related genes (IFIT1, IRF7, MX1, OAS1, USP18, RSAD2, IFI44L) in CD4+ T cells [25]. However, until now, the methylation of RA-related genes are still insufficient. Identification of methylation-regulated differentially expressed genes (MeDEGs) of RA based on high-throughput data will be of profound significance for clarifying the role of methylation and identifying candidate directions for future research.
In this present research, we identified 17,736 genes in our transcriptome sequencing data, a total of 25,578 methylated genes, and 755,852 methylation probes in our Illumina 850K BeadChip data. After the intersection of the two sets of data, 16,421 methylation-regulated expressed genes were found, and then, GSEA was used to perform these genes. The results of GSEA showed that these genes are associated with activation of immune response, adaptive immune response, inflammatory response, innate immune response in C5 (ontology gene sets). For KEGG analysis, these genes are associated with chemokine signaling pathway, rheumatoid arthritis, NF-kappa B signaling pathway, T cell receptor signaling pathway.
With WGCNA, 660 genes in turquoise module were strongly associated with RA. Furthermore, we screened 851 DEGs and 16,250 DMGs. We took the intersection of the DMGs and DEGs to obtain 188 MeDEGs. The GO functional enrichment analysis showed that MeDEGs were enriched in signal transduction, cell adhesion, G-protein coupled receptor signaling pathway for BP, enriched in plasma membrane, integral component of membrane, integral component of plasma membrane for CC, and enriched in identical protein binding, calcium ion binding, protein homodimerization activity for MF. The KEGG pathway analysis showed that the MeDEGs were enriched in cytokine-cytokine receptor interaction, calcium signaling pathway, T cell receptor signaling pathway, NF-kappa B signaling pathway, Rheumatoid arthritis. The calcium signaling pathway plays an important role in autoimmune diseases such as RA [26, 27]. Mutations of the genes encoding T cell receptor signaling molecules, such as ZAP-70, can cause T-cell mediated autoimmune diseases, including RA [28]. GO and KEGG bioinformatics analysis showed that the function and involved pathways of MeDEGs are closely related to RA.
Based on the turquoise module analyzed by WGCNA and the network modules constructed by PPI, we screened out SPP1, RGS1, RAC2, MMP3, IL32, CD52, CCL5 for further study. SPP1 (cg02549628), (cg20261167), (cg15460348); RGS1 (cg10718027), (cg02586212), (cg10861751); RAC2 (cg08235798); MMP3(cg16466334); IL32 (cg01594685); CD52 (cg23403079), (cg08572767); CCL5 (cg07188645), (cg19411729). Methylation of these gene loci, which occurs near the promoter, is more likely to affect gene expression. Spearman correlation analysis was used to analyze the relationship between gene methylation levels and mRNA expression. The genes and probes with the highest correlation were RGS1(cg10718027), RGS1(cg02586212), RGS1(cg10861751). Regulator of G protein signaling 1 (RGS1) is has been reported to be associated with multiple cancers [29]. MicroRNA-376b-3p can target RGS1 mRNA to inhibit the development of osteosarcoma [30], and RGS1 expression desensitizes G-protein-coupled receptor signaling and is associated with poor prognosis in multiple myeloma [31]. Prolonged inflammation of the synovial membrane in RA can lead to the formation of pannus. The persistent aggressiveness of the pannus makes RA a tumor-like disease [32]. RGS1 has been extensively studied in tumors, making its study in RA very promising. Most importantly, inhibition of RGS1 expression can inhibit inflammatory response and angiogenesis in CIA rats by inhibiting TLR signaling pathway, thus providing a new therapeutic target for RA treatment. Our study further confirms the important role of the RGS1 gene in RA.
In conclusion, we reported possible methylation-regulated differentially expressed biomarkers and revealed the molecular functions of screened genes involved in RA by integrated bioinformatics analysis. These results guide to further studying the underlying mechanisms of RA development. We identified RGS1 that may serve as novel biomarkers and potential targets for accurate diagnosis and treatment strategies for RA. Further experiments are warrant to verify these biomarkers and to explore the specific mechanisms underlying RA.
Supplementary Information
Additional file 1: Data Quality Control (QC).
Additional file 3: Correlation between mRNA expression and methylation level of other genes.
Acknowledgements
We thank all participating subjects for their kind cooperation in this study.
Author contributions
DH, SS and SG contributed to the conception, design, and final approval of the submitted version. YJ, Lingxia X, Linshuai X contributed to the analysis of sequencing data, and statistical analysis. PJ, KW collected samples and helped with statistics and drafting of the manuscript. The final manuscript was completed by RZ, CC. All authors read and approved the final manuscript.
Funding
This work was funded by the National Natural Science Funds of China (82074234); Shanghai Chinese Medicine Development Office, National Administration of Traditional Chinese Medicine, Regional Chinese Medicine (Specialist) Diagnosis and Treatment Center Construction Project-Rheumatology; State Administration of Traditional Chinese Medicine, National TCM Evidence-Based Medicine Research and Construction Project, Basic TCM Evidence-Based Capacity Development Program; Shanghai Municipal Health Commission, East China Region based Chinese and Western Medicine Joint Disease Specialist Alliance; National Key Research and Development Project (Nos. 2018YFC1705200 and 2018YFC1705203).
Declarations
Ethics approval and consent to participate
This study was approved by the Ethics Committee of Guanghua Hospital of Integrated Traditional Chinese and Western Medicine (approval number: 2018-K-12) and written consent was collected before the surgery from the patients.
Competing interests
No potential conflicts of interest were disclosed to all the authors.
Footnotes
Publisher’s Note
Springer Nature remains neutral with regard to jurisdictional claims in published maps and institutional affiliations.
Runrun Zhang and Cen Chang contributed equally to the study
Contributor Information
Shicheng Guo, Email: Shicheng.Guo@wisc.edu.
Songtao Sun, Email: sstever0156258@aliyun.com.
Dongyi He, Email: hedongyi1967@shutcm.edu.cn.
References
- 1.Korczowska I. Rheumatoid arthritis susceptibility genes: an overview. World J Orthop. 2014;5:544. doi: 10.5312/wjo.v5.i4.544. [DOI] [PMC free article] [PubMed] [Google Scholar]
- 2.Scott DL, Wolfe F, Huizinga TW. Rheumatoid arthritis. Lancet. 2010;376:1094–108. doi: 10.1016/S0140-6736(10)60826-4. [DOI] [PubMed] [Google Scholar]
- 3.McInnes IB. The pathogenesis of rheumatoid arthritis. N Engl J Med. 2011;365:2205–19. doi: 10.1056/NEJMra1004965. [DOI] [PubMed] [Google Scholar]
- 4.Hewagama A. The genetics and epigenetics of autoimmune diseases. J Autoimmune. 2009;33:3–11. doi: 10.1016/j.jaut.2009.03.007. [DOI] [PMC free article] [PubMed] [Google Scholar]
- 5.Klein K, Gay S. Epigenetics in rheumatoid arthritis. Curr Opin Rheumatol. 2015;27:76–82. doi: 10.1097/BOR.0000000000000128. [DOI] [PubMed] [Google Scholar]
- 6.Jones PA. Functions of DNA methylation: islands, start sites, gene bodies and beyond. Genetics. 2012;13:9. doi: 10.1038/nrg3230. [DOI] [PubMed] [Google Scholar]
- 7.Song X, Lin Q. Genomics, transcriptomics and proteomics to elucidate the pathogenesis of rheumatoid arthritis. Rheumatol Int. 2017;37:1257–65. doi: 10.1007/s00296-017-3732-3. [DOI] [PubMed] [Google Scholar]
- 8.Cheung K. Correlation of Infinium HumanMethylation450K and MethylationEPIC BeadChip arrays in cartilage. Epigenetics. 2020;15:594–603. doi: 10.1080/15592294.2019.1700003. [DOI] [PMC free article] [PubMed] [Google Scholar]
- 9.Liberzon A, Birger C, Thorvaldsdóttir H, Ghandi M, Tamayo P. The Molecular Signatures Database (MSigDB) hallmark gene set collection. Cell Syst. 2015;1:417–25. doi: 10.1016/j.cels.2015.12.004. [DOI] [PMC free article] [PubMed] [Google Scholar]
- 10.Zeng F, Shi M, Xiao H, Chi X. WGCNA-based identification of hub genes and key pathways involved in nonalcoholic fatty liver disease. BioMed Res Int. 2021;2021:5633211. doi: 10.1155/2021/5633211. [DOI] [PMC free article] [PubMed] [Google Scholar]
- 11.Langfelder P, Horvath S. WGCNA: an R package for weighted correlation network analysis. BMC Bioinformatics. 2008;9:559. doi: 10.1186/1471-2105-9-559. [DOI] [PMC free article] [PubMed] [Google Scholar]
- 12.Zhang S, Wang H, Liu J, Tao T, Zeng Z, Wang M. RGS1 and related genes as potential targets for immunotherapy in cervical cancer: computational biology and experimental validation. J Transl Med. 2022;20:334. doi: 10.1186/s12967-022-03526-0. [DOI] [PMC free article] [PubMed] [Google Scholar]
- 13.Simon Anders WH. Differential expression of RNA-Seq data at the gene level – the DESeq package. EMBL. 2012;24.
- 14.Tian Y, Morris TJ, Webster AP, Yang Z, Beck S, Feber A, et al. ChAMP: updated methylation analysis pipeline for Illumina BeadChips. Bioinformatics. 2017;33:3982–4. doi: 10.1093/bioinformatics/btx513. [DOI] [PMC free article] [PubMed] [Google Scholar]
- 15.Ashburner M, Ball CA, Blake JA, Botstein D, Butler H, Cherry JM, et al. Gene ontology: tool for the unification of biology. The Gene Ontology Consortium. Nat Genet. 2000;25:25–9. doi: 10.1038/75556. [DOI] [PMC free article] [PubMed] [Google Scholar]
- 16.Kanehisa M, Furumichi M, Tanabe M, Sato Y, Morishima K. KEGG: new perspectives on genomes, pathways, diseases and drugs. Nucleic Acids Res. 2017;45:D353–61. doi: 10.1093/nar/gkw1092. [DOI] [PMC free article] [PubMed] [Google Scholar]
- 17.Yu G, Wang L-G, Han Y, He Q-Y. clusterProfiler: an R package for comparing biological themes among gene clusters. Omics J Integr Biol. 2012;16:284–7. doi: 10.1089/omi.2011.0118. [DOI] [PMC free article] [PubMed] [Google Scholar]
- 18.Szklarczyk D, Gable AL, Nastou KC, Lyon D, Kirsch R, Pyysalo S, et al. The STRING database in 2021: customizable protein-protein networks, and functional characterization of user-uploaded gene/measurement sets. Nucleic Acids Res. 2021;49:D605–12. doi: 10.1093/nar/gkaa1074. [DOI] [PMC free article] [PubMed] [Google Scholar]
- 19.Yang J, Wang N. Genome-wide expression and methylation profiles reveal candidate genes and biological processes underlying synovial inflammatory tissue of patients with osteoarthritis. Int J Rheum Dis. 2015;18:783–90. doi: 10.1111/1756-185X.12643. [DOI] [PubMed] [Google Scholar]
- 20.Subramanian A, Tamayo P, Mootha VK, Mukherjee S, Ebert BL, Gillette MA, et al. Gene set enrichment analysis: A knowledge-based approach for interpreting genome-wide expression profiles. Proc Natl Acad Sci. 2005;102:15545–50. doi: 10.1073/pnas.0506580102. [DOI] [PMC free article] [PubMed] [Google Scholar]
- 21.Sparks JA. Rheumatoid Arthritis. Ann Intern Med. 2019;170:ITC1–16. doi: 10.7326/AITC201901010. [DOI] [PubMed] [Google Scholar]
- 22.Huo X, Sun H, Cao D, Yang J, Peng P, Yu M, et al. Identification of prognosis markers for endometrial cancer by integrated analysis of DNA methylation and RNA-Seq data. Sci Rep. 2019;9:9924. doi: 10.1038/s41598-019-46195-8. [DOI] [PMC free article] [PubMed] [Google Scholar]
- 23.Svendsen AJ, Gervin K, Lyle R, Christiansen L, Kyvik K, Junker P, et al. Differentially methylated DNA regions in monozygotic twin pairs discordant for rheumatoid arthritis: an epigenome-wide study. Front Immunol. 2016;7:510. doi: 10.3389/fimmu.2016.00510. [DOI] [PMC free article] [PubMed] [Google Scholar]
- 24.Tseng L, Lin, Li, Yen C, et al. Next-generation sequencing profiles of the methylome and transcriptome in peripheral blood mononuclear cells of rheumatoid arthritis. J Clin Med. 2019;8:1284. doi: 10.3390/jcm8091284. [DOI] [PMC free article] [PubMed] [Google Scholar]
- 25.Chen S, Pu W, Guo S, Jin L, He D, Wang J. Genome-wide DNA methylation profiles reveal common epigenetic patterns of interferon-related genes in multiple autoimmune diseases. Front Genet. 2019;10:223. doi: 10.3389/fgene.2019.00223. [DOI] [PMC free article] [PubMed] [Google Scholar]
- 26.Hemon P, Renaudineau Y, Debant M, Le Goux N, Mukherjee S, Brooks W, et al. Calcium signaling: from normal B cell development to tolerance breakdown and autoimmunity. Clin Rev Allergy Immunol. 2017;53:141–65. doi: 10.1007/s12016-017-8607-6. [DOI] [PubMed] [Google Scholar]
- 27.Wong VKW, Qiu C, Xu S, Law BYK, Zeng W, Wang H, et al. Ca 2+ signalling plays a role in celastrol-mediated suppression of synovial fibroblasts of rheumatoid arthritis patients and experimental arthritis in rats. Br J Pharmacol. 2019;176:2922–44. doi: 10.1111/bph.14718. [DOI] [PMC free article] [PubMed] [Google Scholar]
- 28.Takeuchi Y, Hirota K, Sakaguchi S. Impaired T cell receptor signaling and development of T cell-mediated autoimmune arthritis. Immunol Rev. 2020;294:164–76. doi: 10.1111/imr.12841. [DOI] [PubMed] [Google Scholar]
- 29.Bai Y, Hu M, Chen Z, Wei J, Du H. Single-cell transcriptome analysis reveals RGS1 as a new marker and promoting factor for T-cell exhaustion in multiple cancers. Front Immunol. 2021;12:767070. doi: 10.3389/fimmu.2021.767070. [DOI] [PMC free article] [PubMed] [Google Scholar]
- 30.Zhang L, Yao M, Ma W, Jiang Y, Wang W. MicroRNA-376b-3p targets RGS1 mRNA to inhibit proliferation, metastasis, and apoptosis in osteosarcoma. Ann Transl Med. 2021;9:1652. doi: 10.21037/atm-21-4949. [DOI] [PMC free article] [PubMed] [Google Scholar]
- 31.Roh J, Shin S-J, Lee A-N, Yoon DH, Suh C, Park C-J, et al. RGS1 expression is associated with poor prognosis in multiple myeloma. J Clin Pathol. 2017;70:202–7. doi: 10.1136/jclinpath-2016-203713. [DOI] [PubMed] [Google Scholar]
- 32.You S, Koh JH, Leng L, Kim W-U, Bucala R. The tumor-like phenotype of rheumatoid synovium: molecular profiling and prospects for precision medicine. Arthritis Rheumatol Hoboken NJ. 2018;70:637–52. doi: 10.1002/art.40406. [DOI] [PMC free article] [PubMed] [Google Scholar]
Associated Data
This section collects any data citations, data availability statements, or supplementary materials included in this article.
Supplementary Materials
Additional file 1: Data Quality Control (QC).
Additional file 3: Correlation between mRNA expression and methylation level of other genes.


