

Abstract
OBJECTIVES:
To quantify prescription analgesic use of elderly nursing home (NH) residents with persistent noncancer pain and to identify individual and facility traits associated with no treatment.
DESIGN:
Cross-sectional study.
SETTING:
Linked Minimum Data Set (MDS) assessments; Online Survey, Certification and Reporting (OSCAR) records; and Medicare Part D claims.
PARTICIPANTS:
Individuals aged 65 and older with persistent noncancer pain were identified from a cross-section of all long-stay U.S. NH residents with an MDS assessment and Medicare Part D enrollment in 2008, excluding those who were terminally ill, those with Alzheimer’s disease, and those with the most-severe cognitive impairment.
MEASUREMENTS:
Residents with moderate to severe daily pain on consecutive assessments at least 90 days apart constituted the cohort with persistent pain. Part D dispensing for an opioid or nonsteroidal anti-inflammatory drug (NSAID) within 30 days of persistent pain onset was identified. Information on resident and facility characteristics was obtained from MDS and OSCAR records. Associations between resident and facility attributes and pain treatment were estimated using multilevel mixed-effects logistic regression analyses.
RESULTS:
Of the study sample of 18,526 residents with persistent pain, 3,094 (16.7%) did not receive prescription analgesics, 12,815 (69.2%) received a prescription opioid, 485 (2.6%) received a prescription NSAID, and 2,132 (11.5%) received a prescription opioid and NSAID. After adjusting for potentially confounding covariates, residents who were older (≥95, odds ratio (OR) = 2.06, 95% confidence interval (CI) = 1.70–2.49), more cognitively impaired (moderately severe cognitive impairment, OR = 2.12, 95% CI = 1.71–2.62), or black (OR = 1.20, 95% CI = 1.03–1.39) or Asian (OR = 1.97, 95% CI = 1.22–3.20) were less likely to receive a prescription analgesic.
CONCLUSION:
Through 2008, pain remained under-treated in NHs, especially in certain subpopulations, including cognitively impaired and older residents. Changes in pain management practice and policies may be necessary to target these vulnerable residents.
Keywords: nursing homes, persistent pain, prescription opioids, health disparities
Nursing home (NH) care is critical for the health of millions of people in the United States. Nearly 3 million Americans aged 65 and older resided in a NH at some point in 2009,1 and more elderly adults will reside in NHs as the U.S. population grows.
Many elderly NH residents have significant diseases and debilitating conditions, including persistent pain.2 Prior studies suggest that between 45% and 80% of residents experience some degree of pain that impairs functioning and quality of life3 and that, depending on duration and intensity threshold, 5% to 49% of residents have persistent noncancer pain.2,4,5 The high prevalence of age-related conditions in elderly adults, such as arthritis, musculoskeletal disorders, and peripheral vascular diseases, is the source of this common pain experience.6 Pain in older individuals can adversely affect their physical functioning, mental health, social engagement, and quality of life and lead to greater healthcare use and costs.7–10
Analgesics, including acetaminophen, nonsteroidal anti-inflammatory drugs (NSAIDs), and opioids, are an important component of effective pain management for moderate to severe pain, but evidence suggests that 25% to 40% of NH residents with noncancer pain do not receive analgesics.2,6,11,12 In addition, treatment may lag behind for more-vulnerable subpopulations13,14 in NHs and at specific types of facilities.15 For example, studies suggest that nonwhite, older, and cognitively impaired residents are less likely to receive analgesics for noncancer11,12 and cancer16,17 pain. Certain facility characteristics, such as profit status,15 staffing levels,18 and payer mix,19 have also been associated with resident quality of care. Because of troubling shortcomings in pain management and disparities in treatment, Institute of Medicine reports in 2001 and 2011 and professional societies have encouraged more-appropriate analgesic prescribing for NH residents in pain.7,20,21
Many studies assessing analgesic prescribing for noncancer pain in NH residents have used data collected before 2001.2,6,11 A more-recent study assessed noncancer pain prevalence in a NH population from 2007 to 2009, but the study population was taken predominantly from one for-profit NH chain.12 In addition, the treatment disparities that these studies have assessed were limited to individual resident functioning and clinical factors. Furthermore, studies assessing NH disparities at the facility level did not examine analgesic treatments for pain.15,18,19 The aim of the current study was to close the gap in these research findings in a comprehensive national NH population and assess disparities in pain treatments, including according to socioeconomic factors and facility-level characteristics. Data on NH residents, facilities, and medication prescribing in 2007–08 from the national Minimum Data Set (MDS); the Online Survey, Certification, and Reporting (OSCAR) database; and Medicare Part D were assessed to evaluate the prevalence of analgesic prescribing for elderly NH residents with persistent noncancer pain. Whether certain individual and facility-level factors were associated with no analgesic use for residents with persistent noncancer pain was also assessed.
METHODS
Participants
The source population was the approximately 2.99 million individuals aged 65 and older with an MDS record who resided in U.S. NHs at any time between December 1, 2007, and November 30, 2008.
Inclusion Criteria
The analysis was limited to elderly residents with persistent noncancer pain, defined as moderate to severe pain lasting 3 months or longer.2 Each NH resident is assessed using the MDS at least every 3 months for the frequency and intensity of any pain over the previous 7 days.22 This measurement of frequency and intensity has been found to be valid for measuring pain.23 For the current study, a NH resident was considered to be in persistent pain if he or she had two consecutive MDS reports at least 90 days but no more than 180 days apart recording moderate or severe pain daily during the prior 7-day period. Defining persistent pain onset as the date of the second MDS pain assessment satisfying the persistent pain definition yielded a sample of 59,114 individuals (3.8% of eligible source population).
Exclusion Criteria
Individuals who had cancer, were terminally ill, or had Alzheimer’s disease as recorded in the MDS at persistent pain onset were excluded because of their unique care needs. Residents with severe cognitive impairment, defined as an MDS Cognitive Performance Scale (CPS) score of 5 (severe) or 6 (very severe) and recorded at the point of persistent pain onset under the definition were also excluded (Figure 1) because of the difficulty of accurately assessing their pain levels.14 Individuals who had not resided in the NH for at least 90 continuous days at persistent pain onset, did not have any Part D records during the time period, or resided in hospital-based facilities were also excluded. Data were missing for at least one covariate for 623 of the 19,149 remaining participants (3.3% of the sample), leaving a study sample of 18,526 individuals.
Figure 1.
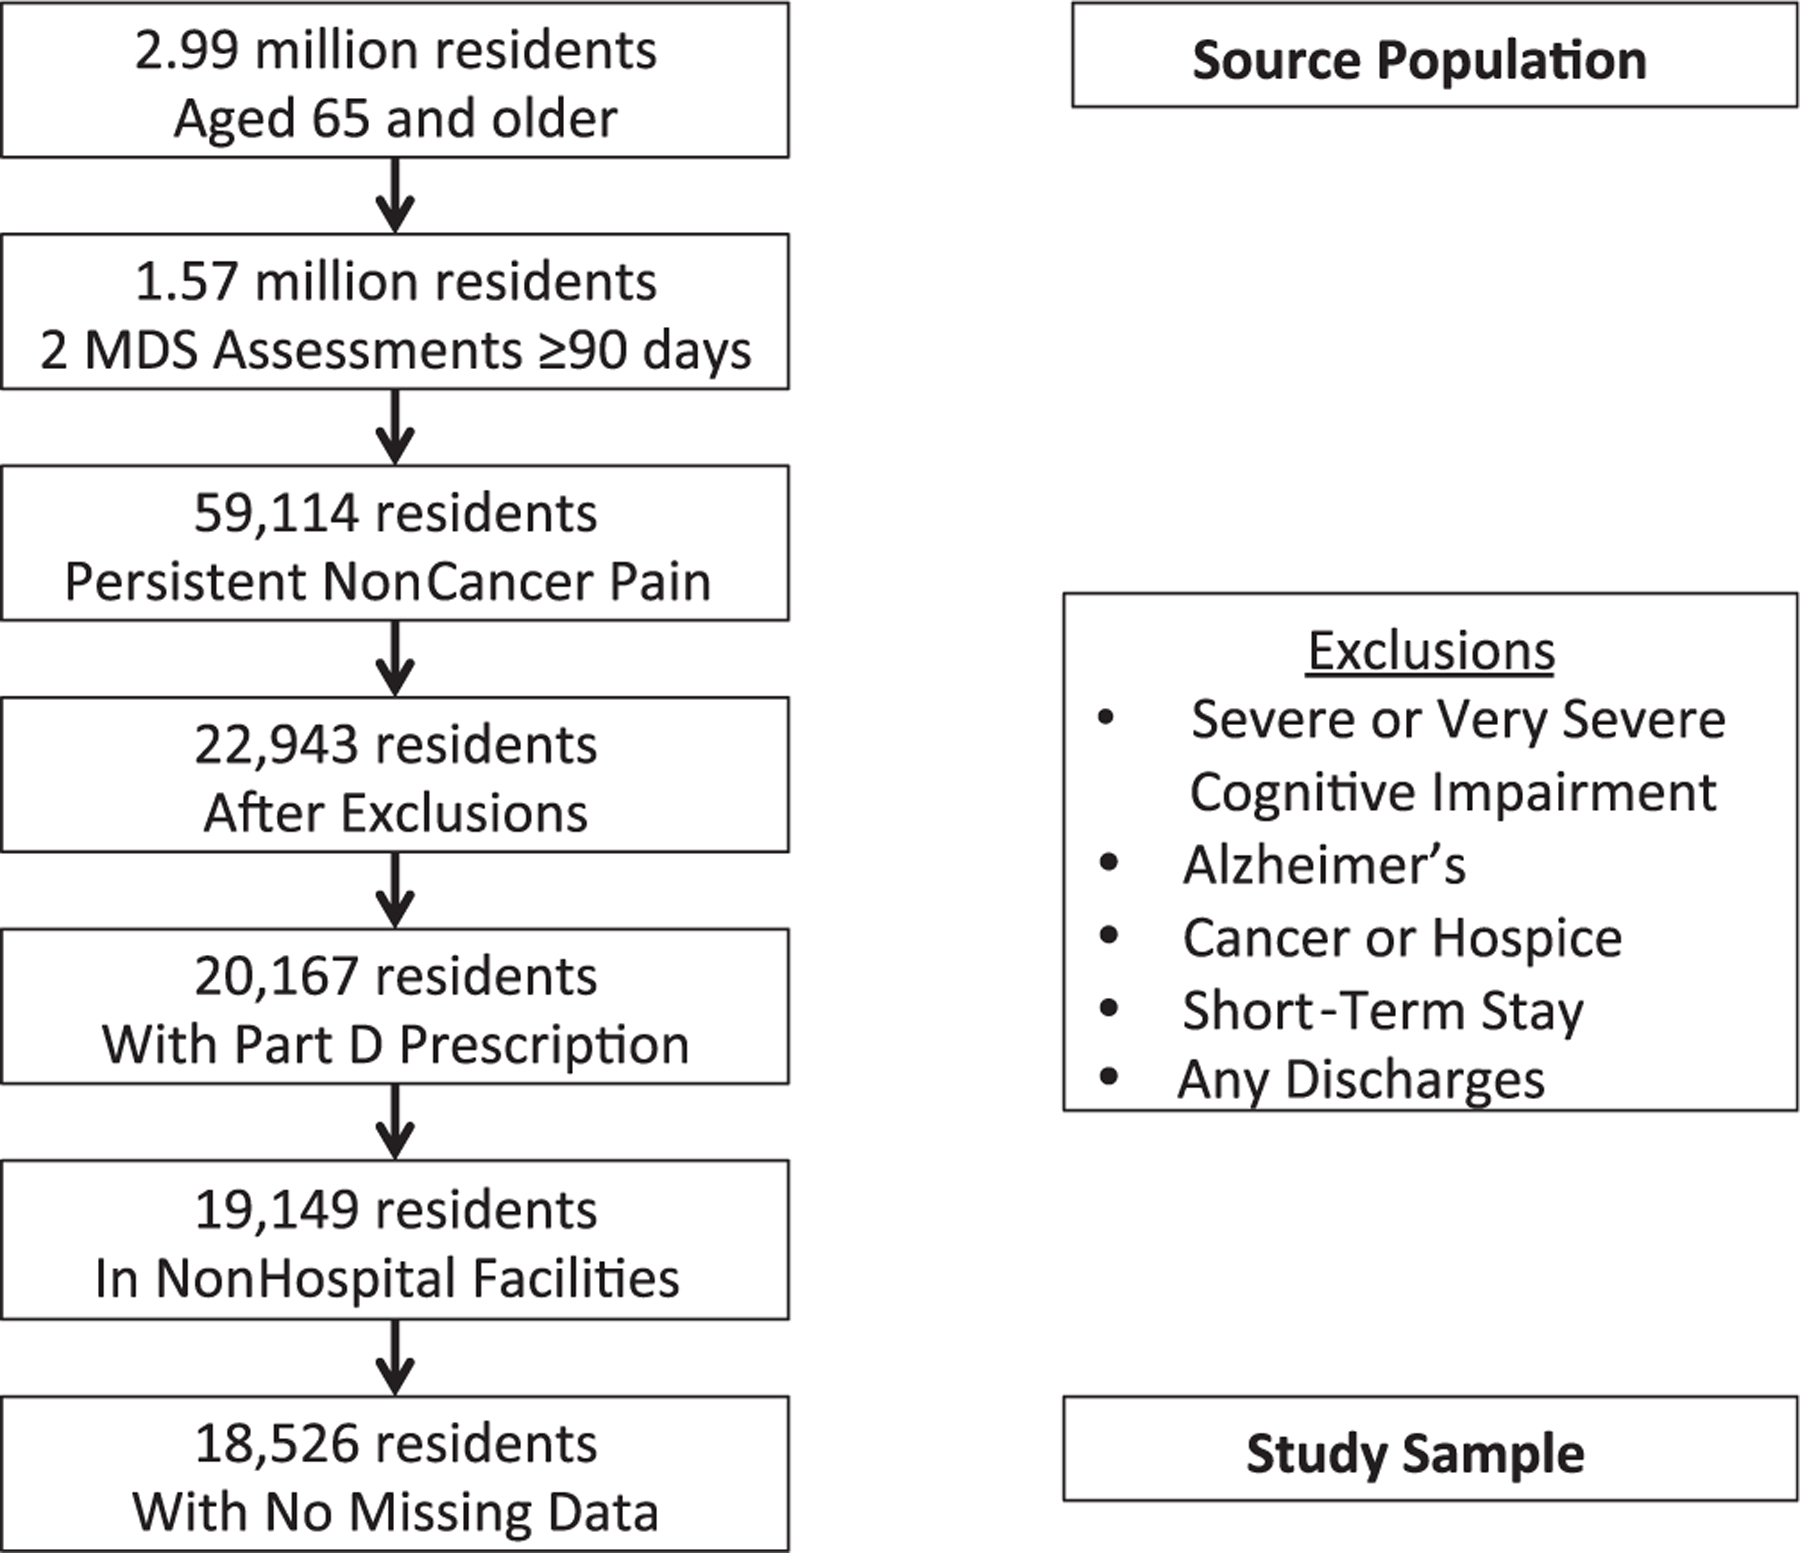
Source population and study sample from Minimum Data Set (2008).
Measures
Data from the MDS, a standardized survey instrument that measures each resident on 15 domains, including pain status, cognitive and physical functioning, psychosocial well-being, and diseases, were analyzed.22 NHs assess each resident annually for all MDS measures, every 3 months for many measures (e.g., cognitive and physical functioning, mood, pain), and when any significant change in resident status occurs.22 The MDS 2.0, which has been found to be generally reliable and valid for measuring domains when trained staff use it, was used.24 MDS 2.0 items have also been incorporated into reliable and valid instruments (e.g., MDS activity of daily living (ADL) scale, MDS Cognitive Performance Scale) to measure resident characteristics such as physical and cognitive functioning.24–26 OSCAR data, which the federal government compiles annually for each NH facility, were also relied on.27
Finally, each resident’s prescription drug use was analyzed using Medicare Part D records.28 This data source was selected because of its comprehensive nature. Medicare Part D became effective in 2006, providing prescription drug coverage to all Medicare beneficiaries who chose to enroll, including NH residents.29 Part D also provides prescription drug coverage for dually eligible residents on Medicare who previously received prescription drugs through Medicaid.29 Approximately 88% of the source population after certain exclusions (20,167/22,943 residents) had a Part D record (Figure 1). Part D also covered prescription pain medications during the study period, such as opioids.30 Part D does not generally cover over-the-counter (OTC) drugs, such as OTC analgesics. Studies in NH populations before Part D implementation have found that large proportions of residents receive OTC analgesics, including for persistent pain,2,31 but the current study focused on the most-substantial (moderate to severe) persistent pain, for which OTC analgesics alone would not be sufficient under practice guidelines.7
Analgesic Prescribing
The primary outcome was whether each resident with persistent noncancer pain had a prescription for an opioid or NSAID. The definition of an opioid prescription included mu agonist opioids (codeine, fentanyl, hydrocodone, hydromorphone, levorphanol, meperedine, methadone, morphine, oxycodone, oxymorphone, propoxyphene), dual-mechanism opioids (tramadol), and prescription drugs with these opioid-active ingredients in combination with other analgesic ingredients (e.g., hydrocodone or oxycodone with acetaminophen). These drugs included different routes of administration (e.g., oral, transdermal). The definition of NSAIDs included the newer cyclooxygenase II inhibitor celecoxib. OTC acetaminophen and NSAIDs were not included in the analgesic definition because Part D does not generally cover OTC drugs, and this study focuses on the most-substantial (moderate to severe) persistent pain. Residents with an opioid or NSAID prescription dated within 30 days before or after persistent pain onset were characterized as receiving analgesic prescriptions. To provide broader context for this medication prescribing, other therapies that might be used as adjuncts to treat pain or underlying conditions associated with pain recorded in the Part D or MDS records within this 60-day window, including drugs such as muscle relaxants, corticosteroids, and gabapentin with pregabalin, as well as physical therapy, were identified.
Covariates
Whether certain individual and facility factors were associated with not having an analgesic prescription was evaluated. For individual factors, based on prior literature, it was hypothesized that older age, poorer cognitive functioning, lower socioeconomic status (SES), and nonwhite race would be associated with less analgesic prescribing.11,12 Cognitive function was measured in the MDS at persistent pain onset based on CPS score (0 (intact) to 4 (moderately severe impairment)). Although residents with Alzheimer’s disease and severe cognitive impairment (CPS score 5 or 6) were excluded from the study population, whether cognitive impairment within the remaining CPS range of 0 to 4 was associated with no analgesic prescribing could still be assessed. SES was measured based on highest completed education level and whether the resident paid for NH services out of pocket (self-pay). For facility factors, based on prior literature, it was hypothesized that a smaller staffing hours-to-resident ratio, fewer private pay residents, and for-profit status would be associated with less analgesic prescribing.15,18,19 These facility measurements were obtained from the most recent OSCAR survey before persistent pain onset.
Potential confounders that could be associated with these individual and facility factors and analgesic prescribing, such as resident sex,11 physical impairment, mood,12 family involvement in care, and facility compliance with federal law, were also identified, based on prior literature where possible. Physical impairment was measured in the most-recent MDS (at or before persistent pain onset) based on degree of assistance needed with ADLs according to the Morris ADL Additive Scale (0 (no help required) to 28 (most help needed));32 mood at the time of persistent pain onset according to the MDS Mood Scale (0 (no mood symptoms) to 8 (most mood symptoms)),33 proxy for family involvement in care based on whether a family member or significant other participated in the most-recent care plan meeting as measured in the MDS assessment at or before persistent pain onset; and compliance with federal law based on whether there were any significant outstanding legal violations of federal NH requirements as recorded in the most-recent OSCAR survey before persistent pain onset.
Statistical Analysis
To test the hypothesis that certain individual and facility factors were associated with analgesic prescribing for residents in persistent noncancer pain, a multivariate logistic regression model was used with no analgesic prescribing as the outcome that included the following predictors: age; race and ethnicity; cognitive function; self-pay status; education level; facility staff hours per resident; facility proportion of self-pay residents; and facility profit status. Each confounder in the model was also included: sex, degree of ADL assistance, MDS Mood Scale, family care involvement, and facility compliance with federal law.
Because residents are clustered within NHs and NHs are clustered within states, random effects (intercepts) were included in the model for these two levels to ensure more-accurate standard errors. Sensitivity analyses were also conducted using more-stringent definitions of persistent pain (e.g., ≥3 consecutive MDS assessments with serious pain at least 90, but no more than 180, days apart) and subgroup analysis in residents with arthritis, diabetes mellitus, back pain, and osteoporosis as recorded in the MDS. Data were analyzed using SAS version 9.2 (SAS Institute, Inc., Cary, NC) and Stata version 13.0 (Stata Corp., College Station, TX). The institutional review board of Johns Hopkins University Bloomberg School of Public Health approved the study; the requirement for individual consent was waived.
RESULTS
Persistent Pain and Analgesic Use
Of the nearly 3 million elderly NH residents in the source population, almost 60% had at least one MDS assessment with some degree of pain, including 22% with at least one episode of moderate or severe pain experienced daily for the prior 7 days. Only 3.8% of eligible residents in the source population (the 1.57 million residents with ≥2 MDS assessments at least 90 days apart) had persistent pain according to the definition (Figure 1). Of the 18,526 residents in the study sample, 16.7% did not receive an analgesic prescription, 81.2% received an opioid drug (alone or in combination with acetaminophen or prescription NSAID), and 2.5% received only a prescription NSAID (Table 1).
Table 1.
Analgesics Prescribed for Study Sample with Persistent Pain (N = 18,526)
| Analgesic | n (%) |
|---|---|
| Prescription opioid only | 3,002 (16.2) |
| Prescription opioid combinations | 11,945 (64.5) |
| Opioid and acetaminophena | 9,813 (53.0) |
| Opioid and NSAIDb | 493 (2.7) |
| Opioid, acetaminophen, and NSAIDc | 1,639 (8.9) |
| Prescription NSAID only | 485 (2.6) |
| No prescription analgesic | 3,094 (16.7) |
Percentages calculated for whole study population.
Prescription opioids are codeine, fentanyl, hydrocodone, hydromorphone, levorphanol, meperedine, methadone, morphine, oxycodone, oxymorphone, propoxyphene, and tramadol.
Prescription drugs with both ingredients.
Prescription nonsteroidal anti-inflammatory drugs (NSAIDs) are aspirin, diclofenac, diflunisal, etodolac, fenoprofen, flurbiprofen, ibuprofen, indomethacin, ketoprofen, ketorolac, meloxicam, nabumetone, naproxen, oxaprozin, piroxicam, sulindac, and tolmetin. This combination consists of separate opioid and NSAID prescriptions.
Prescription drugs with opioid and acetaminophen ingredients in combination with a separate prescription NSAID.
Differences in Characteristics Between NH Residents Prescribed and Not Prescribed an Analgesic
Participants in pain who were not prescribed an analgesic differed from their counterparts in terms of sex, age, race, cognitive impairment, self-pay status, facility hours per resident, facility proportion of self-pay residents, facility profit status, physical impairment, mood, and family support (all P ≤ .001) (Table 2). For example, 24.1% of the oldest residents (≥95) were not prescribed an analgesic, nearly double the proportion (12.6%) of the youngest residents (65–75). Similarly, 25.6% of the most cognitively impaired (CPS score 4) were not prescribed an analgesic, nearly double the proportion of cognitively intact residents (13.1%). A small percentage of residents not receiving any prescription analgesic received other drugs that may have been prescribed for pain (muscle relaxant, 3.9%; corticosteroid, 5.7%; gabapentin or pregabalin, 10.5%), and 8.6% received at least 1 day of physical therapy (Table 3).
Table 2.
Characteristics of Nursing Home Study Sample in Persistent Pain in 2008 According to Analgesic Prescribing (N = 18,526)
| Characteristic | Prescription Opioid or NSAID, n = 15,432 (83.3%), n (%) | No Prescription Opioid or NSAID, n = 3,094 (16.7%), n (%) | Chi-Square Statistic P-Value |
|---|---|---|---|
| Sex | <.001 | ||
| Female | 12,659 (83.9) | 2,422 (16.1) | |
| Male | 2,773 (80.5) | 672 (19.5) | |
| Age | <.001 | ||
| 65–74 | 3,787 (87.4) | 546 (12.6) | |
| 75–84 | 5,791 (84.3) | 1,076 (15.7) | |
| 85–94 | 5,057 (80.1) | 1,219 (19.4) | |
| ≥95 | 797 (75.9) | 253 (24.1) | |
| Race | <.001 | ||
| White | 13,415 (83.8) | 2,599 (16.2) | |
| Black | 1,367 (80.2) | 337 (19.8) | |
| Hispanic | 493 (81.1) | 115 (18.9) | |
| Asian | 76 (71.0) | 31 (29.0) | |
| Other | 81 (87.1) | 12 (12.9) | |
| Cognitive Performance Scale score | <.001 | ||
| 0 (intact) | 4,317 (86.9) | 652 (13.1) | |
| 1 (borderline intact) | 3,141 (85.7) | 523 (14.3) | |
| 2 (mild impairment) | 3,427 (82.4) | 731 (17.6) | |
| 3 (moderate impairment) | 3,984 (80.0) | 994 (20.0) | |
| 4 (moderately severe impairment) | 563 (74.4) | 194 (25.6) | |
| Resident self-pay | <.001 | ||
| No | 13,720 (84.1) | 2,586 (15.9) | |
| Yes | 1,712 (77.1) | 508 (22.9) | |
| Education | .15 | ||
| <High school graduate | 5,909 (83.7) | 1,145 (16.2) | |
| High school graduate | 8,586 (83.2) | 1,737 (16.8) | |
| ≥College | 937 (81.6) | 212 (18.5) | |
| Staff hours per resident per day | .001 | ||
| <2.5 | 1,713 (79.2) | 308 (20.8) | |
| 2.5–3.0 | 2,597 (83.2) | 523 (16.8) | |
| 3.0–3.5 | 4,473 (83.5) | 882 (16.5) | |
| 3.5–4.0 | 3,772 (84.1) | 712 (15.9) | |
| 4.0–4.5 | 2,047 (84.0) | 391 (16.0) | |
| >4.5 | 1,370 (83.1) | 278 (16.9) | |
| Facility proportion of self-pay residents, % | <.001 | ||
| <10 | 2,799 (81.8) | 624 (18.2) | |
| 10–29 | 8,957 (84.3) | 1,665 (15.7) | |
| 30–49 | 2,931 (83.0) | 599 (17.0) | |
| ≥50 | 745 (78.3) | 206 (21.7) | |
| For-profit facility | |||
| No | 4,310 (81.5) | 976 (18.5) | |
| Yes | 11,122 (84.0) | 2,118 (16.0) | |
| Number of activities of daily living need assistance with (Morris Additive Scale) | <.001 | ||
| 0 | 1,291 (86.2) | 206 (13.8) | |
| 1–7 | 2,972 (85.1) | 521 (14.9) | |
| 8–14 | 3,482 (83.5) | 690 (16.5) | |
| 15–21 | 5,396 (82.7) | 1,129 (17.3) | |
| 22–28 | 2,291 (80.7) | 548 (19.3) | |
| Minimum Data Set Mood Scale score | <.001 | ||
| 0 | 7,568 (81.9) | 1,669 (18.1) | |
| 1–2 | 3,829 (83.6) | 751 (16.4) | |
| 3–4 | 2,847 (85.8) | 473 (14.3) | |
| 5–6 | 1,043 (85.4) | 178 (14.6) | |
| 7–8 | 145 (86.3) | 23 (13.7) | |
| Family care involvement | <.001 | ||
| No | 8,652 (84.4) | 1,603 (15.6) | |
| Yes | 6,780 (82.0) | 1,491 (18.0) | |
| Facility compliant with federal law | .82 | ||
| Yes | 13,644 (83.3) | 2,731 (16.7) | |
| No | 1,788 (83.1) | 363 (16.9) |
NSAID = nonsteroidal anti-inflammatory drug.
Table 3.
Additional Treatments or Medications for Nursing Home Residents in Persistent Pain in 2008 According to Analgesic Prescribing (N = 18,526)
| Treatment | Received Prescription Opioid or NSAID, n = 15,432, n (%) | Did Not Receive Prescription Opioid or NSAID, n = 3,094, n (%) | Chi-Square Statistic P-Value |
|---|---|---|---|
| Muscle relaxant | <.001 | ||
| No | 14,034 (90.9) | 2,972 (96.1) | |
| Yes | 1,398 (9.1) | 122 (3.9) | |
| Corticosteroid | <.001 | ||
| No | 13,856 (89.8) | 2,917 (94.3) | |
| Yes | 1,576 (10.2) | 177 (5.7) | |
| Gabapentin with pregabalin | <.001 | ||
| No | 11,392 (73.8) | 2,668 (86.2) | |
| Yes | 4,040 (26.2) | 425 (13.7) | |
| Antidepressant | <.001 | ||
| No | 4,806 (31.1) | 1,591 (51.4) | |
| Yes | 10,626 (68.9) | 1,503 (48.6) | |
| Antipsychotic | .07 | ||
| No | 12,320 (79.8) | 2,515 (81.3) | |
| Yes | 3,112 (20.2) | 579 (18.7) | |
| Mood stabilizer, anticonvulsant | <.001 | ||
| No | 11,222 (72.7) | 2,607 (84.3) | |
| Yes | 4,210 (27.3) | 487 (15.7) | |
| Antianxiety | <.001 | ||
| No | 14,857 (96.3) | 3,030 (97.9) | |
| Yes | 575 (3.7) | 64 (2.1) | |
| Physical therapy (≥1 days)a | .27 | ||
| No | 11,318 (92.0) | 2,338 (91.4) | |
| Yes | 982 (8.0) | 221 (8.6) |
NSAID = nonsteroidal anti-inflammatory drug.
Excluded 3,667 (19.8%) observations without physical therapy recorded.
Characteristics Associated with No Analgesic Prescribing for NH Residents
Many individual factors were associated with absence of prescription analgesic treatment (Table 4). In fully adjusted models, after accounting for mood, physical impairment, family involvement in care, and facility compliance with federal law, residents had greater odds of no analgesic prescribed if they were older (75–84: OR = 1.30, 95% CI = 1.16–1.47; 85–94: OR = 1.63, 95% CI = 1.44–1.85; ≥95: OR = 2.06, 95% CI = 1.70–2.49 vs 65–74), more cognitively impaired (borderline intact: OR = 1.11, 95% CI = 0.97–1.27; mild impairment: OR = 1.31, 95% CI = 1.15–1.49; moderate impairment: OR = 1.61, 95% CI = 1.42–1.83; moderately severe impairment: OR = 2.12, 95% CI = 1.71–2.62 vs intact), and Asian (OR = 1.97, 95% CI = 1.22–3.20 vs white) or black (OR = 1.20, 95% CI = 1.03–1.39 vs white). Residents with higher SES (self-pay and ≥college education) had greater odds of not receiving prescription analgesics.
Table 4.
Odds of Not Receiving a Prescription Pain Medicine: Multivariate Model (N = 18,526)
| Characteristic | Odds Ratio (95% Confidence Interval) | P-Value |
|---|---|---|
| Male | 1.38 (1.24–1.53) | <.001 |
| Age (reference 65–74) | ||
| 75–84 | 1.30 (1.16–1.47) | <.001 |
| 85–94 | 1.63 (1.44–1.85) | <.001 |
| ≥95 | 2.06 (1.70–2.49) | <.001 |
| Race (reference white) | ||
| Black | 1.20 (1.03–1.39) | .02 |
| Hispanic | 1.07 (0.84–1.35) | .60 |
| Asian | 1.97 (1.22–3.20) | .006 |
| Other | 0.94 (0.48–1.82) | .85 |
| Cognitive Performance Scale score (reference 0 (intact)) | ||
| 1 (borderline intact) | 1.11 (0.97–1.27) | .12 |
| 2 (mild impairment) | 1.31 (1.15–1.49) | <.001 |
| 3 (moderate impairment) | 1.61 (1.42–1.83) | <.001 |
| 4 (moderately severe impairment) | 2.12 (1.71–2.62) | <.001 |
| Resident self-pay | 1.40 (1.23–1.59) | <.001 |
| Education level (reference <high school graduate) | ||
| High school graduate | 1.10 (1.01–1.21) | .04 |
| ≥College | 1.22 (1.02–1.46) | .03 |
| Staff hours per resident per day (reference <2.5) | ||
| 2.5–3.0 | 0.80 (0.67–0.98) | .03 |
| 3.0–3.5 | 0.83 (0.69–0.99) | .04 |
| 3.5–4.0 | 0.80 (0.66–0.97) | .02 |
| 4.0–4.5 | 0.81 (0.66–1.01) | .06 |
| >4.5 | 0.81 (0.64–1.02) | .07 |
| Facility proportion of self-pay residents, % (reference <10) | ||
| 10–30 | 0.80 (0.71–0.91) | .001 |
| 30–50 | 0.77 (0.66–0.91) | .002 |
| >50 | 0.91 (0.72–1.16) | .45 |
| For-profit facility | 0.91 (0.81–1.01) | .08 |
Multivariate logistic regression model using multilevel modeling at the state and facility levels adjusted for sex, age, race, cognitive impairment, resident self-pay status, education, facility average staff hours per resident, facility percentage of residents who self-pay, facility profit status, resident number of activities of daily living requiring help on Morris Additive scale, resident score on Minimum Data Set mood scale, resident family care involvement, and facility compliance with federal law.
Few facility factors were statistically significantly associated with analgesic prescribing, except that analgesic use was less likely in residents in facilities that had 10% to 30% self-pay residents than in facilities with fewer than 10% self-pay residents or in those that had an average of 2.5 to 4.0 staff hours per resident per day than in those with fewer than 2.5 hours per resident per day.
In sensitivity analyses using different definitions of persistent pain and subgroup analysis of residents with arthritis and other conditions, older age, greater cognitive impairment, and self-pay status were statistically significantly associated with no analgesic prescribing.
DISCUSSION
This analysis of individual-level, nationally representative data capturing NH resident care found that nearly 17% of residents with persistent noncancer pain, defined as moderate to severe daily pain over at least a 3-month period, did not receive prescription analgesics. More-vulnerable NH residents, particularly older and more cognitively impaired residents, were also less likely to receive prescription analgesics than their counterparts. These findings suggest continuing inadequacies in NH pain treatment, at least through 2008.
Persistent Pain and Analgesic Use
The finding that almost 60% of the nearly 3 million residents in the source population experienced some degree of pain and that nearly 4% of eligible residents (with ≥2 MDS assessments at least 90 days apart) had persistent pain, are consistent with prior studies assessing pain prevalence using the MDS. These studies, depending on their pain definition, identified pain prevalence in NH residents of between 4% and 64%.6,34 The current study’s 4% prevalence finding was lower because it used a higher pain threshold (moderate to severe daily pain). One study found that 4.8% of NH residents had pain daily on two consecutive MDS assessments within 120 days.5
The current study also found that 16.7% of residents in the study population were not prescribed any analgesics (opioid, NSAID, acetaminophen). This figure is lower than prior studies using the MDS, which have found that 23% to 25% of residents with noncancer pain did not receive analgesics.2,11,12 A greater percentage of the current study population may have received prescription analgesics because their pain levels were more intense (moderate to severe daily pain rather than any daily pain) and over a longer duration (≥2 consecutive MDS assessments ≥90 days apart), but because of this greater intensity and duration, the lack of any analgesic prescribing for nearly 17% of these residents with persistent pain is troubling.
Factors Associated with No Analgesic Prescribing
The oldest residents, those with cognitive impairment, and black and Asian residents were less likely to receive analgesia than their counterparts. This study expands on similar findings from prior studies of individuals with noncancer11,12 and cancer16,17 pain to a more-recent national NH population with persistent noncancer pain. These conclusions raise important concerns about disparities in treatment of vulnerable subpopulations in NHs. For some of the oldest residents (particularly those aged ≥95), NH practitioners may choose not to prescribe analgesics for persistent pain because of greater risks of adverse effects, a point it was not possible to study here, but it is imperative that alternative therapies be provided to these residents.
The finding that residents with higher SES (self-pay, ≥college education) have greater odds of not receiving prescription analgesics is the opposite from the hypothesis. This result may indicate that residents who cannot pay for NH charges on their own but receive formal assistance (e.g., Medicaid) may receive better pain management care, but this possible explanation must be explored further. Alternatively, residents who self-pay may have shorter stays in the NH than those who have depleted their savings and require payment assistance. So shorter length of stay being associated with no analgesic prescribing might actually explain the finding that self-pay residents were less likely to receive prescription analgesics. In addition, a NH resident’s education level may be less influential for care in the NH after controlling for family support.
For facility characteristics, the increasing proportion of self-pay residents (for the 10–30% and 30–50% categories vs the <10% category) was statistically significantly associated with lower odds of no analgesic prescribing (equivalent to greater odds of prescribing), consistent with the hypothesis. Another study found that NH facilities with fewer than 10% private pay residents and more than 85% Medicaid residents had poorer quality of care.19 There also appears to be an association between more staff hours per resident and greater analgesic prescribing (odds decrease for no analgesic prescribing), which peaks at the 3.5 to 4.0 staff hours per resident level, although a recent systematic review cautioned against overreliance on staff numbers in assessing NH care quality because of the importance of other staffing factors, such as turnover rates and levels of preparation.18 Despite the current study’s hypothesis, no statistically significant association was found between profit status and analgesic prescribing.
Strengths and Limitations
This study has important strengths, particularly the generalizability of the results because the study sample was drawn from the total population of NH residents in the United States. This national scope is a critically distinctive factor in how the findings build on earlier research. In addition, the measures were based on comprehensive NH (MDS and OSCAR) and prescribing (Part D) data. Essential research needs were addressed that the Institute of Medicine (IOM) has identified to estimate the extent of analgesic prescribing for NH residents in persistent pain and to identify specific subpopulations that are less likely to receive analgesics. This study improves upon prior knowledge because individual and facility-level factors, including SES, were examined, and potential confounders, including whether residents had family involvement in care and whether the facility was in compliance with federal law, were controlled for. The results confirm and expand upon the prior research findings. These results were similar in the sensitivity analysis using a stricter definition of persistent pain.
The study also has important limitations. First, because the data were more than 7 years old, the findings may not reflect current NH practices. In 2009, just after the study period, the American Geriatrics Society updated its clinical practice guidelines for pain management,7 and the American Medical Directors Association published a practice guideline for pain management in NHs in 2011.35 Because the study period was several years after the 2001 IOM report urging improvements in NH pain management, the study was able to build on earlier research findings in populations predating the report. In addition, the study provides important baseline findings for additional analyses in later populations, particularly to assess the effect of the updated pain management guidelines.
Second, clinicians might consider some individual residents to be in persistent pain before 90 days have elapsed. These residents would be excluded from the study population if they did not have a second MDS assessment. Because treatment of these residents might have been prescribed after their first MDS assessment used to define persistent pain, the findings could underestimate analgesic use for persistent pain. Third, because the MDS assessment was used to assess NH quality, measures associated with poorer quality care (particularly pain) may be underreported,36 although residents with persistent pain who were excluded from the study population because of underreporting may have had lower analgesic prescribing. Fourth, the time lag between MDS measurements prevented pain status from being identified more frequently within the 90-day period. NH MDS assessors may also fail to measure pain accurately. To address any misclassification of persistent pain status, alternative definitions were used in the sensitivity analysis; similar results were found. Finally, data on OTC analgesic use were not available, although under current guidelines, it is likely that OTC analgesics would not be sufficient for those residents at the time of persistent pain onset (their subsequent consecutive MDS assessment with moderate to severe daily pain).7
Implications for Research and Practice
Additional research is needed to further elucidate these findings. First, because pain has many possible causes that may require different therapeutic approaches,3 additional studies should examine residents with specific types of health conditions and pain experiences more closely. Some subgroups were examined in this research, such as residents with diabetes mellitus, and results were similar to those from the broader population of NH residents. Second, research should explore the underlying mechanisms for inadequate pain treatment in NHs, particularly how older age, greater cognitive impairment, and minority race can be associated with underuse of prescription analgesics for persistent pain. The mechanisms for disparities are complex and can be grounded in implicit bias on the part of healthcare providers.37,38 Third, researchers should assess methods to more accurately identify residents with persistent pain who should receive prescription analgesics rather than other types of therapies. For example, some residents in the study population might not have been suitable candidates for opioids or NSAIDs. Physical therapy, which might be appropriate for some underlying conditions causing pain, and other drugs with possible uses for pain treatment were examined, but there are other approaches that NHs could use that were not captured in the data, such as comfort measures and social support.39 Fourth, research should explore other factors that might confound the association between the hypothesized individual and facility-level covariates and analgesic prescribing. For example, the proxy variable, family participation in care meetings, may not accurately measure family involvement in care or adequately control for confounding. Operationalizing resident SES according to self-pay status could also be problematic.
Based on these findings, changes in NH pain practices may be needed. Many recent efforts have focused on improving NH pain care and have emphasized multimodal approaches incorporating better pain assessment methods, better communication between staff and clinicians, pharmacological and nonpharmacological treatments, and training and education.40–42 For example, one initiative in 49 long-term care facilities increased the proportion of residents in pain receiving analgesics from 83% (similar to the current study prevalence) to 90%.42 In the current study, many residents received a prescription analgesic in the 30-day window before they experienced persistent pain under the definition (subsequent MDS measurement with moderate or severe daily pain). This timing of analgesic prescribing suggests that the analgesics may have been ineffective for many of these residents in pain. It was also found that residents who received a prescription analgesic were more likely to receive other pain medicines, which raises concerns about polypharmacy. Exploring alternative pain therapies is particularly important because of risks from opioid drugs and the need for more evidence on the safety and effectiveness of long-term use, particularly in elderly adults.7 The current study findings indicate that NHs and professional associations should explore these options for pain care further, including for vulnerable subpopulations.
CONCLUSION
These findings from a study sample drawn from all U.S. NH residents in 2008 indicate that a large proportion of NH residents with persistent pain did not receive prescription analgesic therapy. Certain resident factors, particularly being older and more cognitively impaired, were associated with lower analgesic prescribing rates for persistent pain. These results support the need for ongoing efforts by NHs and professional societies to improve analgesic prescribing for residents in persistent pain, including greater focus on these more-neglected subpopulations.
ACKNOWLEDGMENTS
Dr. Fain was supported as a Sommer Scholar at the Johns Hopkins University Bloomberg School of Public Health during the time of this study. Dr. Alexander is supported by the Agency for Healthcare Research and Quality (RO1 HS0189960) and the National Heart, Lung, and Blood Institute (R01 HL107345).
Footnotes
Sponsor’s Role: The funding sources had no role in the design or conduct of the study, analysis or interpretation of the data, or preparation or final approval of the manuscript before publication.
Conflict of Interest: None.
REFERENCES
- 1.U.S. Centers for Medicare and Medicaid Services. National Nursing Home Compendium—2010 Edition Washington, DC: Centers for Medicare and Medicaid Services, 2010. [Google Scholar]
- 2.Won A, Lapane KL, Vallow S et al. Persistent nonmalignant pain and analgesic prescribing patterns in elderly nursing home residents. JAGS 2004;52:867–874. [DOI] [PubMed] [Google Scholar]
- 3.Winn PAS, Dentino AN. Effective pain management in the long-term care setting. J Am Med Dir Assoc 2004;5:342–352. [PubMed] [Google Scholar]
- 4.Teno J, Weitzen S, Wetle T et al. Persistent pain in nursing home residents. JAMA 2001;285:2081. [DOI] [PubMed] [Google Scholar]
- 5.Lapane KL, Quilliam BJ, Chow W et al. The association between pain and measures of well-being among nursing home residents. J Am Med Dir Assoc 2012;13:344–349. [DOI] [PubMed] [Google Scholar]
- 6.Takai Y, Yamamoto-Mitani N, Okamoto Y et al. Literature review of pain prevalence among older residents of nursing homes. Pain Manag Nurs 2010;11:209–223. [DOI] [PubMed] [Google Scholar]
- 7.American Geriatrics Society. Pharmacological management of persistent pain in older adults. J Am Geriatr Soc 2009;57:1331–1346. [DOI] [PubMed] [Google Scholar]
- 8.Patel KV, Guralnik JM, Dansie EJ et al. Prevalence and impact of pain among older adults in the United States: Findings from the 2011 National Health and Aging Trends Study. Pain 2013;154:2649–2657. [DOI] [PMC free article] [PubMed] [Google Scholar]
- 9.Patel KV, Phelan EA, Leveille SG et al. High prevalence of falls, fear of falling, and impaired balance in older adults with pain in the United States: Findings from the 2011 National Health and Aging Trends Study. J Am Geriatr Soc 2014;62:1844–1852. [DOI] [PMC free article] [PubMed] [Google Scholar]
- 10.Tse MM, Wan VT, Vong SK. Health-related profile and quality of life among nursing home residents: Does pain matter? Pain Manag Nurs 2013;14:e173–e184. [DOI] [PubMed] [Google Scholar]
- 11.Won A, Lapane K, Gambassi G. Correlates and management of nonmalignant pain in the nursing home. J Am Geriatr Soc 1999;47:1–7. [DOI] [PubMed] [Google Scholar]
- 12.Lapane KL, Quilliam BJ, Chow W et al. Pharmacologic management of non-cancer pain among nursing home residents. J Pain Symptom Manage 2013;45:33–42. [DOI] [PubMed] [Google Scholar]
- 13.Luo H, Zhang X, Cook B et al. Racial/ethnic disparities in preventive care practice among U.S. nursing home residents. J Aging Health 2014;26:519–539. [DOI] [PubMed] [Google Scholar]
- 14.Reynolds KS, Hanson LC, DeVellis RF et al. Disparities in pain management between cognitively intact and cognitively impaired nursing home residents. J Pain Symptom Manage 2008;35:388–396. [DOI] [PubMed] [Google Scholar]
- 15.Comondore VR, Devereaux PJ, Zhou Q et al. Quality of care in for-profit and not-for-profit nursing homes: Systematic review and meta-analysis. BMJ 2009;339:b2732. [DOI] [PMC free article] [PubMed] [Google Scholar]
- 16.Bernabei R, Gambassi G, Lapane K et al. Management of pain in elderly patients with cancer. JAMA 1998;279:1877–1882. [DOI] [PubMed] [Google Scholar]
- 17.Pimentel CB, Briesacher BA, Gurwitz JH et al. Pain management in nursing home residents with cancer. J Am Geriatr Soc 2015;63:633–641. [DOI] [PMC free article] [PubMed] [Google Scholar]
- 18.Spilsbury K, Hewitt C, Stirk L et al. The relationship between nurse staffing and quality of care in nursing homes: A systematic review. Int J Nurs Stud 2011;48:732–750. [DOI] [PubMed] [Google Scholar]
- 19.Mor V, Zinn J, Angelelli J et al. Driven to tiers: Socioeconomic and racial disparities in the quality of nursing home care. Milbank Q 2004;82:227–256. [DOI] [PMC free article] [PubMed] [Google Scholar]
- 20.Institute of Medicine. Relieving Pain in America: A Blueprint for Transforming Prevention, Care, Education, and Research Washington, DC: National Academies Press, 2011. [PubMed] [Google Scholar]
- 21.Institute of Medicine. Improving the Quality of Long-Term Care Washington, DC: National Academies Press, 2001. [PubMed] [Google Scholar]
- 22.U.S. Centers for Medicare and Medicaid Services. Resident Assessment Instrument 2.0 Manual Washington, DC: Centers for Medicare and Medicaid Services, 2002. [Google Scholar]
- 23.Fries BE. Pain in U.S. nursing homes: Validating a pain scale for the minimum data set. Gerontologist 2001;41:173–179. [DOI] [PubMed] [Google Scholar]
- 24.Mor V A Comprehensive clinical assessment tool to inform policy and practice. Med Care 2004;42(Suppl):III-50–III-59. [DOI] [PubMed] [Google Scholar]
- 25.Carpenter GI, Hastie CL, Morris JN et al. Measuring change in activities of daily living in nursing home residents with moderate to severe cognitive impairment. BMC Geriatr 2006;6:7. [DOI] [PMC free article] [PubMed] [Google Scholar]
- 26.Morris JN, Fries BE, Mehr DR et al. MDS Cognitive Performance Scale. J Gerontol 1994;49:M176–M182. [DOI] [PubMed] [Google Scholar]
- 27.Kash BA, Hawes C, Phillips CD. Comparing staffing levels in the Online Survey Certification and Reporting (OSCAR) system with the Medicaid cost report data: Are differences systematic? Gerontologist 2007;47:480–489. [DOI] [PubMed] [Google Scholar]
- 28.U.S. Centers for Medicare and Medicaid Services. CMS Guide to Requests for Medicare Part D Prescription Drug Event (PDE) Data Washington, DC: Centers for Medicare and Medicaid Services, 2008. [Google Scholar]
- 29.Stevenson DG, Huskamp HA, Keating NL. Medicare Part D and nursing home residents. J Am Geriatr Soc 2007;55:1115–1125. [DOI] [PubMed] [Google Scholar]
- 30.Huskamp HA, Stevenson DG, O’Malley AJ et al. Medicare Part D plan generosity and medication use among dual-eligible nursing home residents. Med Care 2013;51:894–900. [DOI] [PMC free article] [PubMed] [Google Scholar]
- 31.Simoni-Wastila L, Stuart BC, Shaffer T. Over-the-counter drug use by Medicare beneficiaries in nursing homes: Implications for practice and policy. J Am Geriatr Soc 2006;54:1543–1549. [DOI] [PubMed] [Google Scholar]
- 32.Morris JN, Fries BE, Morris SA. Scaling ADLs within the MDS. J Gerontol A Biol Sci Med Sci 1999;54A:M546–M553. [DOI] [PubMed] [Google Scholar]
- 33.Associates Abt. National Nursing Home Quality Measures: User’s Manual, Vol. 1.2 Cambridge, MA: Abt Associates, 2004. [Google Scholar]
- 34.Shen X, Zuckerman IH, Palmer JB et al. Trends in prevalence for moderate-to-severe pain and persistent pain among Medicare beneficiaries in nursing homes, 2006–2009. J Gerontol A Biol Sci Med Sci 2015;70A:598–603. [DOI] [PubMed] [Google Scholar]
- 35.American Medical Directors Association. Pain Management in the Long-Term Care Setting Washington, DC: National Guideline Clearinghouse, 2011. [Google Scholar]
- 36.Hutchinson AM, Milke DL, Maisey S et al. The Resident Assessment Instrument-Minimum Data Set 2.0 quality indicators: A systematic review. BMC Health Serv Res 2010;10:166. [DOI] [PMC free article] [PubMed] [Google Scholar]
- 37.Institute Of Medicine. Unequal Treatment Washington, DC: National Academy of Sciences, 2003. [Google Scholar]
- 38.van Ryn M, Fu SS. Paved with good intentions: Do public health and human service providers contribute to racial/ethnic disparities in health? Am J Public Health 2003;93:248–255. [DOI] [PMC free article] [PubMed] [Google Scholar]
- 39.Makris UE, Abrams RC, Gurland B et al. Management of persistent pain in the older patient: A clinical review. JAMA 2014;312:825–836. [DOI] [PMC free article] [PubMed] [Google Scholar]
- 40.Ersek M, Jablonski A. A mixed-methods approach to investigating the adoption of evidence. J Gerontol Nurs 2014;40:52–60. [DOI] [PMC free article] [PubMed] [Google Scholar]
- 41.Swafford KL, Miller LL, Tsai P-F et al. Improving the process of pain care in nursing homes: A literature synthesis. J Am Geriatr Soc 2009;57:1080–1087. [DOI] [PubMed] [Google Scholar]
- 42.Stevenson KM, Dahl JL, Berry PH et al. Institutionalizing effective pain management practices: Practice change programs to improve the quality of pain management in small health care organizations. J Pain Sympton Manage 2006;31:248–261. [DOI] [PubMed] [Google Scholar]