

Abstract
Pioneering work carried out over 60 years ago discovered that bacterial cell size is proportional to the growth rate set by nutrient availability. This relationship is traditionally referred to as the “growth law”. Subsequent studies revealed the growth law to hold across all orders of life, a remarkable degree of conservation. Recent work, however, suggests the relationship between growth rate, nutrients and cell size is far more complicated and less deterministic than originally thought. Focusing on bacteria and yeast, we review efforts to understand the molecular mechanisms underlying the relationship between growth rate and cell size.
Keywords: Cell size, cell growth, nutrients, metabolism, cell cycle
Nutrients shape the single cell
The ability to tune cell size to meet developmental and environmental needs is essential to microscopic and macroscopic organisms alike. Cell size varies over six orders of magnitude across the tree of life. Equally striking, the cells that make up diverse tissues within a multicellular organism differ in size more than 10-fold [1,2]. While developmental cues influence cell size in multicellular organisms, environmental signals like nutrient availability, also have an impact. Drosophila larvae starved for nutrients produce small adult flies that are built from smaller cells [3]. Starvation of rats also leads to reduced cell size [4]. In mammals, adipose cells classically increase size in response to extra nutrients, a means of storing carbon for leaner times [5].
Nutrients are a primary external modulator of microbial cell size. Metabolically diverse and largely at the mercy of their environment, single-celled microbes are ideal systems in which to probe links between nutrient availability and microbial cell size. Escherichia coli cultured in nutrient rich medium are 3 times larger than when cultured in poor nutrient conditions [6]. Similarly, the size of the budding yeast, Saccharomyces cerevisiae, varies nearly 2-fold with nutrient availability [7]. While the specific means of achieving and maintaining size may differ, size control is a universal feature of life on earth. The principals governing size in “simple” single-celled creatures are fundamentally applicable not only to other microbes but also to cell size in multicellular organisms large and small.
Here, we review recent research into the connections between nutrient availability, growth rate, and cell size in bacteria and yeast. We address not only empirical work, but also important theoretical studies emphasizing the connection between the two complementary approaches. We end with a discussion of open questions for future analysis.
Cell size is proportional to nutrient-imposed growth rate
The relationship between nutrients, growth rate, and cell size was first observed in bacteria [8]. Culturing Salmonella Typhimurium in almost two-dozen different media, Moselio Schaechter, Ole Maaløe, and Niels Kjeldgaard generated mass doubling times ranging between 120 and 20 minutes. Using a Coulter Counter - an instrument that measures cell size via a change in electrical resistance as cells pass through a microchannel - they determined that the size of the cells increases with growth rate, regardless of the composition of the medium used to achieve that growth rate (Figure 1A).
Figure 1. Nutrients modulate microbial size through changes in cell growth and cell cycle progression.

A) Bacterial cell size increases exponentially with increases in nutrient-imposed growth rate B) In yeast and bacteria, signals from biosynthesis modulate the amount of growth required for cell cycle progression. Nutrients directly impact biosynthesis which in turn impacts cell growth and multiple aspects of cell cycle progression (e.g. DNA replication, synthesis of proteins required for DNA replication and division). The ball and stick linking Biosynthesis and Cell cycle progression represents signaling pathways coupling specific metabolic pathways (e.g. UDP glucose synthesis) with specific cell cycle events (e.g. assembly of the cell division machinery) through activation of modulatory proteins.
Nutrient-imposed changes in growth rate similarly influence the size of eukaryotic cells. Early studies in both budding yeast and fission yeast showed that cell size is proportional to the growth rate set by nutrient availability [7,9].
The correlation between nutrient-imposed growth rate and cell size is sufficiently strong that in bacteria the relationship is frequently referred to as the “growth law” (Eg. [6,8]). An oversimplification, this moniker is sometimes misunderstood to mean that growth rate itself dictates cell size. In reality, the situation is more complex. In bacteria, there are a plethora of examples indicating that it is nutrients rather than growth rate that are the primary arbiters of cell size. As Schaechter and colleagues noted, changing growth rate by altering temperature (but keeping medium constant) does not detectably impact bacterial size [8] nor does reducing growth rate through the addition of sublethal concentrations of the transcriptional inhibitor rifampicin [10]. Identification of metabolic mutations that “break” growth law by either reducing size but maintaining nutrient-imposed growth rate or reducing growth rate but maintaining nutrient-imposed cell size [11,12] further highlight the special role that nutrients and metabolic state play as mediators of microbial cell size independent of their contribution to growth rate.
In all cells, cell cycle progression is dependent upon cell growth. It is therefore likely that nutrients modulate size via metabolic signaling pathways that alter the relationship between cell growth and cell cycle progression (Figure 1B). While the impact of nutrient-dependent signaling on cell cycle progression has received the bulk of attention, recent work supports homeostatic control of biosynthetic capacity as an additional contributor to the relationship between growth rate and cell size.
Timers, adders, and sizers: models for cell size control
The regulatory circuits by which nutrients influence cell size most likely work by modulating mechanisms responsible for maintenance of a specific cell size in dividing cells. Three conceptual models for homeostatic control of cell size have emerged over 4 decades of research: “timer”, “sizer” (Figure 2A) and “adder” (Figure 2B). In “timer” models, cells control the duration of growth and initiate cell cycle progression only when sufficient time has passed. Sizer models suggest that cells actively measure a parameter directly related to cell size, such as volume, length, or surface area, and use that information to trigger division. Finally, in adder models a constant amount of material is added during each cell cycle, regardless of the cell’s starting size. (For comprehensive reviews of these models, see [1,13,14]). Based on the observation that cell number and cell mass double at approximately the same time, early studies of bacterial systems favored sizer and timer-based models. This turned out to be incorrect.
Figure 2. Sizer and adder models for cell size control.

A) In a sizer model, cells actively measure a parameter directly related to cell size, such as volume, length, or surface area, and use that information to trigger division. B) In adder models, cells add a constant amount of material (blue) during each cell cycle, regardless of the cell’s starting size. Over time, stochastic variations in cell size are mitigated. The line indicates the position of the division septum. Nutrients positively impact the size of adder. C) Nutrient downshift experiments in fission yeast suggest the presence of a nutrient-dependent size threshold. Cells above the threshold size for cell division in the new nutrient poor conditions immediately undergo cell division, while smaller cells delay division only until they achieve the new threshold size.
Technological advances that permit analysis of single cells over multiple generations have revolutionized our understanding of cell size control and point to adder as the primary mechanism governing bacterial cell size. Observation of tens of thousands of individual bacterial cells revealed that rather than dividing when they double their birth size, bacteria instead add the same volume of material regardless of whether they were “born” larger or smaller than average (Figure 2B) [15–18]. In contrast to a sizer mechanism, which corrects deviations in cell size in a single generation, the adder mechanism gradually corrects size over multiple generations. As we highlight below, in Escherichia coli (E. coli) and Bacillus subtilis (B. subtilis), the predominant Gram-negative and Gram-positive model organisms, homeostatic control of cell size is primarily achieved via accumulation of FtsZ, a tubulin-like protein essential for cell division in bacteria, and potentially other components of the division machinery [19–21].
Within the framework of the adder model, nutrient-imposed changes in cell size are achieved through condition-dependent variations in the volume of material added in each generation. Cells cultured in nutrient rich conditions add more material per generation than those cultured in nutrient poor medium, a finding consistent with the original observations of Schaechter, Maaløe, and Kjeldgaard [8] (Figure 1).
The situation is more complex in eukaryotic cells. Budding yeast undergo growth in multiple distinct intervals during the cell cycle, and each interval is characterized by different rates and patterns of growth [22–24]. Furthermore, fission yeast grow almost exclusively during a prolonged G2 phase that precedes mitosis, whereas budding yeast do most of their growth during mitosis as the daughter bud expands [23]. The extent of growth during these different cell cycle intervals could be governed by different mechanisms. Indeed, timers, sizers and adders have all been proposed to control the extent of growth at various times during the cell cycle in eukaryotic cells [14,25–29]. Currently, cell size at cell cycle entry in budding yeast is thought to be controlled by a sizer. Evidence for a sizer comes from the observation that cells that are born small undergo more growth in G1 phase than cells that are born large, which suggests that attainment of a critical size is required for cell cycle entry [30,31]. Similar evidence suggests that a sizer controls entry into mitosis in fission yeast [32]. In contrast, growth of the daughter bud has been proposed to be controlled by an adder mechanism that measures growth of the plasma membrane [29,33]. However, in each case it has not yet been possible to clearly define molecular mechanisms that could distinguish sizer versus adder models so the mechanisms that control cell size remain poorly understood and controversial.
Although the mechanisms that control size in yeast are poorly understood, it is clear that nutrients impact cell size at multiple points during the cell cycle. In budding yeast, nutrients influence cell size at cell cycle entry and also during bud growth. Thus, cell size at cell cycle entry is correlated with growth rate: rapidly growing cells undergo cell cycle entry at a larger size than slow growing cells [22]. Similarly, the size of the daughter bud at completion of mitosis is correlated with growth rate during the interval of bud growth [23]. Real time analysis of single cells has shown that size remains proportional to growth rate even when growth rate fluctuates between individual yeast cells cultured under identical conditions [22,23]. In other words, stochastically fast-growing cells complete key cell cycle transitions at a size that is larger than their stochastically slow growing counterparts. One might imagine that this as an indirect consequence of fluctuations in growth rate: fast growing cells within a population simply add more volume than slow growing cells. However, adder and sizer models postulate that cells must reach a threshold size or undergo a threshold amount of growth before undergoing cell cycle transitions. In this case, the rate at which cells reach a threshold should not affect the final amount of growth. Thus, the fact that cell size is correlated with growth rate even when cells are growing under identical conditions suggests a more fundamental mechanistic relationship between growth rate and cell size. A potential explanation for this remarkable relationship is that signals that set growth rate also set the threshold amount of growth required for cell cycle progression.
Shift up-shift down: what changing media composition tells us about the relationship between nutrients and cell size
As a companion to their work on the growth law, Kjeldgaard, Schaechter, and Maaløe examined the impact of an abrupt shift from poor to rich nutrients on Salmonella physiology [34]. While increases in rates of RNA synthesis and cell growth occurred essentially instantaneously, it was 70 minutes before cell number substantially increased. This observation suggests that the shift to rich nutrients triggers an increase in the threshold amount of growth required for cell division. Significantly, these data are consistent with modern single cell studies indicating that the volume of material bacteria add in each generation is modulated by nutrients, a variation on the adder model [18].
Nutrient shift experiments have also helped illuminate potential mechanisms governing cell size in yeast. Similar to the classic experiments in bacteria, shifting budding yeast from poor to rich carbon causes an immediate increase in the rate of ribosomal RNA synthesis [35], while cell cycle progression is delayed, presumably to allow cells to reach the new size threshold required for cell cycle progression [7,36,37]. When fission yeast cells growing rapidly in rich nutrient conditions are shifted to nutrient poor conditions, something curious happens. Rather than a pause in cell cycle progression, there is instead a transient increase in the fraction of cells progressing through mitosis [9]. This observation implies that cells above the threshold size for cell division in the new nutrient poor conditions rapidly initiate cell division, while smaller cells delay (Figure 2C). These data suggest 1) a threshold amount of growth is required for entry into mitosis, and 2) the shift to poor nutrients triggers a signal that immediately reduces the threshold.
These experiments provide strong evidence that nutrient dependent changes in cell size are not simply a secondary outcome of changes in growth rate. Instead, it appears that nutrients actively modulate the threshold amount of growth required for cell cycle progression. The rapidity at which size thresholds are reset, in turn, supports the existence of signals that respond to nutrient-dependent changes in central metabolism and transmit this information to the cell cycle machinery. There is good evidence in budding yeast for connections between metabolism, the cell cycle and cell size [38–41].
Accumulation of cell cycle proteins to threshold numbers underlies the adder in E. coli
Bacterial adder behavior can be explained by growth-dependent accumulation of essential proteins that stimulate cell cycle progression once they reach threshold numbers. Two such proteins are DnaA, required for the initiation of DNA replication, and FtsZ, a tubulin-like protein that forms the foundation on which the division machinery is assembled. In the case of both DnaA and FtsZ, replication and division both depend on accumulation of a specific number of molecules at the origin of replication (DnaA) or at the nascent septum (FtsZ). DnaA binds to DNA proximal to the origin of replication, triggering unwinding and strand separation once it reaches threshold numbers. Although FtsZ localizes to the nascent division site early in the cell cycle, cross wall synthesis is coincident with achievement of threshold numbers of FtsZ molecules at this position (Figure 3 Left) [19]. Consistent with a threshold activation model, the concentration of DnaA and FtsZ are essentially constant across a wide range of nutrient conditions, with absolute numbers dictated by cell size [20,42]. In E. coli cultured in severely nutrient-restricted conditions, FtsZ is degraded in a cell cycle-dependent manner resulting in sizer like behavior [43].
Figure 3. Threshold model for division adder in bacteria.
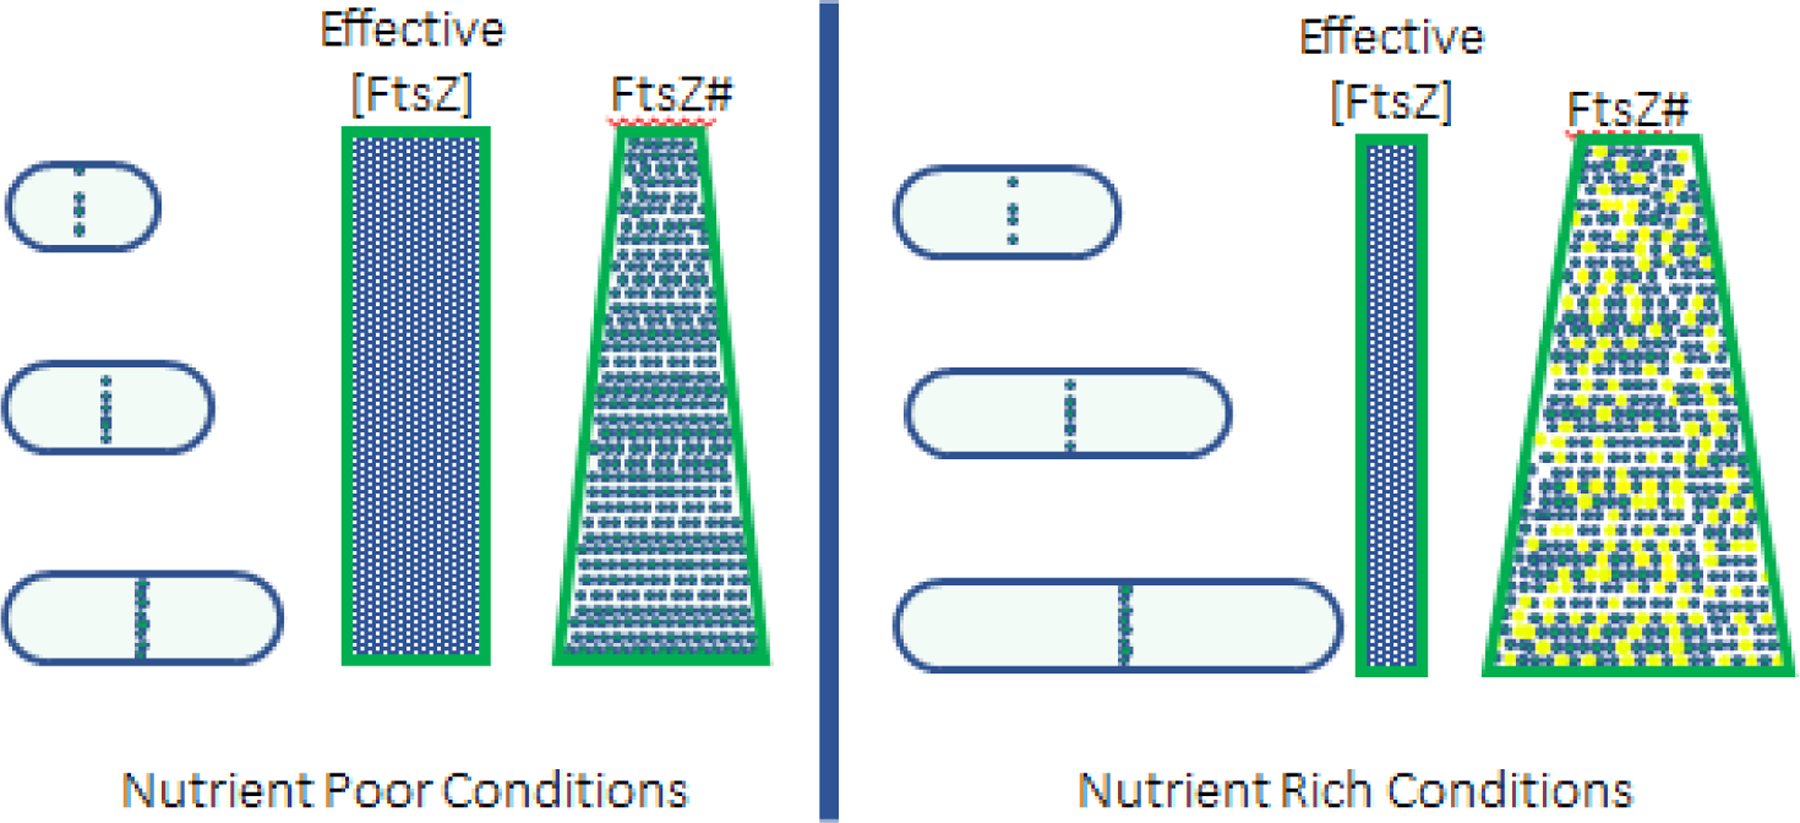
Division is triggered when FtsZ molecules reach threshold numbers at the nascent septum. This threshold system ensures that cells add the same volume of material in each generation. In E. coli and B. subtilis, FtsZ accumulates in a growth dependent manner such that concentration remains constant throughout the cell cycle. The absolute concentration of FtsZ is the same across nutrient conditions supporting mass doubling times of 80 minutes or less. Left: In nutrient poor conditions all FtsZ molecules are “active” and competent for assembly at the division septum resulting in a high effective concentration (rectangle). Bacteria accumulate threshold numbers of FtsZ molecules at a relatively short cell length (triangle). Right: In nutrient rich conditions, nutrient-sensitive inhibitors interact with FtsZ to substantially reduce the effective concentration (rectangle). Blue = active FtsZ. Yellow = inactive FtsZ. Under these conditions, bacteria accumulate threshold numbers of FtsZ at a substantially longer length. Note that FtsZ is used as the example, but any essential division protein that is limiting for division could underlie adder.
Reductions in DnaA or FtsZ concentration—effectively prolonging the time required to accumulate sufficient numbers of protein molecules delays replication initiation and division, dramatically increasing cell length. While two-fold increases in the concentration of either protein reduce cell size to a modest amount ~(10%−20%), reductions in size are far from proportional, suggesting other criteria need to be met prior to proceeding with either initiation or division [19].
Recent work indicates that growth-dependent accumulation of DnaA or FtsZ is sufficient to explain how the adder could work [19]. Engineering cells to artificially modulate DnaA and FtsZ synthesis, Si and colleagues demonstrated that growth-rate independent fluctuations in the concentration of either DnaA or FtsZ alter the amount of material added by individual E. coli and B. subtilis cells each generation. Data support the action of two independent adders in fast growing cells, one functioning at initiation and one at division. Notably, however, the action of the division adder supersedes that of the initiation adder suggesting that division is normally the primary determinant of cell size. This finding is consistent with data from diminutive E. coli mutants, which delay the onset of replication to ensure they have accumulated sufficient DnaA to trigger initiation but divide at a smaller size due to a reduced threshold for FtsZ accumulation [44]. In slow growing cells, degradation of FtsZ by the ClpXP protease leads to sizer-like behavior [43]. Deviation from adder during slow growth was also noted by Wallden and colleagues in experiments examining the timing of origin firing and division in single cells [45]. The existence of multiple mechanisms modulating size at division in both E. coli and B. subtilis provide support for division as a primary integration point for size control [46–48]. In contrast, size at replication initiation is essentially invariant across a wide range of conditions [49]. Although not essential for size control, the initiation adder may help ensure robustness and contribute to coordination between DNA replication and division in bacterial systems.
Nutrient-imposed changes in bacterial cell size are mediated through the adder threshold
An adder dependent on accumulation of a threshold number of cell division proteins provides a straightforward framework from which to understand the impact of nutrient dependent division inhibitors on bacterial size at steady state. Two such inhibitors, the glucosyltransferases, OpgH and UgtP in E. coli and B. subtilis respectively, interact directly with FtsZ to coordinate cell size with carbon availability [47,48]. UDP-glucose, synthesized in two steps from glucose 6-phosphate at the top of glycolysis, binds to both proteins stimulating interaction with FtsZ. The actions of UgtP and OpgH reduce the effective concentration of FtsZ in cells cultured in carbon rich conditions. These cells must grow for a longer period of time - and become significantly larger - to accumulate sufficient FtsZ to support assembly of the division machinery (Figure 3 Right). In carbon poor medium in the absence of UDP-glucose, interaction between UgtP and OpgH and FtsZ is reduced, facilitating assembly of the cytokinetic ring and reducing cell size.
Independent of these direct regulators of cell cycle progression, more passive nutrient-dependent changes in cell morphology are also likely to impact the threshold number of division proteins required for cytokinesis. The diameter of E. coli in particular is 40% greater during growth in nutrient rich medium [6,10], requiring a proportional increase in the size of the cytokinetic ring and the number of division proteins recruited to the nascent septum.
Nutrients modulate requirements for signals from cell cycle control proteins in yeast
Little is known about how nutrients modulate growth thresholds in eukaryotic cells. In budding yeast, levels of early and late G1 phase cyclins are dramatically reduced in poor nutrients [37,50,51]. Since G1 cyclins are the critical inducers of cell cycle entry, this observation suggests that cells in poor nutrients dramatically reduce the level of G1 cyclin activity needed for cell cycle entry, which could help explain how poor nutrients drive a decrease in cell size. The mechanisms by which nutrients modulate the requirement for G1 cyclins have remained enigmatic.
Nutrients also appear to modulate cell cycle thresholds later in the cell cycle. Nutrient modulation of cell size in budding yeast is imposed primarily over an interval of bud growth that occurs during mitosis [23]. Thus, daughter buds in poor nutrients complete mitosis at a smaller size. It has been proposed that bud growth is controlled by an adder that measures growth of the plasma membrane [29]. Two related kinases, Gin4 and Hsl1, are required for normal control of bud growth and are thought to be key components of this mechanism. Homologs of Gin4 and Hsl1 were first discovered in fission yeast, where they were found to be required for nutrient modulation of cell size [9]. Gin4 and Hsl1 undergo gradual hyperphosphorylation and activation during bud growth that appears to be dependent upon bud growth and proportional to the extent of growth, which suggests that they help generate a readout of the extent of growth [29]. Once activated, Gin4 and Hsl1 drive progression through mitosis. The maximal extent of hyperphosphorylation of Gin4 and Hsl1 during bud growth is substantially reduced in poor nutrients. Since kinase activity is proportional to hyperphosphorylation [52], one interpretation of this observation is that the threshold activity of Gin4 and Hsl1 required to drive mitotic progressionn is reduced in poor nutrients, which could allow cells to complete mitosis at smaller bud size. Gin4 and Hsl1 also play roles in a TORC2 signaling network that is required for nutrient modulation of cell size (see below) [53]. However, their roles in the network are poorly understood.
Master regulators of cell growth influence growth rate and cell size
Nutrients also influence cell size directly via changes in biosynthetic capacity. Prokaryotes and eukaryotes encode master regulators responsible for coordinating the diverse biosynthetic pathways that drive cell growth under a wide range of conditions (Figure 4 Left & Right). These regulators sense nutrient status and tune biosynthesis to match the availability of individual nutrients and energy. Homeostatic feedback loops built into growth control networks ensure that a slowdown in one pathway triggers similar reductions in other areas of biosynthesis. For example, there is no point making lots of DNA and RNA under nutrient limiting conditions that restrict protein synthesis. In practice, both growth rate and cell size are dictated by whatever nutrient is limiting in that condition. In bacteria, homeostatic control of biosynthetic capacity is largely governed via changes in synthesis of the alarmone, guanosine tetraphosphate (ppGpp) (Figure 4 Left) (reviewed in [54]). In eukaryotes, TOR kinases and their associated factors are thought to serve a similar function (Figure 4 Right) [55,56]. Not surprisingly, both master regulators have been implicated in nutrient-dependent control of cell size.
Figure 4. Master regulators coordinate biosynthesis to modulate cell growth and size.

Left: In bacteria, guanosine tetraphosphate (ppGpp) is responsible for the homeostatic regulation of biosynthetic capacity in response to changes in nutrient availability and other stressors. Nutrients impact the synthesis and/or accumulation of ppGpp via changes in the activity of synthases and hydrolases (RelA and SpoT respectively in E. coli). ppGpp accumulation ensures that a slowdown in one pathway in response to limitation of a specific nutrient (e.g. nitrogen) triggers similar reductions in other areas of biosynthesis (e.g. fatty acid synthesis). ppGpp directly regulates DNA synthesis, transcription, and translation and has direct and indirect effects on fatty acid synthesis. ppGpp-mediated inhibition of fatty acid synthesis reduce cell size by limiting the capacity of the bacterial cell envelope. Right: In yeast, TOR signaling plays a crucial role in the mechanisms by which nutrients modulate cell size and growth rate. The schematic provides a simplified overview that only includes components of the network that are known to influence nutrient modulation of cell size and growth rate.
ppGpp is a master regulator of growth in bacteria
In bacteria, the concentration of ppGpp is inversely proportional to nutrient-imposed growth rate: high in nutrient poor conditions and low in rich conditions [57]. In E. coli, ppGpp interacts with RNA polymerase to modulate expression of ~1/4 of the transcriptome [37]. ppGpp also modulates the activity of additional proteins through direct interactions [58]. Artificially increasing ppGpp concentration reduces E. coli growth rate and size—both length and width--that mimic the impact of nutrient limitation [10].
Lipids and plasma membrane capacity as a physical limit on cell size
Part of ppGpp’s negative impact on cell size appears to be mediated through its negative impact on flux through lipid synthesis. To probe the relationship between nutrient-imposed growth rate and cell size, bacteria were cultured at steady state in rich medium in the presence of concentrations of antibiotics high enough to slow growth but too low to prevent it altogether (referred to as sub-minimal inhibitory concentration or sub-MIC) targeting three major biosynthetic pathways: transcription, translation and lipid synthesis [10]. Sub-MIC concentrations of these types of drugs reduce growth rate by inhibiting their target biosynthetic process, but do not prevent growth altogether or kill cells outright making them an appealing means of assessing the contribution of different pathways to specific biological phenomena. Transcription, translation and lipid synthesis are a primary sink for nutrients and partial inhibition leads to reductions in growth rate similar to those observed during growth in nutrient limiting conditions. Only the addition of sub-MIC levels of cerulenin, which blocks early steps in fatty acid synthesis, reduced the size of E. coli and B. subtilis in a manner similar to that observed during nutrient limitation [10]. Inhibiting transcription with sub-MIC concentrations of the RNA polymerase inhibitor, rifampicin, had little impact on bacterial cell size, while reductions in protein synthesis with sub-MIC levels of the translation inhibitor, chloramphenicol, reduced bacterial cell size in a lipid dependent manner. Defects in lipid synthesis result in accumulation of ppGpp in E. coli [59]. Inhibiting lipid synthesis in cells defective for ppGpp accumulation quickly results in a breakdown of cell envelope integrity and cell death, suggesting an additional role for ppGpp in coordinating cytoplasmic expansion with cell envelope capacity [10]. It is likely similar mechanisms operate in eukaryotic cells to coordinate cytoplasmic growth with plasma membrane growth, but nothing is known about these mechanisms.
Intriguingly, cerulenin treatment also causes a dose-dependent decrease in S. cerevisiae size, suggesting that lipid synthesis is conserved as a modulator of cell size [10]. At the highest concentrations of the drug, S. cerevisiae cells were ~20% smaller than the untreated control. Further evidence lipid-dependent control of yeast cell size has come from analysis of TOR signaling networks (see below).
TOR kinases are master regulators of growth in eukaryotic cells
In eukaryotic cells, TOR kinases serve as master regulators that coordinate biosynthesis and cell growth with nutrient availability [55,56]. Tor kinases assemble two distinct multi-protein complexes, referred to as TORC1 and TORC2. The functions of TORC1 have been extensively studied because it is the target of the small molecule inhibitor rapamycin. Much less is known about the functions of TORC2. TORC1 controls ribosome biogenesis, translation, transcription, nutrient import, and autophagy, while TORC2 controls lipid synthesis, endocytosis, and organization of the actin network that directs cell growth to specific locations. The TOR kinases target members of the conserved AGC family of kinases, which relay TOR-dependent signals that control cell growth. The AGC kinases are also regulated by phosphoinositide-dependent kinase 1 (Pdk1), another master regulator of cell growth. TOR kinases and Pdk1 phosphorylate distinct activating sites on the AGC kinases.
TOR-dependent signals are required for the proportional relationship between cell size and growth rate
Components of both the TORC1 and TORC2 signaling networks are required for normal control of cell size and nutrient modulation of cell size. A key downstream target of TORC1 is Sch9, a protein kinase that is thought to be the functional ortholog of mammalian S6 kinase [60]. Sch9 controls ribosome biogenesis via a transcription factor called Sfp1 [61–63]. Loss of Sch9 or Sfp1 causes a large reduction in cell size as well as a failure in nutrient modulation of cell size [61]. Furthermore, loss of function of numerous proteins involved in ribosome biogenesis causes a large decrease in cell size [64]. These observations suggest that signals associated with ribosome biogenesis strongly influence cell size and nutrient modulation of cell size.
Components of the TORC2 signaling network are also required for nutrient modulation of cell size. TORC2 signaling is matched to the growth rate set by nutrient availability: signaling is high in rich nutrients and low in poor nutrients [36]. Inactivation of key components of the TORC2 network leads to a failure in nutrient modulation of TORC2 signaling, as well as a failure in nutrient modulation of cell size. Disruption of the network can also lead to a complete loss of the proportional relationship between cell size and growth rate [36,65]. Figure 4 (Right) provides a simplified overview of the TORC2 signaling network in yeast that focuses on components implicated in nutrient modulation of cell size. The specific outputs of the network that modulate cell size remain poorly understood. One function of the TORC2 network is to control a biosynthetic pathway that builds ceramide lipids from sphingolipid precursors [66–69]. Sphingolipids and ceramides function as signaling lipids, and genetic and pharmacological data suggest that they relay key TORC2-dependent signals that influence cell growth and size [36,53]. For example, small molecule inhibitors of sphingolipid synthesis cause a dose-dependent decrease in the size of both budding yeast and fission yeast [36]. Moreover, genetic inactivation of ceramide synthase leads to a complete failure in nutrient modulation TORC2 signaling, growth rate, and cell size [36,70]. A model that could explain these data is that ceramide-dependent signals arising from the TORC2 network help match growth rate to nutrient availability, while also setting the threshold amount of growth required for cell cycle progression. This model would provide a simple mechanistic explanation for the growth law. In addition to a role in signaling, ceramide is used to build complex ceramides that are structural components of membranes. Thus, an alternative model could be that complex ceramides are needed for expansion of the plasma membrane; however, mutants that block production of complex ceramides have no effect on cell size. Further evidence for links between lipid biogenesis and cell size control comes from the discovery that Mrs6, a Rab escort protein, binds to Sfp1 and influences Sfp1 localization, ribosome biogenesis, and TORC1 signaling [62,71],
The fact that TORC1 and TORC2 are both required for control of cell size and for nutrient modulation of cell size suggests that cell size is intimately connected to control of cell growth. This would appear to make sense, as it is likely that cell size control mechanisms evolved as an outcome of the necessity to control the rate and extent of growth to ensure that growth is appropriately matched to nutrient availability.
Concluding remarks
Over six decades of research in bacteria and yeast have illuminated a diversity of connections between cell size and nutrient availability. At the same time, clear themes emerge in both groups of organisms. First, size is a multifactorial phenomenon involving nutrient dependent signals that impact both cell growth and cell cycle progression. Second, nutrient-dependent signals can be integrated at multiple steps in the cell cycle (e.g. G1 and G2 phases are both used as decision points for cell size control) depending on the situation. In addition, decisions made at earlier steps may be overridden at later steps if conditions require it (e.g. the adder functioning at division can supercede the earlier one functioning at replication initiation in bacterial systems [19]. And finally, at least in bacteria, nutrients can influence size independent of cell cycle progression by limiting the size of the cell envelope and, with it, cytoplasmic expansion.
The broadly conserved relationship between nutrient availability and cell size makes it an appealing entry point to illuminate one of the most fundamental properties of life: cell growth. The mechanisms that measure and limit cell growth remain poorly understood and intensely controversial, partly due to their essential nature and partly due to the desire for a simple solution to what is almost certainly a complicated and multi factorial problem. Illuminating these mechanisms will require the synergistic application of multiple techniques, state of the art analysis of growth and physiology in single cells, and an open mind to allow for productive refinement of existing models. Models for cell size control will remain controversial until we have a detailed biochemical understanding of the molecular steps that connect master regulators of growth to nutrient availability, cell cycle progression and cell size control. Discovery of these mechanisms will spark progress in multiple areas, while also illuminating mechanisms that help generate the extraordinary and delightful diversity in cell size and shape across the tree of life.
Outstanding Questions.
How do signals from nutrients modulate the threshold amount of growth required for cell cycle progression?
Does growth-rate contribute to cell size independent of nutrient availability?
How do eukaryotes coordinate cytoplasmic growth with growth of the cell envelope to maintain cellular integrity?
Is cell size in eukaryotic cells governed by a sizer, an adder, or a combination of the two?
Highlights.
Nutrients influence cell size via changes in biosynthetic capacity and via signal transduction pathways that modulate the threshold amount of growth required for cell cycle progression
Nutrients influence sizer and adder mechanisms to increase or decrease cell size under steady state conditions
Master growth regulators are important for linking cell size to nutrient availability
Acknowledgements:
Research in the Levin and Kellogg Labs is supported by grants from the National Institute of General Medical Sciences [R35 GM127331(Levin) and R35 GM131826 (Kellogg)]. DRK and PAL would like to members of the Kellogg and Levin labs past and present for the gift of decades of insightful and engaging discussions on cell growth, cell size, and other topics.
Footnotes
Publisher's Disclaimer: This is a PDF file of an unedited manuscript that has been accepted for publication. As a service to our customers we are providing this early version of the manuscript. The manuscript will undergo copyediting, typesetting, and review of the resulting proof before it is published in its final form. Please note that during the production process errors may be discovered which could affect the content, and all legal disclaimers that apply to the journal pertain.
The authors declare no competing interests.
References:
- 1.Ginzberg MB et al. (2015) On being the right (cell) size. Science 348, 1245075–1245075 [DOI] [PMC free article] [PubMed] [Google Scholar]
- 2.Cooper KL et al. (2013) Multiple phases of chondrocyte enlargement underlie differences in skeletal proportions. Nature 495, 375–378 [DOI] [PMC free article] [PubMed] [Google Scholar]
- 3.Robertson FW (1963) The ecological genetics of growth in Drosophila 6. The genetic correlation between the duration of the larval period and body size in relation to larval diet. Genetics Res 4, 74–92 [Google Scholar]
- 4.Hirsch J and Han PW (1969) Cellularity of rat adipose tissue: effects of growth, starvation, and obesity. J. Lipid Res 10, 77–82 [PubMed] [Google Scholar]
- 5.Stenkula KG and Erlanson-Albertsson C (2018) Adipose cell size: importance in health and disease. Amer J. of Phys.-Reg., Integ. and Comp.e Phys 315, R284–R295 [DOI] [PubMed] [Google Scholar]
- 6.Pierucci O (1978) Dimensions of Escherichia coli at various growth rates: model for envelope growth. J. Bacteriol 135, 559–574 [DOI] [PMC free article] [PubMed] [Google Scholar]
- 7.Johnston GC et al. (1979) Regulation of cell size in the yeast Saccharomyces cerevisiae. J Bacteriol 137, 1–5 [DOI] [PMC free article] [PubMed] [Google Scholar]
- 8.Schaechter M et al. (1958) Dependency on medium and temperature of cell size and chemical composition during balanced grown of Salmonella typhimurium. J. Gen. Microbiol 19, 592–606 [DOI] [PubMed] [Google Scholar]
- 9.Fantes P and Nurse P (1977) Control of cell size at division in fission yeast by a growth-modulated size control over nuclear division. Exp. Cell Res 107, 377–386 [DOI] [PubMed] [Google Scholar]
- 10.Vadia S et al. (2017) Fatty Acid Availability Sets Cell Envelope Capacity and Dictates Microbial Cell Size. Curr. Biol 27, 1757–1767. [DOI] [PMC free article] [PubMed] [Google Scholar]
- 11.Campos M et al. (2018) Genomewide phenotypic analysis of growth, cell morphogenesis, and cell cycle events in Escherichia coli. Mol. Syst. Biol 14, e7573. [DOI] [PMC free article] [PubMed] [Google Scholar]
- 12.Westfall CS and Levin PA (2018) Comprehensive analysis of central carbon metabolism illuminates connections between nutrient availability, growth rate, and cell morphology in Escherichia coli. PLoS Genet 14, e1007205. [DOI] [PMC free article] [PubMed] [Google Scholar]
- 13.Sauls JT et al. (2016) Adder and a coarse-grained approach to cell size homeostasis in bacteria. Curr. Opin. Cell Biol 38, 38–44 [DOI] [PMC free article] [PubMed] [Google Scholar]
- 14.Turner JJ et al. (2012) Cell size control in yeast. Curr. Biol 22, R350–9 [DOI] [PMC free article] [PubMed] [Google Scholar]
- 15.Campos M et al. (2014) A Constant Size Extension Drives Bacterial Cell Size Homeostasis. Cell 159, 1433–1446 [DOI] [PMC free article] [PubMed] [Google Scholar]
- 16.Iyer-Biswas S et al. (2014) Scaling laws governing stochastic growth and division of single bacterial cells. Proc. Natl. Acad. Sci. U.S.A 111, 15912–15917 [DOI] [PMC free article] [PubMed] [Google Scholar]
- 17.Amir A (2014) Cell Size Regulation in Bacteria. Phys. Rev. Lett 112, 208102 [Google Scholar]
- 18.Taheri-Araghi S et al. (2015) Cell-Size Control and Homeostasis in Bacteria. Curr. Biol 25, 385–391 [DOI] [PMC free article] [PubMed] [Google Scholar]
- 19.Si F et al. (2019) Mechanistic Origin of Cell-Size Control and Homeostasis in Bacteria. Curr. Biol 29, 1760–1770 [DOI] [PMC free article] [PubMed] [Google Scholar]
- 20.Weart RB and Levin PA (2003) Growth Rate-Dependent Regulation of Medial FtsZ Ring Formation. J. Bacteriol 185, 2826–2834 [DOI] [PMC free article] [PubMed] [Google Scholar]
- 21.Aldea M et al. (1990) Division genes in Escherichia coli are expressed coordinately to cell septum requirements by gearbox promoters. EMBO J 9, 3787–3794 [DOI] [PMC free article] [PubMed] [Google Scholar]
- 22.Ferrezuelo F et al. (2012) The critical size is set at a single-cell level by growth rate to attain homeostasis and adaptation. Nat. Comm 3, 1012. [DOI] [PubMed] [Google Scholar]
- 23.Leitao RM and Kellogg DR (2017) The duration of mitosis and daughter cell size are modulated by nutrients in budding yeast. J. Cell Biol 216, 3463–3470 [DOI] [PMC free article] [PubMed] [Google Scholar]
- 24.Goranov AI et al. (2009) The rate of cell growth is governed by cell cycle stage. Genes & Dev 23, 1408–1422 [DOI] [PMC free article] [PubMed] [Google Scholar]
- 25.Varsano G et al. (2017) Probing mammalian cell size homeostasis by channel-assisted cell reshaping. Cell Reports 20, 397–410 [DOI] [PubMed] [Google Scholar]
- 26.Cadart C et al. (2018) Size control in mammalian cells involves modulation of both growth rate and cell cycle duration. Nat. Comm 9, 3275. [DOI] [PMC free article] [PubMed] [Google Scholar]
- 27.Soifer I et al. (2016) Single-Cell Analysis of Growth in Budding Yeast and Bacteria Reveals a Common Size Regulation Strategy. Curr. Biol 26, 356–61 [DOI] [PubMed] [Google Scholar]
- 28.Schmoller KM et al. (2015) Dilution of the cell cycle inhibitor Whi5 controls budding-yeast cell size. Nature 526, 268–272 [DOI] [PMC free article] [PubMed] [Google Scholar]
- 29.Jasani A et al. (2020) Growth-Dependent Activation of Protein Kinases Suggests a Mechanism for Measuring Cell Growth. Genetics 215, 729–746 [DOI] [PMC free article] [PubMed] [Google Scholar]
- 30.Hartwell LH and Unger MW (1977) Unequal division in Saccharomyces cerevisiae and its implications for the control of cell division. J. Cell Biol 75, 422–435 [DOI] [PMC free article] [PubMed] [Google Scholar]
- 31.Talia SD et al. (2007) The effects of molecular noise and size control on variability in the budding yeast cell cycle. Nature 448, 947–951 [DOI] [PubMed] [Google Scholar]
- 32.Sveiczer A et al. (1996) The size control of yeast revisited. J. Cell Sci 109, 2947–2957 [DOI] [PubMed] [Google Scholar]
- 33.Anastasia SD et al. (2012) A link between mitotic entry and membrane growth suggests a novel model for cell size control. J.of Cell Biol 197, 89–104 [DOI] [PMC free article] [PubMed] [Google Scholar]
- 34.Kjeldgaard NO et al. (1958) The transition between different physiological states during balanced growth of Salmonella typhimurium. J. Gen. Microbiol 19, 607–616 [DOI] [PubMed] [Google Scholar]
- 35.Kief DR and Warner JR (1981) Coordinate control of syntheses of ribosomal ribonucleic acid and ribosomal proteins during nutritional shift-up in Saccharomyces cerevisiae. Molec. Cell Biol. 1, 1007–15 [DOI] [PMC free article] [PubMed] [Google Scholar]
- 36.Lucena R et al. (2018) Cell Size and Growth Rate Are Modulated by TORC2-Dependent Signals. Curr. Biol 28, 196–210. [DOI] [PMC free article] [PubMed] [Google Scholar]
- 37.Sommer RA et al. (2021) Growth-dependent signals drive an increase in early G1 cyclin concentration to link cell cycle entry with cell growth. eLife 10, e64364. [DOI] [PMC free article] [PubMed] [Google Scholar]
- 38.Litsios A et al. (2019) Differential scaling between G1 protein production and cell size dynamics promotes commitment to the cell division cycle in budding yeast. Nat. Cell Biol 21, 1382–1392 [DOI] [PubMed] [Google Scholar]
- 39.Soma S et al. (2014) Multiple metabolic requirements for size homeostasis and initiation of division in Saccharomyces cerevisiae. Microb. Cell, 256–266 [DOI] [PMC free article] [PubMed] [Google Scholar]
- 40.Zhao G et al. (2016) Cyclin-Dependent Kinase Co-Ordinates Carbohydrate Metabolism and Cell Cycle in S. cerevisiae. Molec. Cell 62, 546–557 [DOI] [PMC free article] [PubMed] [Google Scholar]
- 41.Ewald JC (2018) How yeast coordinates metabolism, growth and division. Curr. Opin. Microbiol 45, 1–7 [DOI] [PubMed] [Google Scholar]
- 42.Løbner-Olesen A et al. (1989) The DnaA protein determines the initiation mass of Escherichia coli K-12. Cell 57, 881–889 [DOI] [PubMed] [Google Scholar]
- 43.Männik J et al. (2018) Cell cycle‐dependent regulation of FtsZ in Escherichia coli in slow growth conditions. Mol. Microbiol 110, 1030–1044 [DOI] [PMC free article] [PubMed] [Google Scholar]
- 44.Hill NS et al. (2012) Cell Size and the Initiation of DNA Replication in Bacteria. PLoS Genet 8, e1002549. [DOI] [PMC free article] [PubMed] [Google Scholar]
- 45.Wallden M et al. (2016) The synchronization of replication and division cycles in individual E. coli cells. Cell 166, 729–739 [DOI] [PubMed] [Google Scholar]
- 46.Tsang M-J and Bernhardt TG (2015) A role for the FtsQLB complex in cytokinetic ring activation revealed by an fts L allele that accelerates division: FtsL and divisome function. Molec. Microbiol 95, 925–944 [DOI] [PMC free article] [PubMed] [Google Scholar]
- 47.Weart RB et al. (2007) A Metabolic Sensor Governing Cell Size in Bacteria. Cell 130, 335–347 [DOI] [PMC free article] [PubMed] [Google Scholar]
- 48.Hill NS et al. (2013) A Moonlighting Enzyme Links Escherichia coli Cell Size with Central Metabolism. PLoS Genet 9, e1003663. [DOI] [PMC free article] [PubMed] [Google Scholar]
- 49.Hansen FG and Atlung T (2018) The DnaA tale. Front. Microbiol 9, 319. [DOI] [PMC free article] [PubMed] [Google Scholar]
- 50.Hall DD et al. (1998) Regulation of the Cln3-Cdc28 kinase by cAMP in Saccharomyces cerevisiae. EMBO J 17, 4370–4378 [DOI] [PMC free article] [PubMed] [Google Scholar]
- 51.Schneider BL et al. (2004) Growth Rate and Cell Size Modulate the Synthesis of, and Requirement for, G1-Phase Cyclins at Start. Molec. and Cell. Biol 24, 10802–10813 [DOI] [PMC free article] [PubMed] [Google Scholar]
- 52.Altman R and Kellogg D (1997) Control of Mitotic Events by Nap1 and the Gin4 Kinase. J. Cell Biol 138, 119–130 [DOI] [PMC free article] [PubMed] [Google Scholar]
- 53.Alcaide-Gavilán M et al. (2018) Modulation of TORC2 Signaling by a Conserved Lkb1 Signaling Axis in Budding Yeast. Genetics 210, 155–170 [DOI] [PMC free article] [PubMed] [Google Scholar]
- 54.Irving SE and Corrigan RM (2018) Triggering the stringent response: signals responsible for activating (p)ppGpp synthesis in bacteria. Microbiol 164, 268–276 [DOI] [PubMed] [Google Scholar]
- 55.González A and Hall MN (2017) Nutrient sensing and TOR signaling in yeast and mammals. EMBO J 36, 397–408 [DOI] [PMC free article] [PubMed] [Google Scholar]
- 56.Loewith R and Hall MN (2011) Target of Rapamycin (TOR) in Nutrient Signaling and Growth Control. Genetics 189, 1177–1201 [DOI] [PMC free article] [PubMed] [Google Scholar]
- 57.Potrykus K et al. (2011) ppGpp is the major source of growth rate control in E. coli: ppGpp and growth rate control. Environ. Microbiol 13, 563–575 [DOI] [PMC free article] [PubMed] [Google Scholar]
- 58.Wang B et al. (2019) Affinity-based capture and identification of protein effectors of the growth regulator ppGpp. Nat. Chem. Biol 15, 141–150 [DOI] [PMC free article] [PubMed] [Google Scholar]
- 59.Battesti A and Bouveret E (2006) Acyl carrier protein/SpoT interaction, the switch linking SpoT-dependent stress response to fatty acid metabolism. Mol. Microbiol 62, 1048–1063 [DOI] [PubMed] [Google Scholar]
- 60.Urban J et al. (2007) Sch9 Is a Major Target of TORC1 in Saccharomyces cerevisiae. Molec. Cell 26, 663–674 [DOI] [PubMed] [Google Scholar]
- 61.Jorgensen P and Tyers M (2004) A dynamic transcriptional network communicates growth potential to ribosome synthesis and critical cell size. Genes & Dev 18, 2491–2505 [DOI] [PMC free article] [PubMed] [Google Scholar]
- 62.LempiAinen H et al. (2009) Sfp1 Interaction with TORC1 and Mrs6 Reveals Feedback Regulation on TOR Signaling. Molec. Cell 33, 704–716 [DOI] [PubMed] [Google Scholar]
- 63.Marion RM et al. (2004) Sfp1 is a stress- and nutrient-sensitive regulator of ribosomal protein gene expression. Proc. Natl. Acad. Sci. U.S.A 101, 14315–14322 [DOI] [PMC free article] [PubMed] [Google Scholar]
- 64.Jorgensen P et al. (2002) Systematic identification of pathways that couple cell growth and division in yeast. Science 297, 395–400 [DOI] [PubMed] [Google Scholar]
- 65.Leitao RM et al. (2019) A Conserved PP2A Regulatory Subunit Enforces Proportional Relationships Between Cell Size and Growth Rate. Genetics 213, 517–528 [DOI] [PMC free article] [PubMed] [Google Scholar]
- 66.Sun Y et al. (2012) Orm protein phosphoregulation mediates transient sphingolipid biosynthesis response to heat stress via the Pkh-Ypk and Cdc55-PP2A pathways. Molec. Biol. Cell 23, 2388–2398 [DOI] [PMC free article] [PubMed] [Google Scholar]
- 67.Aronova S et al. (2008) Regulation of ceramide biosynthesis by TOR complex 2. Cell Metabol 7, 148–158 [DOI] [PMC free article] [PubMed] [Google Scholar]
- 68.Roelants FM et al. (2011) Protein kinase Ypk1 phosphorylates regulatory proteins Orm1 and Orm2 to control sphingolipid homeostasis in Saccharomyces cerevisiae. Proc. Nat. Acad. Sci 108, 19222–19227 [DOI] [PMC free article] [PubMed] [Google Scholar]
- 69.Muir A et al. (2014) TORC2-dependent protein kinase Ypk1 phosphorylates ceramide synthase to stimulate synthesis of complex sphingolipids. eLife 3, 1–34 [DOI] [PMC free article] [PubMed] [Google Scholar]
- 70.Flor-Parra I et al. (2021) The Ceramide Synthase Subunit Lac1 Regulates Cell Growth and Size in Fission Yeast. Int. J. Molec. Sci 23, 303. [DOI] [PMC free article] [PubMed] [Google Scholar]
- 71.Singh J and Tyers M (2009) A Rab escort protein integrates the secretion system with TOR signaling and ribosome biogenesis. Genes & Dev 23, 1944–1958 [DOI] [PMC free article] [PubMed] [Google Scholar]