

Abstract
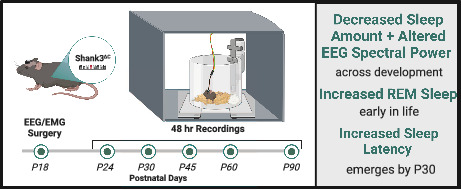
Sleep problems are prevalent in autism spectrum disorder (ASD), can be observed before diagnosis, and are associated with increased restricted and repetitive behaviors. Therefore, sleep abnormalities may be a core feature of the disorder, but the developmental trajectory remains unknown. Animal models provide a unique opportunity to understand sleep ontogenesis in ASD. Previously we showed that adult mice with a truncation in the high‐confidence ASD gene Shank3 (Shank3∆C) recapitulate the clinical sleep phenotype. In this study we used longitudinal electro‐encephalographic (EEG) recordings to define, for the first time, changes in sleep from weaning to young adulthood in an ASD mouse model. We show that Shank3∆C male mice sleep less overall throughout their lifespan, have increased rapid eye movement (REM) sleep early in life despite significantly reduced non‐rapid eye movement (NREM) sleep, and have abnormal responses to increased sleep pressure that emerge during a specific developmental period. We demonstrate that the ability to fall asleep quickly in response to sleep loss develops normally between 24 and 30 days in mice. However, mutants are unable to reduce sleep latency after periods of prolonged waking and maintain the same response to sleep loss regardless of age. This phenomenon seems independent of homeostatic NREM sleep slow‐wave dynamics. Overall, our study recapitulates both preclinical models and clinical studies showing that reduced sleep is consistently associated with ASD and suggests that problems falling asleep may reflect abnormal development of sleep and arousal mechanisms.
Keywords: autism spectrum disorder, development, EEG, mouse model, REM, Shank3, sleep, sleep latency
Insomnia is prevalent in Autism Spectrum Disorder (ASD) and heavily influences quality of life. Using a mouse model of ASD we show that sleep problems are present from young ages and worsen with time, supporting abnormal sleep as a core feature of ASD.
Significance.
In this first longitudinal sleep study in an Autism mouse model, we demonstrate that sleeping less seems a core feature of the disorder while problems falling asleep emerge during development.
1. INTRODUCTION
Good sleep is a cornerstone for maintaining optimal health. Accordingly, sleep problems, with insomnia as the most common sleep disorder, negatively impact our physical and mental health. In individuals diagnosed with autism spectrum disorder (ASD), two thirds have chronic insomnia (defined as persistent problems falling and staying asleep), and 86% of people with ASD are affected by sleep problems (Maxwell‐Horn & Malow, 2017; Petruzzelli et al., 2021; Souders et al., 2017). Relative to individuals that do not have ASD, individuals with ASD experience significant delays falling asleep, multiple night awakenings, and overall less sleep time (Hodge et al., 2014). Poor sleep is predictive of the severity of ASD core diagnostic symptoms such as social skill deficits and stereotyped behavior. With age, sleep problems often worsen and heavily affect the quality of life of individuals and their caregivers. In addition, sleep problems in young children that go on to be diagnosed with ASD are associated with increased “higher‐order” restricted and repetitive behaviors later in childhood (MacDuffie, Munson, et al., 2020) and altered patterns of brain development (MacDuffie, Shen, et al., 2020). Although the link between sleep problems and ASD has been extensively documented, insomnia is often referred to as a condition comorbid with ASD, secondary to diagnosis despite its large prevalence. A recent longitudinal neuroimaging study of infants at familial high or low risk for ASD has challenged this notion and shown that sleep problems can be detected before diagnosis and may be a “core” defining feature of ASD (MacDuffie, Shen, et al., 2020). The study showed that sleep onset problems were more common at 6–12 months among infants who later developed ASD, and that these problems falling asleep were related to hippocampal volume trajectories from 6 to 24 months only for infants at high risk who developed ASD. Given the well‐documented role of sleep in brain development (Frank, 2020), early‐life sleep disruption is likely to contribute to later‐life core features of ASD and might even be an indication for early intervention. The effects of sleep disruption during development on social behavior are well documented in animal model studies (Bian et al., 2022; Jones et al., 2019). A recent study shows that sleep disruption during adolescence in mice is linked to social deficits in adulthood, and that improving sleep quality during adolescence can improve social deficits in a mouse model of ASD (Bian et al., 2022). However, the developmental trajectory of sleep problems in ASD and its potential role in ASD etiology remains largely unexplored.
ASD is known to have a strong genetic component including both de novo and inherited gene variations. Nonetheless the same variant can cause different symptoms along a spectrum (Rylaarsdam & Guemez‐Gamboa, 2019). This heterogeneity presents challenges for genetic ASD animal models in which targeting a single gene of interest yields inconsistent expression of core behavioral phenotypes such as social communication deficits and stereotyped behaviors. In addition, this approach generally fails to capture earlier neurodevelopmental processes preceding disease onset, leaving etiology elusive. Sleep, unlike many other behavioral phenotypes, can be objectively quantified in mammals and is very highly conserved across the animal kingdom. Therefore, animal models are ideally suited to investigate the relationship between sleep and ASD. However, studies focused on sleep abnormalities in animal models of ASD seldom study all the features of the clinical phenotype: delayed sleep onset, sleep fragmentation, and reduced sleep time (Doldur‐Balli et al., 2022; Wintler et al., 2020). In earlier work, we reported that individuals with Phelan‐McDermid syndrome (PMS), a rare genetic syndrome with high rates of ASD diagnosis, have a sleep phenotype akin to those with ASD (Ingiosi et al., 2019). PMS is caused either by loss of the tip of chromosome 22 that includes SHANK3 or a mutation in the SHANK3 gene, which encodes a neuronal junction protein critical for synaptic function. Mutations in Shank3 are also often present in idiopathic ASD (Cochoy et al., 2015, p. 3), including mutations that cause c‐terminal truncation of the protein (Cochoy et al., 2015; Hassani Nia et al., 2020). Similar to what we observed in patients, we found that adult mice lacking exon 21 of Shank3 leading to a c‐terminal truncation (Shank3∆C) slept less than controls and took longer to fall asleep (Ingiosi et al., 2019). Shank3∆C mice also displayed lower levels of electro‐encephalographic (EEG) slow‐wave (i.e., “delta”) activity at baseline showing their sleep was also not of the same quality. Non‐rapid eye movement (NREM) sleep delta power dynamics in response to sleep loss are proposed to be a marker of homeostatic sleep pressure. However, Shank3∆C mice show no differences in NREM sleep delta power dynamics in response to sleep deprivation (SD), suggesting they have problems falling asleep despite no problems accumulating sleep pressure. Our studies also showed that Shank3∆C adult male animals do not have differences in timing of activity in constant darkness relative to wild‐type (WT) littermates, suggesting that circadian clock function is largely unaffected.
In this study, we characterize sleep ontogenesis in Shank3∆C mice to capture developmental sleep patterns starting at ~70% of maximal brain volume. This age is roughly equivalent to a 9‐month‐old infant based on brain size (Workman et al., 2013), an age in which sleep onset problems in infants at high risk of ASD have been detected based on parent questionnaires (MacDuffie, Shen, et al., 2020). To this end, we executed longitudinal sleep recordings starting immediately after weaning into young adulthood. We discovered that mutant mice sleep less overall than WT controls analogous to observations in high‐risk infants and toddlers with ASD that go on to be diagnosed. Despite sleeping less overall, Shank3∆C mice show a significantly increased amount of rapid‐eye movement sleep (REM) in early life. We also find that Shank3∆C mice fail to reduce sleep latency in response to sleep loss as they get older, a physiological response that develops in WT mice between 24 and 30 days of life. These data identify a developmental time window at which early intervention capable of normalizing aberrant sleep patterns could provide therapeutic benefit. Overall, our study emphasizes the importance of examining developmental trajectories to understand sleep problems associated with ASD.
2. MATERIALS AND METHODS
2.1. Animals
Shank3ΔC mice previously characterized by Kouser et al. (2013) on a C57Bl/6 background and available through the Jackson laboratories were bred as previously described (Ingiosi et al., 2019), and housed at 24 ± 1°C on a 12:12 h light: dark cycle with food and water ad libitum. All experimental procedures were approved by the Institutional Care and Use Committee of Washington State University and conducted in accordance with National Research Council guidelines and regulations for experiments in live animals.
2.2. Surgical procedures
At postnatal (P) 18 days old, male mice (n = 10 Shank3ΔC and n = 10 WT littermates) were weaned from their dams and placed under isoflurane anesthesia and stereotaxically implanted with four EEG and two electromyographic (EMG) electrodes as previously described (Ingiosi et al., 2019). Briefly, four stainless steel wire loop electrodes were placed bilaterally over frontal (2) and parietal (2) cortices, and EMG electrodes were inserted bilaterally into the nuchal muscles. Adult mice (n = 10, approximately 90 days old) were also implanted with four stainless steel screw electrodes (BC‐002MP188, Bellcan International Corp, Hialeah, FL) as described above. Bilateral frontal electrode placement in young and adult mice was centered in the frontal skull plates, and bilateral parietal electrodes were placed centrally in the parietal skull plates (exact coordinates at this age vary depending on skull size). EEG electrode placement was secured with cement and did not change over the course of the study relative to the skull plates as the mice grew. To prevent damage to implants, instrumented mice were housed individually from surgery to the completion of final recordings. Mice were allowed a minimum of 3 days of recovery from surgery before habituation to the recording environment. This study is an extension of our previous work in adult male mice (Ingiosi et al., 2019), therefore we limited the scope of the current study to males. ASD is four times more prevalent in males than females, therefore phenotypic characterization in animal models of ASD is usually done in males first.
2.3. Sleep recordings
Sleep recordings were conducted in male mice that were 23–60 days old using a longitudinal design. Three days after surgery (P21), mice were connected to a lightweight, flexible tether and allowed 2 days to habituate to the recording environment. At 23 days old, mice underwent 24 h undisturbed baseline EEG and EMG recording beginning at light onset (hour 1). The following day (P24), mice were sleep deprived for 3 h (hours 1–3) via gentle handling starting at light onset as previously described (Ingiosi et al., 2019). Efficiency of sleep deprivation over the 3 h were as follows: P24: 92.8%, P30: 94.3%, P45: 99.2%, P60: 97.3%. Mice were allowed 21 h of recovery sleep (hours 4–12 of the light period and hours 13–24 of the dark period). A total of four 48 h recordings were repeated when mice were 29–30 days old, 44–45 days old, and 59–60 days old, respectively. Figure 1 outlines the experimental design. Independently, two 48 h sleep recordings in a separate cohort of adult (approximately 90 day old) mice were conducted with each animal receiving a single 3‐h or a single 5‐h SD session, spaced 5 days apart.
FIGURE 1.
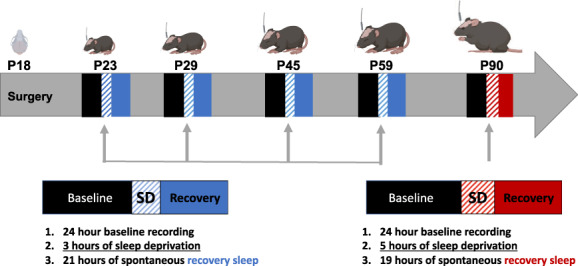
Schematic timeline of experimental procedures. At postnatal day 18 (P18) animals were weaned and surgically implanted for EEG and EMG recordings. Sleep was recorded starting at the following ages: P23, P29, P44, and P59. Animals were recorded for 24 h of baseline, followed by 3 or 5 h of sleep deprivation and then 21 h of spontaneous recovery sleep (48 h total). Animals from an independent cohort were recorded starting at P90 for 48 h.
2.4. EEG/EMG data acquisition and analysis
EEG and EMG data in animals 23–60 days old were recorded from frontal cortical electrodes (referenced to parietal electrodes) collected with Grass 7 polygraph hardware (Natus Medical Incorporated, Pleasanton, CA) via a light‐weight, counterbalanced cable, amplified, and digitized at 256 Hz using VitalRecorder acquisition software (SleepSign for Animal, Kissei Comtec Co., LTD, Nagano, Japan), with band pass filters set at .5–30 Hz and notch filtering at 60 Hz. EEG and EMG data in animals 90 days old were collected with Intan RHD2000 Interface using INTAN recording hardware (16‐channel RHD USB Recording System, Intan Technologies, Los Angeles CA). EEG and EMG data were recorded from frontal electrodes (referenced to parietal electrodes) at 1 kilo‐samples per second with hardware amplification cutoff at .01 Hz, lower and upper bandwidths at .1 and 200 Hz, and notch filtering at 60 Hz.
2.5. Sleep data processing
Recordings were exported for manual scoring of sleep states via SleepSign for Animal as previously described (Ingiosi et al., 2019). State scoring and data analysis was blinded and randomized. Sleep states and wakefulness were determined by visual inspection of the EEG waveform and EMG activity, and vigilance states were assigned in 4 s increments (epochs). NREM bouts were defined as 7 or more consecutive epochs. REM bouts were defined as 4 or more consecutive epochs. Latency to NREM sleep after SD was defined as time elapsed from release to recovery sleep to the first bout of NREM sleep. The EEG was subjected to fast Fourier transform (FFT) resulting in a power spectrum from 0–20 Hz (P23‐P60) or 0–50 Hz (P90) with .5 Hz bins. Twelve‐hour light period spectra were generated as previously described (Ingiosi et al., 2019), from .5 Hz spectral bins expressed as a percentage of the sum of total state‐specific EEG power (0–20 Hz or 0–50 Hz, respectively). NREM delta power (.5–4 Hz) at baseline was normalized relative to total state‐specific power. NREM delta power is dynamic over the course of the day and varies depending on sleep pressure. At the end of the light phase (resting phase for rodents) sleep pressure is minimal and therefore more representative of baseline spectral properties. NREM delta power following SD was normalized relative to baseline NREM delta during the last 4 h of the light period (when delta power is lowest). Wake theta power (5–7 Hz) at baseline was normalized relative to average total power in wake over the light period. Wake theta power following SD was normalized relative to baseline wake theta. EEG epochs containing artifacts, and recordings with excessive EEG artifacts were excluded from spectral analysis.
2.6. Data plotting and statistical analysis
Statistics were conducted using SPSS for Windows (IBM Corporation Armonk, NY) and RStudio (v. 1.3.1056, RStudio, Boston, MA) as previously described (Ingiosi et al., 2019). Noncontinuous time‐in‐state, bout, and latency data are plotted as individual points with a gray bar indicating the group mean. Hourly time‐in‐state data are presented as means ± standard error of the mean (SEM). Spectra are displayed as smooth curves with 95% confidence intervals, as generated using Generalized Additive Models using the R package mgcv (v.1.8‐31). Although our experimental design was longitudinal some animals were excluded from some of the analyses at some time points due to the following reasons: low‐quality recordings, behavioral abnormalities (excessive repetitive movements such as spinning or extensive periods of artifact or signal loss at one of the vigilance states present in both mutants and WT) or because the recording was of sufficient quality to analyze time in state but not spectral data (in which case the animal was used for all analyses that did not involve spectral data). Different animals were excluded at different times. Animals that fell outside ± two standard deviations from the group mean for all vigilance states were considered outliers and excluded from analysis (one WT at baseline P23, one WT P29, one WT, and one mutant P90 following 3 h of SD). The total numbers of animals used for baseline time in state data analysis (Table 1, Figure 2 and corresponding supplements) are as follows: P23/P24, seven WT and eight mutants; P29/P30, seven WT and nine mutants; P44/P45, six WT and seven mutants; P59/P60, eight WT and seven mutants. The total numbers of animals used for baseline spectral data analysis (Figure 3 and corresponding supplements) are as follows: P23/P24, six WT and eight mutants; P29/P30, six WT and eight mutants; P44/P45, four WT and six mutants; P59/P60 eight WT and seven mutants. The total numbers of animals used for sleep latency analysis after SD (Figure 4 and corresponding supplements) are as follows: P23/P24, seven WT and eight mutants; P29/P30, six WT and eight mutants; P44/P45, six WT and seven mutants; P59/P60, seven WT and six mutants; P90 (3hs), 10 WT and 11 mutants; P90 (5hs), nine WT and 10 mutants. The total numbers of animals used for spectral analysis after SD (Figure 4 and corresponding supplements) are as follows: P23/P24, five WT and eight mutants; P29/P30, six WT and five mutants; P44/P45, four WT and five mutants; P59/P60 six WT and six mutants.
TABLE 1.
Shank3ΔC mice sleep less throughout their lifespan
| Age | Phase | Wild‐type | Shank3ΔC | p‐Value |
|---|---|---|---|---|
| (% of sleep time) | (% of sleep time) | |||
|
P23 (n = 7,8) |
Light | 54.9% ± 1.8 | 57.6% ± 1.2 | .23 |
| Dark | 35.4% ± 2.2 | 22.5% ± 1.2 | <.01 | |
| 24 h | 45.2% ± .5 | 40.1% ± .7 | <.01 | |
|
P29 (n = 7, 9) |
Light | 63.6% ± 1.5 | 58.8% ± 1.8 | .07 |
| Dark | 24.7% ± 2.2 | 21.5% ± 1.6 | .25 | |
| 24 h | 44.1% ± 1.3 | 40.2% ± 1.0 | .02 | |
|
P44 (n = 6,7) |
Light | 63.2% ± 1.0 | 62.4% ± 1.5 | .65 |
| Dark | 25.7% ± 3.3 | 16.4% ± 2.2 | .03 | |
| 24 h | 44.5% ± 1.8 | 39.4% ± .8 | .02 | |
|
P59 (n = 8,7) |
Light | 64.1% ± 1.2 | 63.6% ± 1.5 | .8 |
| Dark | 29.4% ± 2.0 | 20.5% ± 1.8 | .01 | |
| 24 h | 46.7% ± .9 | 42.0% ± 1.1 | <.01 |
Note: Average sleep time during 12 h of light, 12 h of dark, or across the full day expressed as percent of total recording time at baseline (24 h). Standard error is also displayed. Sleep was recorded at postnatal days 23, 29, 44, and 59. Postnatal day 23 (P23) (n = 7 WT, 8 Shank3ΔC), P29 (n = 7 WT, 9 Shank3ΔC), P44 (n = 6 WT, 7 Shank3ΔC), and P59 (n = 8 WT, 7 Shank3ΔC) mice. p‐Values shown for genotype comparisons at each age (unpaired t‐tests).
FIGURE 2.
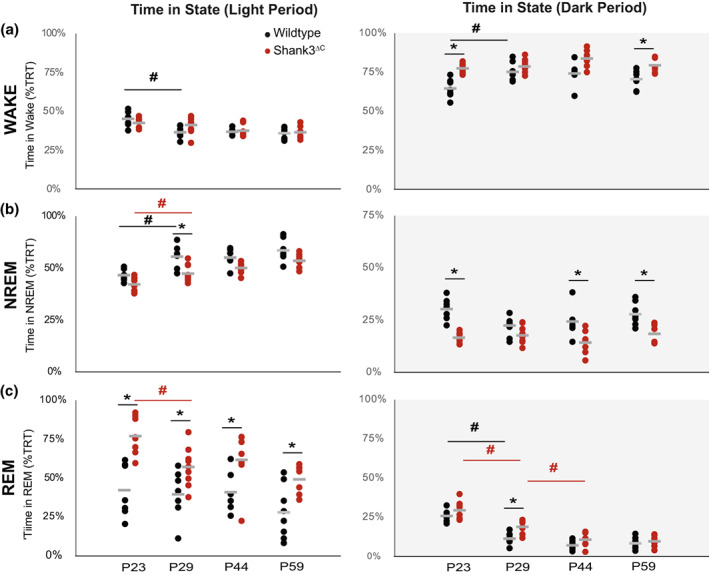
Shank3ΔC mice have increased REM sleep at P23 despite sleeping less. Time (expressed as percent of total recorded time, TRT) in wakefulness (a), NREM sleep (b), and REM sleep (c) during baseline light period (LP, white) and dark period (DP, gray) at P23 (n = 7 WT, 8 Shank3ΔC), P29 (n = 7 WT, 9 Shank3ΔC), P44 (n = 6 WT, 7 Shank3ΔC) and P59 (n = 8 WT, 7 Shank3ΔC). Wild‐type data are shown in black, Shank3ΔC is shown in red. The average value for each group is shown in gray. Post‐hoc testing was performed using t‐tests after two‐way ANOVAs were found significant for genotype or age and corrected for multiple testing using Hochberg. No significant interaction between age and genotype was detected. *denotes p‐values < .05 obtained from post‐hoc t‐tests between genotype as follows: WAKE DP P23 (p = 5.7e−4), P59 (p = .018), NREM LP P29 (p = .016), NREM DP P23 (p = 8.1e−5), P44 (p = .043) and P59 (p = 8.3e−3), LP REM P23 (p = 1.6e−3), P29 (p = .048), P44 (p = .048), P59 (p = .034), DP REM P29 (p = .010). #denotes p‐values < .05 obtained from post‐hoc t‐test performed across age. WAKE LP WT (p = 9.1e−3), WAKE DP WT (p = .015), NREM LP WT (p = 6.9e−3), Mutant (p = .036), REM LP Mutant (p = .012), REM DP WT (p = 4.7e−5), Mutant (p = 1.9e−3, p = 5.5e−3). Table 2 contains all tests statistics for all ANOVAs performed.
FIGURE 3.
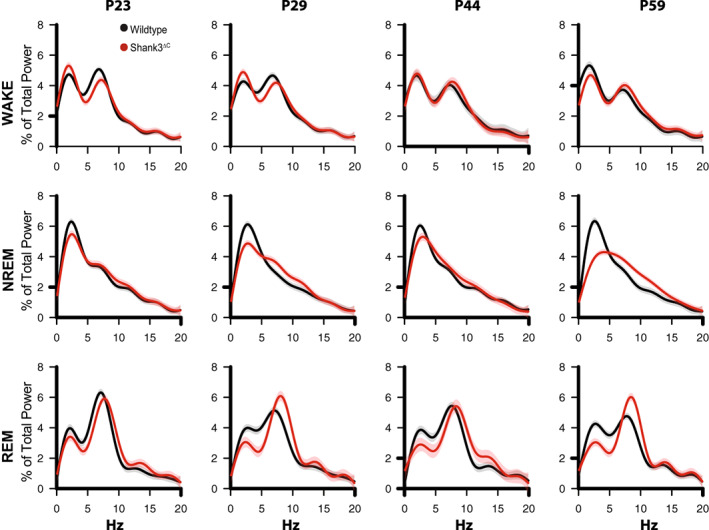
Spectral power changes across development in WT and Shank3ΔC mice. Fourier transformed (FFT) EEG spectral power during the 12 h of the light period. The rows represent wakefulness, NREM sleep, and REM sleep. The columns represent ages: P23, P29, P44 and P59. EEG spectral power in the light period was normalized as a percentage of total state‐specific EEG power in wild‐type (left) or Shank3ΔC mice at P23 (n = 6 WT, 8 Shank3ΔC), P29 (n = 6 WT, 7 Shank3ΔC), P44 (n = 4 WT, 6 Shank3ΔC), P59 (n = 8 WT, 7 Shank3ΔC). Spectra are graphed as smooth lines in black for WT and shades of red for Shank3ΔC. 95% confidence intervals are displayed around each spectrum, light gray for WT, and light red for Shank3ΔC.
FIGURE 4.
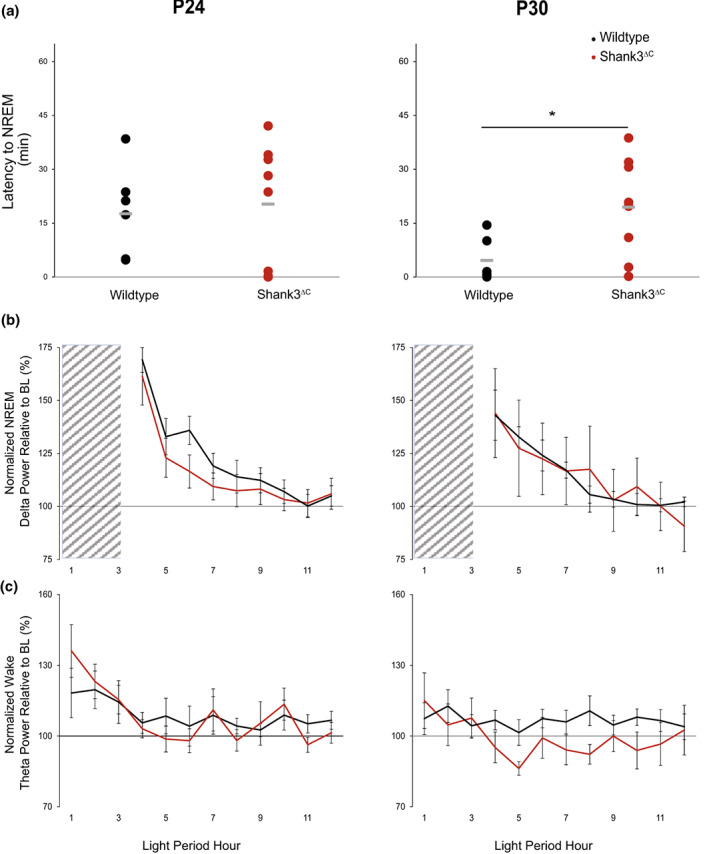
Shank3ΔC mice fail to decrease sleep latency in response to sleep need at P30. P24 (n = 7 WT, 8 Shank3ΔC), P30 (n = 6 WT, 8 Shank3ΔC) mice for sleep latency; P24 (n = 5 WT, 8 Shank3ΔC), P30 (n = 6 WT, 5 Shank3ΔC) mice for spectral analysis. (a) Latency to the first bout of NREM following 3 h of SD. Unpaired t‐test p‐values p < .05 are indicated for genotype differences (*) P30 p = .017. (b) Normalized NREM delta (.5–4 Hz) power during recovery sleep after 3 h of SD relative to NREM delta power during the last 4 h of the light period for the same animal at baseline. (c) Normalized Wake theta (5–7 Hz) power during 3 h of SD and subsequent recovery sleep in the light period (LP) relative to Wake theta power at baseline for the same animal. No differences were found in delta (one‐way ANOVA) or theta (repeated measures ANOVA) accumulation between genotypes. Wild‐type data are shown in black, Shank3ΔC is shown in red, SD period is indicated by crosshatching.
Repeated measures ANOVA was carried out to analyze differences in time in state within age groups. When missing data points precluded us from implementing repeated measures, we used either one‐way (genotype) or two‐way (genotype × age) ANOVAs (e.g., the exclusion of a different set of animals at different ages). Additional testing across genotype or age was performed post‐hoc if main effect of age or genotype were significant. If we did not detect a significant interaction between age and genotype, post‐hoc testing was performed exclusively across genotype within the same age group or across age within genotype. T‐tests were used for post‐hoc comparisons in all cases. T‐test were corrected for multiple testing using Hochberg corrections using R. Significance threshold was set at p ≤ .05. For spectral analysis statistically significant differences were defined by non‐overlap of 95% confidence intervals. The R code for statistics and spectral analysis is publicly available at https://github.com/PeixotoLab/EEG_Sleep_Development.
3. RESULTS
3.1. Developing Shank3ΔC mice sleep less and show altered diurnal/nocturnal distribution of sleep/wake
To understand how the Shank 3 mutation impacts sleep architecture, it is important to first understand normal sleep development. Previous studies established that WT mice by postnatal day 21 exhibit a diurnal/nocturnal (circadian) activity pattern and three distinct states based on EEG: wake, non‐rapid eye movement (NREM) sleep and rapid eye movement (REM) sleep (Nelson et al., 2013; Rensing et al., 2018). Studies in rats, which show similar sleep ontogeny to mice (Rensing et al., 2018), show that the typical reduction on total sleep time observed in early development (driven by a sharp reduction in REM) sleep stabilizes around postnatal day 20 and that the increase in NREM delta power in response to increased sleep pressure can be detected at postnatal day 24 in WT animals (Frank et al., 2017). How sleep changes after the third postnatal week once the animals are separated from their dams and siblings and into adulthood is not known. The developmental trajectory of sleep in genetic animal models of ASD remains unexplored. To define basal characteristics of postnatal sleep, starting at the third postnatal week, we performed 24‐h EEG and EMG recordings from WT and Shank3∆C mice under undisturbed (baseline) conditions (at P23, P29, P44, and P59). Even though time asleep in Shank3ΔC mutants is relatively increased during the normal inactive phase (light period), mutants sleep less overall than WT mice at all time points (Table 1). In WT animals, we found that the distribution of total sleep time differed significantly between P23 and P29 mice (combined time in NREM and REM) across the light (LP, hours 1–12) and dark (DP, hours 13–24) periods, measured as the ratio of time asleep in the light period versus the dark period (Table 1‐supplement 1). These changes in distribution of sleep across the 24‐h cycle happen in the absence of any changes in total sleep time, which we expect to stabilized at around P20. These data suggest that diurnal/nocturnal organization of sleep/wake continues to develop between P23 and P29. Although sleep consolidation in the light period in WT mice is still evolving between P23 and P29, Shank3ΔC mice at P23 show the adult ratio of diurnal/nocturnal sleep distribution (Table 1‐supplement 1).
3.2. Shank3ΔC mice have higher amounts of REM sleep early in life
To determine which states are affected by the overall reduction in sleep we examined time awake, in NREM and in REM sleep over 24 h starting at P23. At this developmental time point, WT mice have acquired 70% of their maximal brain volume and are equivalent to a 9‐month‐old infant based on brain size (Workman et al., 2013). The role of sleep during this developmental time period is of particular interest given that results from behavioral studies suggest a period of typical development followed by the early postnatal onset of ASD in the latter part of the first year or early second year of life in human infants (Zwaigenbaum et al., 2005). We detect a significant effect of both age and genotype for all vigilance states during both the light and dark periods (Figure 2, two‐way ANOVA), without a significant interaction. This could be due to lack of sufficient power to detect interactions or because during adolescence the effect of the genotype is not as large as during early ages or in adults. Table 2 includes complete test statistics for all ANOVAs performed for data in Figure 2.
TABLE 2.
Test statistics for two‐way ANOVA for time in state data shown in Figure 2
| Dependent variable | Comparison | Result |
|---|---|---|
| WAKE LP | Age | F(3, 51) = 9.946, p < .001 |
| WAKE DP | Genotype | F(1, 51) = 35.438, p < .001 |
| Age | F(3, 51) = 5.369, p = .003 | |
| NREM LP | Genotype | F(1, 51) = 27.338, p < .001 |
| Age | F(3, 51) = 21.515, p < .001 | |
| NREM DP | Genotype | F(1, 51) = 48.610, p < .001 |
| REM LP | Genotype | F(1, 51) = 37.769, p < .001 |
| Age | F(3, 51) = 5.147, p = .003 | |
| REM DP | Genotype | F(1, 51) = 13.137, p < .001 |
| Age | F(3, 51) = 62.472, p < .001 |
Note: Two‐way ANOVAs for the effect of genotype and age on time in Wake, NREM, or REM during the light or dark periods for 24‐h baseline recordings.
Increased wakefulness (reduced sleep) in Shank3ΔC mice is most pronounced during the dark period at P23 and P59 (post‐hoc testing corrected for multiple comparisons) (Figure 2, Figure 2‐supplement 1). Time spent in NREM is significantly reduced in Shank3ΔC mice in either light or dark periods across all ages (Figure 2b, Figure 2‐supplement 1). Bouts of NREM sleep are also shorter across development in Shank3ΔC mice (Figure 2‐supplement 2). In the dark period we found a significant interaction for NREM bout duration, with the mutant NREM bout duration being generally shorter (sleep fragmentation). In the mutants NREM bout duration seems to not change over time (Figure 2‐supplement 2), while WT show the expected patterns of consolidating sleep with longer NREM bouts as they get older. Throughout postnatal development, and relative to WT mice, Shank3ΔC mice show higher REM sleep time from P23 to P59 during the light period (Figure 2c, Figure 2‐supplement 1). Increased REM sleep at P23 and P29 in Shank3ΔC mice is driven by an increase in entries into REM (bout number) during the light period (Figure 2‐supplement 2). We also found a significant interaction between age and genotype for REM bout number during the light period. This excess REM despite an overall reduction of sleep time was not observed in our previous study in adult animals. Together, these findings suggest that state‐specific sleep differences in Shank3ΔC mice are developmentally regulated and emerge early post‐weaning. Example traces for wake, NREM, and REM sleep across all ages for both mutants and WT can be found in Figure 2‐supplement 3.
3.3. Spectral power in all brain states changes across development differentially in Shank3ΔC and WT mice
Figure 3 shows the results of spectral analysis across all ages in both mutant and WT mice in wake, NREM and REM sleep under baseline conditions. Statistical significance to determine differences across ages within genotype was defined as lack of overlap between 95% confidence intervals. Spectral properties of the rodent cortical EEG waveform are developmentally regulated in a state‐specific manner (Frank & Heller, 1997; Nelson et al., 2013; Rensing et al., 2018), and our data in WT animals during the light and dark periods support this observation (Figure 3, Figure 3‐supplement 1). In adult Shank3ΔC mice, we reported that EEG slow‐wave delta (.5–4 Hz) activity in NREM sleep is reduced (Ingiosi et al., 2019). Here, we show that the reduction of power in the delta range in NREM sleep is developmentally regulated (Figure 3, Figure 3‐supplement 2). In WT mice, NREM delta activity in the light period is relatively stable across the same age range. It is unclear whether we observe starting at P23 is a failure to show the WT developmental changes, or simply a different starting point for spectral properties of the EEG. We also found spectral differences during WAKE and REM sleep in Shank3ΔC mice. Namely a subtle reduction of theta (5–7 Hz) activity in WAKE in P23, and a reduction in delta activity accompanied by an increase in theta in REM at P59 (Figure 3).
3.4. Reduced latency to sleep following sleep loss is a developmentally acquired response that is absent in Shank3ΔC mice
We previously reported that adult Shank3ΔC mice show an increased latency to fall asleep after SD. To better understand how this may develop, we characterized the homeostatic response to SD at P24, P30, P45, and P60 (3 h, starting at lights on) and recorded changes in sleep/wake architecture and EEGs during the remaining 21 h. Our results show that at P24 Shank3ΔC mice show no difference in latency to fall asleep following SD relative to WT. However, at P30, Shank3ΔC mice display an increased latency to NREM sleep in Shank3ΔC relative to WT littermates (p = .04 [Figure 4a]). At later time points (P45 and P60), we do not detect differences in latency to sleep across genotypes (Figure 4‐supplement 1). This is due to differences in the WT response to SD across ages, because Shank3ΔC mice display the same latency to fall asleep regardless of age (Figure 4‐supplement 2). Since mice may develop a better ability to stay awake following SD as they get older (SD experiments in adults are traditionally 5–6 h instead of 3 h in juveniles). To test the effect of SD length on latency to fall asleep in adult animals, we compared adult P90 animals after 3 or 5 h of SD (Figure 4‐supplement 3). We show that 3 h of SD are sufficient to observe the decrease in latency to NREM sleep in adult WT. Interestingly, the difference in latency to fall asleep between adult mutants and WT is larger following 3 h of SD than 5 h of SD, suggesting that problems falling asleep in Shank3ΔC mice may be independent from homeostatic sleep pressure. An increase in NREM EEG delta power (.5–4 Hz) following SD is a commonly used marker of homeostatic sleep pressure; a process that can be detected by the third postnatal week in rodents (Frank et al., 1998; Franken et al., 2001; Nelson et al., 2013). Following 3 h of SD, we found that WT mice at P24 and at P30 accumulate and discharge NREM delta power in response to SD in the same way as adults (Ingiosi et al., 2019) (Figure 4b, Figure 4‐supplement 1, Figure 4‐supplement 3). Theta activity in wakefulness has also been suggested to increase with sleep pressure (Vassalli & Franken, 2017), although its emergence developmentally has not been examined. We did not observe genotype differences in theta power accumulation (Figure 4c) or later time points (Figure 4‐supplement 1). Therefore, there does not seem to be a correlation between either NREM delta or wake theta accumulation and difficulties falling asleep in the mutants.
4. DISCUSSION
Sleep patterns in children with ASD diverge from typical development early in life, but little is known about the underlying causes. To begin to address this question, we present the first longitudinal trajectory study of postnatal sleep development in the Shank3∆C ASD mouse model. Our studies highlight that several features of normal sleep are still maturing between P23 and P30 in mice. At 23 days of life, mice have acquired 70% of their maximal brain volume and are equivalent to a 9‐month‐old infant based on brain size. At P30, mice have reached 80% of their maximal brain volume and are equivalent to an 18‐month‐old toddler (Workman et al., 2013). We find that normal sleep at P23 occurs at a higher proportion in the active phase (night for mice) and is less consolidated (the bouts are shorter). The diurnal–nocturnal distribution of sleep and activity is still maturing between P23 and P29 in WT animals. Shank3ΔC mice at P23 already sleep most of the time in the light phase, like WT mice at P29 do, despite sleeping less overall. This suggests a precocious development of nocturnal/diurnal sleep organization in the mutants.
Shank3ΔC mice show developmental delay in other sleep features. The homeostatic response to sleep loss in young WT mice is different from that of adulthood; at P24, mice take almost three times as long to fall asleep following SD than they do at P30. Thus, less consolidated sleep and taking longer to fall asleep are normal features of sleep early in life. Despite sleeping less throughout their lives, Shank3∆C mice have larger amounts of REM sleep when young, especially at P23. In human brain development, the proportion of REM relative to NREM sleep is greater earlier and dramatically declines upon maturation (Roffwarg et al., 1966). Thus, larger amounts of REM suggest that the brain in Shank3∆C mice is in a more immature state relative to typically developing siblings. Consolidation of NREM sleep into longer bouts is also a normal feature of brain development. As expected from a more immature brain state, Shank3∆C mice show shorter NREM bouts. The increased REM activity in mutants may arise from an inability to sustain NREM sleep for longer periods of time, that is, a failure to consolidate sleep. This in turn could underlie another common feature of the ASD sleep phenotype: sleep fragmentation. In fact Shank3∆C mice consistently display shorter NREM sleep bouts than WT. EEG spectral analyses show that WT animals overall display more dynamic changes than mutants over time. Interestingly, the differences in power on the delta frequency range in NREM sleep between WT and Shank3∆C increase as they age, suggesting a progressive deterioration in connectivity of the network that underlies slow‐wave oscillations in NREM sleep which can explain why sleep problems are reported to worsen over time in ASD.
Taking longer to fall asleep, one of the more salient aspects of the Shank3∆C adult phenotype, is also a defining characteristic of the clinical ASD sleep phenotype. Latency to sleep onset can only be reliably measured following SD, to make sure that all animals are under comparable sleep pressure. Falling asleep faster following SD is considered a normal response to increased sleep pressure. This deficit arises in the absence of problems accumulating sleep pressure (sleepiness), at least as measured by an increase in delta power in response to SD. In other words, it is a failure of being able to fall asleep quickly despite being sleepy, or reminiscent of being “over‐tired.” Our study shows that Shank3∆C mice show the same sleep onset latency following SD regardless of age. Our studies indicate that this delayed sleep onset may be normal at young ages and during adolescence and young adulthood. How sleep onset latency varies developmentally in rodents has not been previously investigated. However, it is known from human studies that sleep onset latency and propensity to insomnia vary with age (under baseline conditions). Sleep onset latency is known to decrease with age in children 1 month to 6 years (Ottaviano et al., 1996). It is also well known that sleep regulation changes considerably in adolescents, who show significantly longer sleep onset latencies compared to adults, among other features of insomnia (Hysing et al., 2013). It is not known how long this phenomenon persists, but recent studies suggest that increases in sleep onset latency and insomnia incidence during adolescence persists into young adulthood (Hysing et al., 2020). Therefore, in WT rodents, a decrease in latency from P24 to P30, and a subsequent increase at P45 that remains at P60 seem to match expectations based on human developmental trajectories. Overall, Shank3ΔC mice seem unable to adjust how long it takes to fall asleep in response to SD as they develop. Our findings regarding the sleep homeostatic response parallel the immature features of baseline sleep we described above and indicate a mis‐regulation of normal sleep development in Shank3∆C mice.
Although the Shank3∆C sleep phenotype can be considered immature, it may not necessarily arise from a delay in maturation and may in contrast arise from certain aspects of the sleep cycle maturing too early or too fast. For example, Shank3∆C mutants show a more mature diurnal/nocturnal distribution of sleep/wake at P23. The notion that an early maturation of sleep/wake distribution may explain the eventual failure to develop a proper response to sleep loss may seem counterintuitive. However, it is well supported by our current understanding of sleep regulation. The two‐process model of sleep regulation states that when and how much we sleep is determined by the interaction of two processes: the circadian clock and the sleep homeostat (Borbély, 1982). The circadian clock determines the timing of activity during the 24‐h day and is thought to promote arousal during the active phase. The sleep homeostat tracks sleep pressure in response to time spent awake and promotes sleep in response to sleepiness. Both processes mature after the second postnatal week in rodents (Frank et al., 2017), although circadian regulation of sleep timing is known to emerge earlier than the ability to track sleep pressure. Based on our observations in WT animals, both regulatory mechanisms may mature independently until the 3rd postnatal week, in which diurnal/nocturnal organization and homeostatic mechanisms may align, then misalign during adolescence, and eventually produce the typical response to sleep loss we observe in adult animals. If the response to circadian input matures too rapidly, one risks too much arousing input from the clock. Excess arousal input from the clock may in turn cause a failure of both processes to crosstalk effectively and explains several features of the Shank3∆C sleep phenotype, namely: reduced total sleep time, earlier emergence of the diurnal/nocturnal distribution of sleep/wake, shorter NREM sleep bouts, reduced delta power in NREM sleep and delay in sleep onset following SD. A more careful examination of the development of the mechanisms and brain regions that regulate arousal and how they interact with those that promote sleep during the third and fourth postnatal week is warranted to support this hypothesis.
Overall, our results support a reduction of sleep as a core aspect of ASD, while highlighting a period during early life in which the abnormal sleep phenotype fully emerges and may be amenable to intervention. Our results support an excessive arousing input from the circadian clock emerging too early in development as a plausible mechanistic explanation for the observed Shank3∆C sleep phenotype. Further replication of our findings in other mouse models of ASD is needed to dissect which aspects of the sleep phenotype may be specific to the mutation we are modeling. Last, brain development in mice can be substantially different from brain development in humans. Therefore, although rodent studies can be used as broad guidelines, objective longitudinal studies of sleep in both typically developing children and infants at high risk for ASD are still necessary to determine which of the features we identified in mice apply to ASD in humans.
DECLARATION OF TRANSPARENCY
The authors, reviewers and editors affirm that in accordance to the policies set by the Journal of Neuroscience Research, this manuscript presents an accurate and transparent account of the study being reported and that all critical details describing the methods and results are present.
AUTHOR CONTRIBUTIONS
All authors had full access to all the data in the study and take responsibility for the integrity of the data. Conceptualization, H.S., E.M., and L.P.; Methodology, E.M., T.W., K.F., K.S., and H.S.; Data Curation, T.W., E.M, K.F., and H.S., Writing – Original Draft, L.P.; Writing – Review & Editing, H.S, E.M, K.S., and L.P.; Visualization, E.M., H.S., and L.P.; Supervision, L.P.; Funding Acquisition, L.P.
FUNDING INFORMATION
This work was supported by the Justice Equity Diversity and Inclusion (JEDI) award from the Life Science Editors foundation and K01NS104172 from NIH/NINDS to Peixoto L.
CONFLICT OF INTEREST
The authors have no conflict of interests to declare.
PEER REVIEW
The peer review history for this article is available at https://publons.com/publon/10.1002/jnr.25119.
PREPRINT REPOSITORY
This article has been submitted to bioRxiv: https://doi.org/10.1101/2021.03.10.434728
Supporting information
TABLE 1‐SUPPLEMENT 1 Shank3ΔC mice sleep more during the light period. Ratio of sleep occurring in the light period relative to sleep occurring in the dark period. Sleep was recorded at P23 (n = 7 WT, 8 Shank3ΔC), P29 (n = 7 WT, 9 Shank3ΔC), P44 (n = 6 WT, 7 Shank3ΔC), and P59 (n = 8 WT, 7 Shank3ΔC). Wild‐type data is shown in black, Shank3ΔC is shown in red. A two way ANOVA (genotype × age) revealed a significant main effect of age (F(3, 51) = 5.57, p = .002), and genotype (F(1, 51) = 17.270, p < .001) but no significant interaction between age and genotype. Post‐hoc t‐test with a Hochberg correction were performed. *denotes p‐values < .05 between genotype, P23 p = .002, P59 p = .03. #denotes p‐values < .05 across age, Wildtypes p = .017.
FIGURE 2‐SUPPLEMENT 1 Shank3ΔC mice display reduced NREM sleep throughout their lifespan and increased REM sleep when young under baseline conditions. (a) Time in wakefulness, NREM sleep and REM sleep during baseline 24‐h recordings is shown as a percentage of recording time per hour (average and standard error). Sleep was recorded at P23 (n = 7 WT, 8 Shank3ΔC), P29 (n = 7 WT, 9 Shank3ΔC), P44 (n = 6 WT, 7 Shank3ΔC), P59 (n = 8 WT, 7 Shank3ΔC) mice. *p < .05. WT in black, Shank3ΔC in red. (b) Statistical significance was determined using repeated measures‐ANOVA, main effect of genotype over a 12‐h period. Light period (hours 0–12) and dark period (hours 13–24) were tested separately.
FIGURE 2‐SUPPLEMENT 2 Age‐dependent loss of baseline sleep time in Shank3ΔC mice is driven by reduced duration of NREM bouts. The rows represent average number (a–c) and duration (d–f) of bouts of wakefulness (a, d), NREM sleep (b, e), and REM sleep (c, f) during baseline 12 h light (white) and dark (gray) periods. Sleep was recorded at P23 (n = 7 WT, 8 Shank3ΔC), P29 (n = 7 WT, 9 Shank3ΔC), P44 (n = 6 WT, 7 Shank3ΔC), P59 (n = 8 WT, 7 Shank3ΔC) mice. WT in black, Shank3ΔC in red. T‐test performed post‐hoc across age multiple testing corrected using Hochberg, following a 2‐way ANOVA (age × genotype). *p‐Value < .05 across genotype. Bout Number: REM LP P23 (p = 1.6e−3). Bout Duration: NREM LP P23 (p = .018), P29 (p = .033). NREM DP P23 (p = 7.7e−5), P44 (p = .034), P59 (p = 4.0e−3). # p‐Values < .05 across age. Bout Number: Wake LP WT P23 vs. P29 (p = .027), Mutant P23 vs. P29 (p = .014). NREM LP WT P44 vs. P59 (p = .025). NREM DP WT P23 vs. P29 (p = 4.0e−3). REM LP Mutant P23 vs. P29 (p = 5.8e−3). REM DP WT P23 vs. P29 (p = 3.5e−4), WT P29 vs. P44 (p = .030), Mutant P23 vs. P29 (p = .023). Bout Duration: NREM LP WT P23 vs. P29 (p = 6.0e−3), WT P29 vs. P44 (p = .024), Mutant P23 vs. P29 (p = .012). REM DP WT P23 vs. P29 (p = 7.3e−4). (g) Two way‐ANOVA results. Light period (hours 0–12) and dark period (hours 13–24) were tested separately.
FIGURE 2‐SUPPLEMENT 3 EEG traces in Shank3ΔC mice exhibit typical age‐ and state‐specific changes across development. Example EEG (blue) and EMG (red) traces from Wake, NREM, and REM from one Wild‐type and one Shank3ΔC mouse at P23, P29, P44, P59. Traces are selected from baseline light period recordings and are comprised of two 4‐s epochs (denoted by vertical gray lines). Scale and gain are the same across all ages.
FIGURE 3‐SUPPLEMENT 1 Age‐specific spectral differences in Shank3ΔC mice are also present in the light period. The rows represent vigilance states of wakefulness (top), NREM sleep (middle), and REM sleep (bottom). EEG spectral power in the dark period normalized as a percentage of total state‐specific EEG power at P23 (n = 6 WT, 8 Shank3ΔC), P29 (n = 6 WT, 7 Shank3ΔC), P44 (n = 4 WT, 6 Shank3ΔC), P59 (n = 8 WT, 7 Shank3ΔC). Spectra are graphed as smooth lines in black for WT and red for Shank3ΔC. 95% confidence intervals are displayed around each spectrum, light gray for WT, and light red for Shank3ΔC. Frequency in the x‐axis is in hertz.
FIGURE 3‐SUPPLEMENT 2 (a) Shank3ΔC mice at baseline show reduced NREM delta activity across all ages and a reduction in Wake theta at younger ages. Normalized delta (.5–4 Hz) power in baseline NREM sleep (top) and normalized Wake theta (5–7 Hz) (bottom). EEG spectral power was normalized as a percentage of total state‐specific EEG power at P23 (n = 6 WT, 8 Shank3ΔC), P29 (n = 6 WT, 7 Shank3ΔC), P44 (n = 4 WT, 6 Shank3ΔC), P59 (n = 8 WT, 7 Shank3ΔC). Wildtype data is shown in black, Shank3ΔC is shown in red. Main effect of genotype is indicated by (#). (b) Test‐statistics for one‐ way ANOVA for baseline delta power and repeated measures ANOVA for theta power.
FIGURE 4‐SUPPLEMENT 1 Sleep latency following SD is unchanged at P45 and P60. P45 (n = 6 WT, 7 Shank3ΔC), P60 (n = 7 WT, 6 Shank3ΔC) mice for sleep latency; P45 (n = 4 WT, 8 Shank3ΔC), P30 (n = 5 WT, 5 Shank3ΔC) mice for spectral analysis. (a) Latency to the first bout of NREM following 3 h of SD. T‐test p‐values p < .05 are indicated for genotype differences (*). (b) Normalized NREM delta (.5–4 Hz) power during recovery sleep after 3 h of SD during the light period relative to NREM delta power during the last 4 h of the light period for the same animal at baseline. (c) Normalized Wake theta (5–7 Hz) power during 3 h of SD and subsequent recovery sleep in the light period relative to Wake theta power at baseline for the same animal. One‐way ANOVA p‐values p < .05 are indicated for genotype differences (#). P60 Delta F(1,106) = 4.364, p = .04.
FIGURE 4‐SUPPLEMENT 2 Latency to fall asleep changes over time in WT but not in Shank3ΔC mice. Difference in latency (in minutes) to the first bout of NREM sleep following 3 h of sleep deprivation across time‐points. Wildtype data is shown in black, Shank3ΔC is shown in red. P24 (n = 7 WT, 8 Shank3ΔC), P30 (n = 6 WT, 8 Shank3ΔC), P45 (n = 6 WT, 7 Shank3ΔC), P60 (n = 7 WT, 6 Shank3ΔC), and P90 (n = 10 WT, 11 Shank3ΔC) mice. One‐way ANOVA p‐values p < .05 are indicated for age differences (*). Wildtype F(4, 31) = 5.014, p = .003.
FIGURE 4‐SUPPLEMENT 3 Sleep latency is increased in adult (P90) mice following either 3 or 5 h of SD. Latency to the first bout of NREM sleep following 3 or 5 h of sleep deprivation. P90 (3 h) 10 WT and 11 mutants; P90 (5 h) 9 WT 10 mutants. Wildtype data is shown in black, Shank3ΔC is shown in red. *denotes one tailed t‐test significant p‐value. P90 3 h SD p = .0008, P90 5 h SD p = .004.
Transparent Science Questionnaire for Authors
ACKNOWLEDGMENTS
We thank Dr. Marcos Frank for valuable discussions. We also thank Dr. Christine Muheim and Dr. Ashley Ingiosi for their helpful advice regarding experimental design and data analysis. We thank Dr. Paul Worley for providing the Shank3 mutant mouse line. Graphical abstract and part of figure 1 was created using Biorender.com. This work was supported by the Justice Equity Diversity and Inclusion (JEDI) award from the Life Science Editors foundation and K01NS104172 from NIH/NINDS to Peixoto L.
Medina, E. , Schoch, H. , Ford, K. , Wintler, T. , Singletary, K. G. , & Peixoto, L. (2022). Shank3 influences mammalian sleep development. Journal of Neuroscience Research, 100, 2174–2186. 10.1002/jnr.25119
Edited by Cristina Antonella Ghiani and Stephan Michel. Reviewed by Huei‐Bin Wang, Mathew Kayser, and Jonathan Lipton.
DATA AVAILABILITY STATEMENT
The raw EEG data that support the findings of this study are available from the corresponding author upon reasonable request.
REFERENCES
- Bian, W.‐J. , Brewer, C. L. , Kauer, J. A. , & de Lecea, L. (2022). Adolescent sleep shapes social novelty preference in mice. Nature Neuroscience, 25, 912–923. 10.1038/s41593-022-01076-8 [DOI] [PMC free article] [PubMed] [Google Scholar]
- Borbély, A. A. (1982). A two process model of sleep regulation. Human Neurobiology, 1(3), 195–204. [PubMed] [Google Scholar]
- Cochoy, D. M. , Kolevzon, A. , Kajiwara, Y. , Schoen, M. , Pascual‐Lucas, M. , Lurie, S. , Buxbaum, J. D. , Boeckers, T. M. , & Schmeisser, M. J. (2015). Phenotypic and functional analysis of SHANK3 stop mutations identified in individuals with ASD and/or ID. Molecular Autism, 6, 23. 10.1186/s13229-015-0020-5 [DOI] [PMC free article] [PubMed] [Google Scholar]
- Doldur‐Balli, F. , Imamura, T. , Veatch, O. J. , Gong, N. N. , Lim, D. C. , Hart, M. P. , Abel, T. , Kayser, M. S. , Brodkin, E. S. , & Pack, A. I. (2022). Synaptic dysfunction connects autism spectrum disorder and sleep disturbances: A perspective from studies in model organisms. Sleep Medicine Reviews, 62, 101595. 10.1016/j.smrv.2022.101595 [DOI] [PMC free article] [PubMed] [Google Scholar]
- Frank, M. G. (2020). The ontogenesis of mammalian sleep: Form and function. Current Sleep Medicine Reports, 6(4), 267–279. 10.1007/s40675-020-00190-y [DOI] [PMC free article] [PubMed] [Google Scholar]
- Frank, M. G. , & Heller, H. C. (1997). Development of REM and slow wave sleep in the rat. The American Journal of Physiology, 272(6 Pt 2), R1792–R1799. 10.1152/ajpregu.1997.272.6.R1792 [DOI] [PubMed] [Google Scholar]
- Frank, M. G. , Morrissette, R. , & Heller, H. C. (1998). Effects of sleep deprivation in neonatal rats. The American Journal of Physiology, 275(1 Pt 2), R148–R157. [DOI] [PubMed] [Google Scholar]
- Frank, M. G. , Ruby, N. F. , Heller, H. C. , & Franken, P. (2017). Development of circadian sleep regulation in the rat: A longitudinal study under constant conditions. Sleep, 40(3), zsw077. 10.1093/sleep/zsw077 [DOI] [PMC free article] [PubMed] [Google Scholar]
- Franken, P. , Chollet, D. , & Tafti, M. (2001). The homeostatic regulation of sleep need is under genetic control. Journal of Neuroscience, 21(8), 2610–2621. [DOI] [PMC free article] [PubMed] [Google Scholar]
- Hassani Nia, F. , Woike, D. , Kloth, K. , Kortüm, F. , & Kreienkamp, H.‐J. (2020). Truncating mutations in SHANK3 associated with global developmental delay interfere with nuclear β‐catenin signaling. Journal of Neurochemistry, 155(3), 250–263. 10.1111/jnc.15014 [DOI] [PubMed] [Google Scholar]
- Hodge, D. , Carollo, T. M. , Lewin, M. , Hoffman, C. D. , & Sweeney, D. P. (2014). Sleep patterns in children with and without autism spectrum disorders: Developmental comparisons. Research in Developmental Disabilities, 35(7), 1631–1638. 10.1016/j.ridd.2014.03.037 [DOI] [PubMed] [Google Scholar]
- Hysing, M. , Harvey, A. G. , Bøe, T. , Heradstveit, O. , Vedaa, Ø. , & Sivertsen, B. (2020). Trajectories of sleep problems from adolescence to adulthood. Linking two population‐based studies from Norway. Sleep Medicine, 75, 411–417. 10.1016/j.sleep.2020.08.035 [DOI] [PubMed] [Google Scholar]
- Hysing, M. , Pallesen, S. , Stormark, K. M. , Lundervold, A. J. , & Sivertsen, B. (2013). Sleep patterns and insomnia among adolescents: A population‐based study. Journal of Sleep Research, 22(5), 549–556. 10.1111/jsr.12055 [DOI] [PubMed] [Google Scholar]
- Ingiosi, A. M. , Schoch, H. , Wintler, T. , Singletary, K. G. , Righelli, D. , Roser, L. G. , Medina, E. , Risso, D. , Frank, M. G. , & Peixoto, L. (2019). Shank3 modulates sleep and expression of circadian transcription factors. eLife, 8, e42819. 10.7554/eLife.42819 [DOI] [PMC free article] [PubMed] [Google Scholar]
- Jones, C. E. , Opel, R. A. , Kaiser, M. E. , Chau, A. Q. , Quintana, J. R. , Nipper, M. A. , Finn, D. A. , Hammock, E. A. D. , & Lim, M. M. (2019). Early‐life sleep disruption increases parvalbumin in primary somatosensory cortex and impairs social bonding in prairie voles. Science Advances, 5(1), eaav5188. 10.1126/sciadv.aav5188 [DOI] [PMC free article] [PubMed] [Google Scholar]
- Kouser, M. , Speed, H. E. , Dewey, C. M. , Reimers, J. M. , Widman, A. J. , Gupta, N. , Liu, S. , Jaramillo, T. C. , Bangash, M. , Xiao, B. , Worley, P. F. , & Powell, C. M. (2013). Loss of predominant Shank3 isoforms results in hippocampus‐dependent impairments in behavior and synaptic transmission. Journal of Neuroscience, 33(47), 18448–18468. 10.1523/JNEUROSCI.3017-13.2013 [DOI] [PMC free article] [PubMed] [Google Scholar]
- MacDuffie, K. E. , Munson, J. , Greenson, J. , Ward, T. M. , Rogers, S. J. , Dawson, G. , & Estes, A. (2020). Sleep problems and trajectories of restricted and repetitive behaviors in children with neurodevelopmental disabilities. Journal of Autism and Developmental Disorders, 50, 3844–3856. 10.1007/s10803-020-04438-y [DOI] [PMC free article] [PubMed] [Google Scholar]
- MacDuffie, K. E. , Shen, M. D. , Dager, S. R. , Styner, M. A. , Kim, S. H. , Paterson, S. , Pandey, J. , St John, T. , Elison, J. T. , Wolff, J. J. , Swanson, M. R. , Botteron, K. N. , Zwaigenbaum, L. , Piven, J. , & Estes, A. M. (2020). Sleep onset problems and subcortical development in infants later diagnosed with autism spectrum disorder. The American Journal of Psychiatry, 177(6), 518–525. 10.1176/appi.ajp.2019.19060666 [DOI] [PMC free article] [PubMed] [Google Scholar]
- Maxwell‐Horn, A. , & Malow, B. A. (2017). Sleep in autism. Seminars in Neurology, 37(4), 413–418. 10.1055/s-0037-1604353 [DOI] [PubMed] [Google Scholar]
- Nelson, A. B. , Faraguna, U. , Zoltan, J. T. , Tononi, G. , & Cirelli, C. (2013). Sleep patterns and homeostatic mechanisms in adolescent mice. Brain Sciences, 3(1), 318–343. 10.3390/brainsci3010318 [DOI] [PMC free article] [PubMed] [Google Scholar]
- Ottaviano, S. , Giannotti, F. , Cortesi, F. , Bruni, O. , & Ottaviano, C. (1996). Sleep characteristics in healthy children from birth to 6 years of age in the urban area of Rome. Sleep, 19(1), 1–3. [PubMed] [Google Scholar]
- Petruzzelli, M. G. , Matera, E. , Giambersio, D. , Marzulli, L. , Gabellone, A. , Legrottaglie, A. R. , Margari, A. , & Margari, L. (2021). Subjective and electroencephalographic sleep parameters in children and adolescents with autism spectrum disorder: A systematic review. Journal of Clinical Medicine, 10(17), 3893. 10.3390/jcm10173893 [DOI] [PMC free article] [PubMed] [Google Scholar]
- Rensing, N. , Moy, B. , Friedman, J. L. , Galindo, R. , & Wong, M. (2018). Longitudinal analysis of developmental changes in electroencephalography patterns and sleep‐wake states of the neonatal mouse. PLoS One, 13(11), e0207031. 10.1371/journal.pone.0207031 [DOI] [PMC free article] [PubMed] [Google Scholar]
- Roffwarg, H. P. , Muzio, J. N. , & Dement, W. C. (1966). Ontogenetic development of the human sleep‐dream cycle. Science, 152(3722), 604–619. 10.1126/science.152.3722.604 [DOI] [PubMed] [Google Scholar]
- Rylaarsdam, L. , & Guemez‐Gamboa, A. (2019). Genetic causes and modifiers of autism spectrum disorder. Frontiers in Cellular Neuroscience, 13, 385. 10.3389/fncel.2019.00385 [DOI] [PMC free article] [PubMed] [Google Scholar]
- Souders, M. C. , Zavodny, S. , Eriksen, W. , Sinko, R. , Connell, J. , Kerns, C. , Schaaf, R. , & Pinto‐Martin, J. (2017). Sleep in children with autism spectrum disorder. Current Psychiatry Reports, 19(6), 34. 10.1007/s11920-017-0782-x [DOI] [PMC free article] [PubMed] [Google Scholar]
- Vassalli, A. , & Franken, P. (2017). Hypocretin (orexin) is critical in sustaining theta/gamma‐rich waking behaviors that drive sleep need. Proceedings of the National Academy of Sciences of the United States of America, 114(27), E5464–E5473. 10.1073/pnas.1700983114 [DOI] [PMC free article] [PubMed] [Google Scholar]
- Wintler, T. , Schoch, H. , Frank, M. G. , & Peixoto, L. (2020). Sleep, brain development, and autism spectrum disorders: Insights from animal models. Journal of Neuroscience Research, 98, 1137–1149. 10.1002/jnr.24619 [DOI] [PMC free article] [PubMed] [Google Scholar]
- Workman, A. D. , Charvet, C. J. , Clancy, B. , Darlington, R. B. , & Finlay, B. L. (2013). Modeling transformations of neurodevelopmental sequences across mammalian species. Journal of Neuroscience, 33(17), 7368–7383. 10.1523/JNEUROSCI.5746-12.2013 [DOI] [PMC free article] [PubMed] [Google Scholar]
- Zwaigenbaum, L. , Bryson, S. , Rogers, T. , Roberts, W. , Brian, J. , & Szatmari, P. (2005). Behavioral manifestations of autism in the first year of life. International Journal of Developmental Neuroscience, 23(2–3), 143–152. 10.1016/j.ijdevneu.2004.05.001 [DOI] [PubMed] [Google Scholar]
Associated Data
This section collects any data citations, data availability statements, or supplementary materials included in this article.
Supplementary Materials
TABLE 1‐SUPPLEMENT 1 Shank3ΔC mice sleep more during the light period. Ratio of sleep occurring in the light period relative to sleep occurring in the dark period. Sleep was recorded at P23 (n = 7 WT, 8 Shank3ΔC), P29 (n = 7 WT, 9 Shank3ΔC), P44 (n = 6 WT, 7 Shank3ΔC), and P59 (n = 8 WT, 7 Shank3ΔC). Wild‐type data is shown in black, Shank3ΔC is shown in red. A two way ANOVA (genotype × age) revealed a significant main effect of age (F(3, 51) = 5.57, p = .002), and genotype (F(1, 51) = 17.270, p < .001) but no significant interaction between age and genotype. Post‐hoc t‐test with a Hochberg correction were performed. *denotes p‐values < .05 between genotype, P23 p = .002, P59 p = .03. #denotes p‐values < .05 across age, Wildtypes p = .017.
FIGURE 2‐SUPPLEMENT 1 Shank3ΔC mice display reduced NREM sleep throughout their lifespan and increased REM sleep when young under baseline conditions. (a) Time in wakefulness, NREM sleep and REM sleep during baseline 24‐h recordings is shown as a percentage of recording time per hour (average and standard error). Sleep was recorded at P23 (n = 7 WT, 8 Shank3ΔC), P29 (n = 7 WT, 9 Shank3ΔC), P44 (n = 6 WT, 7 Shank3ΔC), P59 (n = 8 WT, 7 Shank3ΔC) mice. *p < .05. WT in black, Shank3ΔC in red. (b) Statistical significance was determined using repeated measures‐ANOVA, main effect of genotype over a 12‐h period. Light period (hours 0–12) and dark period (hours 13–24) were tested separately.
FIGURE 2‐SUPPLEMENT 2 Age‐dependent loss of baseline sleep time in Shank3ΔC mice is driven by reduced duration of NREM bouts. The rows represent average number (a–c) and duration (d–f) of bouts of wakefulness (a, d), NREM sleep (b, e), and REM sleep (c, f) during baseline 12 h light (white) and dark (gray) periods. Sleep was recorded at P23 (n = 7 WT, 8 Shank3ΔC), P29 (n = 7 WT, 9 Shank3ΔC), P44 (n = 6 WT, 7 Shank3ΔC), P59 (n = 8 WT, 7 Shank3ΔC) mice. WT in black, Shank3ΔC in red. T‐test performed post‐hoc across age multiple testing corrected using Hochberg, following a 2‐way ANOVA (age × genotype). *p‐Value < .05 across genotype. Bout Number: REM LP P23 (p = 1.6e−3). Bout Duration: NREM LP P23 (p = .018), P29 (p = .033). NREM DP P23 (p = 7.7e−5), P44 (p = .034), P59 (p = 4.0e−3). # p‐Values < .05 across age. Bout Number: Wake LP WT P23 vs. P29 (p = .027), Mutant P23 vs. P29 (p = .014). NREM LP WT P44 vs. P59 (p = .025). NREM DP WT P23 vs. P29 (p = 4.0e−3). REM LP Mutant P23 vs. P29 (p = 5.8e−3). REM DP WT P23 vs. P29 (p = 3.5e−4), WT P29 vs. P44 (p = .030), Mutant P23 vs. P29 (p = .023). Bout Duration: NREM LP WT P23 vs. P29 (p = 6.0e−3), WT P29 vs. P44 (p = .024), Mutant P23 vs. P29 (p = .012). REM DP WT P23 vs. P29 (p = 7.3e−4). (g) Two way‐ANOVA results. Light period (hours 0–12) and dark period (hours 13–24) were tested separately.
FIGURE 2‐SUPPLEMENT 3 EEG traces in Shank3ΔC mice exhibit typical age‐ and state‐specific changes across development. Example EEG (blue) and EMG (red) traces from Wake, NREM, and REM from one Wild‐type and one Shank3ΔC mouse at P23, P29, P44, P59. Traces are selected from baseline light period recordings and are comprised of two 4‐s epochs (denoted by vertical gray lines). Scale and gain are the same across all ages.
FIGURE 3‐SUPPLEMENT 1 Age‐specific spectral differences in Shank3ΔC mice are also present in the light period. The rows represent vigilance states of wakefulness (top), NREM sleep (middle), and REM sleep (bottom). EEG spectral power in the dark period normalized as a percentage of total state‐specific EEG power at P23 (n = 6 WT, 8 Shank3ΔC), P29 (n = 6 WT, 7 Shank3ΔC), P44 (n = 4 WT, 6 Shank3ΔC), P59 (n = 8 WT, 7 Shank3ΔC). Spectra are graphed as smooth lines in black for WT and red for Shank3ΔC. 95% confidence intervals are displayed around each spectrum, light gray for WT, and light red for Shank3ΔC. Frequency in the x‐axis is in hertz.
FIGURE 3‐SUPPLEMENT 2 (a) Shank3ΔC mice at baseline show reduced NREM delta activity across all ages and a reduction in Wake theta at younger ages. Normalized delta (.5–4 Hz) power in baseline NREM sleep (top) and normalized Wake theta (5–7 Hz) (bottom). EEG spectral power was normalized as a percentage of total state‐specific EEG power at P23 (n = 6 WT, 8 Shank3ΔC), P29 (n = 6 WT, 7 Shank3ΔC), P44 (n = 4 WT, 6 Shank3ΔC), P59 (n = 8 WT, 7 Shank3ΔC). Wildtype data is shown in black, Shank3ΔC is shown in red. Main effect of genotype is indicated by (#). (b) Test‐statistics for one‐ way ANOVA for baseline delta power and repeated measures ANOVA for theta power.
FIGURE 4‐SUPPLEMENT 1 Sleep latency following SD is unchanged at P45 and P60. P45 (n = 6 WT, 7 Shank3ΔC), P60 (n = 7 WT, 6 Shank3ΔC) mice for sleep latency; P45 (n = 4 WT, 8 Shank3ΔC), P30 (n = 5 WT, 5 Shank3ΔC) mice for spectral analysis. (a) Latency to the first bout of NREM following 3 h of SD. T‐test p‐values p < .05 are indicated for genotype differences (*). (b) Normalized NREM delta (.5–4 Hz) power during recovery sleep after 3 h of SD during the light period relative to NREM delta power during the last 4 h of the light period for the same animal at baseline. (c) Normalized Wake theta (5–7 Hz) power during 3 h of SD and subsequent recovery sleep in the light period relative to Wake theta power at baseline for the same animal. One‐way ANOVA p‐values p < .05 are indicated for genotype differences (#). P60 Delta F(1,106) = 4.364, p = .04.
FIGURE 4‐SUPPLEMENT 2 Latency to fall asleep changes over time in WT but not in Shank3ΔC mice. Difference in latency (in minutes) to the first bout of NREM sleep following 3 h of sleep deprivation across time‐points. Wildtype data is shown in black, Shank3ΔC is shown in red. P24 (n = 7 WT, 8 Shank3ΔC), P30 (n = 6 WT, 8 Shank3ΔC), P45 (n = 6 WT, 7 Shank3ΔC), P60 (n = 7 WT, 6 Shank3ΔC), and P90 (n = 10 WT, 11 Shank3ΔC) mice. One‐way ANOVA p‐values p < .05 are indicated for age differences (*). Wildtype F(4, 31) = 5.014, p = .003.
FIGURE 4‐SUPPLEMENT 3 Sleep latency is increased in adult (P90) mice following either 3 or 5 h of SD. Latency to the first bout of NREM sleep following 3 or 5 h of sleep deprivation. P90 (3 h) 10 WT and 11 mutants; P90 (5 h) 9 WT 10 mutants. Wildtype data is shown in black, Shank3ΔC is shown in red. *denotes one tailed t‐test significant p‐value. P90 3 h SD p = .0008, P90 5 h SD p = .004.
Transparent Science Questionnaire for Authors
Data Availability Statement
The raw EEG data that support the findings of this study are available from the corresponding author upon reasonable request.