

Abstract
Glycochenodeoxycholate-3-sulfate (GCDCA-S) and chenodeoxycholate 24-glucuronide (CDCA-24G) are bile acid metabolites that potentially serve as endogenous biomarkers for drug-drug interactions mediated by the hepatic uptake transporters OATP1B1 and OATP1B3. We developed and validated a novel UHPLC-MS/MS method for the quantitative determination of GCDCA-S and CDCA-24G in mouse and human plasma with a lower limit of quantitation of 0.5 ng/mL. Chromatographic separation was achieved on an Accucore aQ column (50 mm × 2.1 mm, dp =2.6 μm) maintained at 20 °C and a gradient mobile phase comprising 2 mM ammonium acetate in water and methanol. The extraction recoveries of GCDCA-S and CDCA-24G were >80%, and linear (r2>0.99) calibration curves ranged 0.5–100 ng/mL (CDCA-24G and GCDCA-S in mouse plasma) or 0.5–1000 ng/mL (GCDCA-S in mouse plasma). Values for precision (CV <11.6%) and accuracy bias (10.9%) of analyte-spiked quality control samples verified that water was an acceptable matrix to prepare calibrators. This method was successfully applied to establish baseline activity of OATP1B1/OATP1B3 in humans and mice and establish the in vivo effects of OATP1B1/OATP1B3 inhibitors rifampin and micafungin.
Keywords: Endogenous biomarkers, Drug-drug interactions, UHPLC-MS/MS, OATP1B transport, bile acids
1. Introduction
Pharmacokinetic drug-drug interactions (DDIs) are a common mechanism underlying adverse events or treatment failure when a perpetrator drug is administrated simultaneously with a victim drug [1–3]. Such DDIs may occur through several mechanisms, including changes in activity of drug-metabolizing enzymes and transporters of relevance to the victim drug [4–6]. A wealth of recent evidence has indicated that many prescription drugs have a propensity to inhibit of hepatic uptake mediated by the organic anion transporting polypeptides OATP1B1 and OATP1B3 (collectively referred to as OATP1B) [7, 8], and that this process can result in clinically-relevant DDIs with transported substrates [9, 10]. For example, the antibiotic rifampin is a potent OATP1B inhibitor and short-term exposure can increase systemic exposure to various drugs for which elimination is rate-limited by OATP1B-mediated transport [11].
In recent years, various endogenous OATP1B substrates have been proposed that could serve as clinically useful biomarkers to predict the ability of OATP1B inhibitors to cause potentially harmful DDIs in vivo [12–15]. Among endogenous candidate, the bile acid metabolites glycochenodeoxycholate-3-sulfate (GCDCA-S) and chenodeoxycholate 24-glucuronide (CDCA-24G) are confirmed OATP1B substrates [13, 16] and their circulating levels are sensitive to treatment with rifampin, supporting their utility as probes for the quantitative assessment of OATP1B-mediated DDIs [13]. Previously reported analytical methods for quantifying GCDCA-S and CDCA-24G either required large samples volumes (>100 μL) to achieve adequate sensitivity [17] or compromised the lower limit of quantitation (>2.6 ng/mL) when smaller volumes were employed (20 μL) [13]. In this study, we set out to develop a simple and sensitive LC-MS/MS method (0.5 ng/mL) for determining the concentration of GCDCA-S and CDCA-24G in mouse or human plasma that only requires micro-volumes of sample (10 μL). In addition, we demonstrate the applicability of the developed method in multiple murine and human studies as part of a project to define the landscape of OATP1B inhibitors among FDA-approved drugs in vivo.
2. Materials and methods
2.1. Chemical and reagents
All reagents utilized were of analytical grade. Reference standards of GCDCA-S and CDCA-24G and their respective internal standards (IS) [2H5]-GCDCAS (GCDCA-S-d5, isotopic purity: 99.9%) and [2H5]-CDCA24G (CDCA-24G-d5, isotopic purity: 96.8%) were purchased from Toronto Research Chemicals (North York, ON, Canada). Ammonium acetate (Bioultra grade for molecular biology) was purchased from Sigma Aldrich (St. Louis, MO, USA). Methanol (Optima, LC/MS grade) was purchased from Fisher Scientific (Fair Lawn, NJ, USA) and used as mobile phase and dissolving solvent. Rifampin and micafungin were obtained from MedChemExpress (Monmouth Junction, NJ, USA).
2.2. Instrumentation and chromatographic conditions
Negative ion electrospray LC-MS/MS analysis was performed on a Quantiva triple quadrupole mass spectrometer with Vanquish UHPLC (Thermo Scientific, Waltham, MA, USA). The autosampler temperature was maintained at 4°C, and chromatographic separation was performed at 20°C on an Accucore aQ column (50 mm × 2.1 mm, dp =2.6 μm, Thermo Fisher Scientific), equipped with a C18 AQUASIL guard cartridge (2.1 mm × 10 mm, dp =3 μm, Thermo Fisher Scientific). The separation was carried out in gradient mode using solvent A (2 mmol ammonium acetate in water) and solvent B (100% methanol). A gradient elution was performed with 45% B for 0.5 min, a linear increase to 90% B until 2 min, followed by 45% B from 4.0 min until 4.6 min. The flow rate was set to 0.4 mL/min. To minimize contamination of the mass spectrometer, the flow was only directed into the mass spectrometer using a diverter valve between 0.5 and 4.1 min and redirected into waste otherwise.
The temperature of ion transfer tube and the vaporizer were set to 335°C and 350°C, respectively. The ion source was operated using heated ESI with the ion spray voltage set at 3791 V in negative ion mode, and argon was used as the collision gas at a pressure of 1.5 mTorr. The other parameters for MS were a sheath gas flow of 15 arbitrary units (AU), aux gas flow of 5.2 AU and the sweep gas flow of 0.5 AU. Analytes were monitored in the selective reaction monitoring (SRM), and mass transitions and MS parameters are listed in Table 1. Thermo Scientific Xcalibur (version 4.4.16.14, Thermo Fisher Scientific) was used for data acquisition and processing.
Table 1.
Retention time, precursor molecular ion/product ion for quantification, and detection parameters for each analyte.
| Analytes | Precursor (m/z) | Product (m/z) | CE (V) | RF Lens (V) | RT (min) |
|---|---|---|---|---|---|
| GCDCA-S | 528.4 | 448.3 | 28.6 | 96 | 2.06 |
| CDCA-24G | 567.4 | 391.1 | 33.5 | 77 | 2.38 |
| GCDCA-S-d5 | 533.5 | 453.3 | 29.4 | 99 | 2.06 |
| CDCA-24G-d5 | 572.5 | 396.1 | 34.6 | 79 | 2.38 |
Abbreviation: CE, Collision Energy; RT, Retention Time.
2.3. Preparation of calibration standards and quality control sample for method validation
For each analyte, two primary stock solution were prepared at 2 mg/mL in double-distilled water and the internal standards (GCDCA-S-d5 and CDCA-24G-d5) were prepared at 10 mg/mL in DMSO. The two stocks of each analyte (i.e., GCDCA-S and CDCA-24G) were further diluted with methanol for the preparation of working standards and quality controls (QCs), respectively. A combined working solution of internal standards (1 μg/mL) was prepared by diluting the stock solutions with methanol. All solutions were stored at −20 °C until analysis.
Because of the endogenous presence of GCDCA-S and CDCA-24G in plasma, water was used as a substitute artificial matrix to prepare the calibration standards to improve sensitivity of the method. The calibration curve standard of CDCA-24G consisted of a set of seven non-zero concentrations ranging from 0.5 to 100 ng/mL in both in mouse and human plasma, while the calibration curve standards of GCDCA-S consisted of concentrations ranging 0.5 to 100 ng/mL (mouse) or 0.5 to 1000 ng/mL (human), respectively.
Blank plasma from untreated healthy adult mice of different inbred strains were screened initially for endogenous levels of GCDCA-S and CDCA-24G, and this analysis indicated that GCDCA-S was rarely even detectable while the concentrations of CDCA-24G were lowest in male FVB mice (ranging from undetectable to 5.9 ng/mL). Therefore, five lots of blank plasma from male FVB mice containing undetectable levels of GCDCA-S and CDCA-24G were pooled together and used for the preparation of QC samples. The three levels of final QCs were 1.5 (low quality-control, LQC), 40 (medium quality-control, MQC) and 90 (high quality-control, HQC) ng/mL. An additional QC sample containing the analytes at a concentration of 900 ng/mL was used to establish the feasibility of diluting samples 10-fold with pooled plasma prior to analysis.
Blank human K2-EDTA plasma (BIOVIT, Hicksville, NY, USA) from different lots were screened initially for their endogenous level of GCDCA-S and CDCA-24G, and the backward calculation indicated that concentrations of GCDCA-S and CDCA-24G ranged from 5.81 to 2787 ng/mL and from undetectable to 540 ng/mL, respectively. Five lots of blank human K2-EDTA plasma with the lowest relative signal responses corresponding to GCDCA-S and CDCA-24G were then pooled together and used for the preparation of QC samples. However, the LQC in the authentic matrix (i.e., 5 and 1.5 ng/mL for GCDCA-S and CDCA-24G) failed pre-set criteria for precision and accuracy, and water was used instead as a substitute matrix. The other two QC levels including MQC and HQC, were prepared by spiking the respective amount of complement of GCDCA-S and CDCA-24G into the pooled human K2-EDTA plasma to make the QC samples at MQC (400 and 40 ng/mL for GCDCA-S and CDCA-24G, respectively) and HQC (900 and 90 ng/mL for GCDCA-S and CDCA-24G, respectively). The dilution-QC samples (9000 and 900 ng/mL GCDCA-S and CDCA-24G, respectively) were diluted 10-fold with corresponding matrix before analysis. Based on the above considerations, for all analytes QC samples containing the lower limit of quantitation (LLOQ) of 0.5 ng/mL were also prepared in water.
2.4. Method validation
2.4.1. Linearity, accuracy, and precision
The calibration curves were constructed in replicate (n=2 per day) from seven non-zero calibration standards (described in section in 2.3), a blank and a zero-calibration standard (blank spiked with IS) on each day of four consecutive validation days by plotting the peak area ratio of each analyte to their respective internal standard against the nominal concentrations of the compounds. The correlation coefficients (r2) were calculated by weighted (1/x2) least-square regression and these values were required to be higher than 0.99.
Intra-day accuracy and precision were assessed by analyzing five replicates of the QC samples at each level in all the matrices (described in section 2.3). Inter-day accuracy and precision were determined by analyzing five replicates of the described QCs on four successive days. The bias (%) between the mean experimental value and the nominal concentration was calculated to evaluate accuracy. The intra- and inter- day precision were determined by calculating the coefficient of variation (CV (%)), as follows:
Statistical analyses were performed using Microsoft Excel and SPSS version 26 (SPSS, Inc., Chicago IL, USA). Acceptance criteria for accuracy included biases within ±15% of their nominal values, except at the LLOQ (within ±20%), while intra- and inter- day precision results at each QC level in different matrices was required to be ≤15% or ≤ 20% at the LLOQ.
2.4.2. Specificity and selectivity (LLOQ)
Specificity was tested by analyzing water and six different lots of either blank human or mouse plasma from untreated animals to investigate whether endogenous substances in the respective matrices interfere with either the analytes or their internal standards. Selectivity was demonstrated by comparing chromatograms obtained from matrices including mouse and human plasma with corresponding water spiked with GCDCA-S and CDCA-24G at the LLOQ.
2.4.3. Matrix effects and extraction recovery
Matrix effect caused by ionization competition occurring between analytes of interest and the presence of matrix components in biological samples was evaluated at LQC and HQC by comparing the peak responses of GCDCA-S and CDCA-24G in mobile phase solution and corresponding matrices for QCs, including water, pooled human plasma, or pooled mouse plasma (described in section 2.3). The extraction recoveries of GCDCA-S and CDCA-24G were evaluated by comparing the mean peak response of LQC and HQC samples in either pooled human or mouse matrices at corresponding concentration levels to the respective mean peak response of un-extracted (spiked blank plasma extract) QC samples in either pooled human or mouse matrices at corresponding concentrations. Recovery was assessed by calculating the percent coefficient of variation (CV (%)), which was required to be ≤15%.
2.4.4. Carryover
Carryover was evaluated by assessing concentrations of the analytes in a zero-calibration standard or LLOQ sample, which was injected immediately after an upper limited of quantification (ULOQ) standard, and six replicates for each above-described assessment were performed. Negligible carryover was defined as the scenario where analyte concentrations in all zero calibration standards were below the limit of quantification (BLQ) and the percent deviation from the LLOQ in at least 4 out of 6 samples was within 20% of nominal values.
2.4.5. Dilution integrity
A dilution test was performed to evaluate either the pooled mouse or human plasma with GCDCA-S and CDCA-24G, which were 10-fold concentrated compared to respective HQCs, followed by a 1:10 (v/v) dilution in the respective dissolving matrices. Accuracy and precision for the diluted samples were determined, with acceptance criteria set at an average percent bias of ±15.0% of the nominal concentration and a CV (%) of ≤15.0%.
2.4.6. Stability
The bench-top and long-term stabilities of the stock and working solutions of GCDCA-S, CDCA-24G and their respective internal standards were investigated at either room temperature for 6 hours and at −20°C for 30 days, respectively. The stability of GCDCA-S and CDCA-24G at LQC and HQC levels in correspondent matrices were investigated under various conditions including bench-top stability, autosampler stability, re-injection stability, and freeze-thaw stability. The bench-top stability was evaluated by analyzing plasma samples at LQC and HQC levels in triplicate wen stored at room temperature for 6 hours. Re-injection stability was evaluated by re-analyzing the processed QC samples stored at 4°C after 24 hours. For freeze-thaw stability, QC samples were subjected to three freeze-thaw cycles from −80°C to ambient temperature.
2.5. Specimens
2.5.1. Clinical samples
Samples from patients with solid tumors were collected in accordance with the principles of the Declaration of Helsinki, and the study protocol was approved by Institutional Review Board at the National Cancer Institute (Bethesda, MD, USA). All patients provided written informed consent for their blood samples to be used for research purposes. Details of the study and trial participants, including inclusion and exclusion criteria, have been reported previously [18]. Prior to therapy, 7 mL samples of venous blood were collected in a sodium heparin tube, centrifuged at 1,200 × g for 10 min at 4°C within 1 hour of collection, and the plasma supernatants were collected and stored at −80°C until analysis.
2.5.2. Mouse plasma samples
Adult male and female wild-type mice on various genetic backgrounds, including FVB, were purchased from Taconic Biosciences (Rensselaer, NY, USA). Mice were maintained under pathogen-free conditions in the Ohio State University Laboratory Animal Resources, and all in vivo experiments were approved by University Animal Care and Use Committee, under an approved protocol (2015A00000101-R2). All animals were housed in a temperature-controlled environment with a 12-hour light cycle, given a standard chow diet and water ad libitum, excluding a 3-hour fast before inhibitor administration. Baseline whole blood samples of about 30 μL were collected from a submandibular vein using a sterile 5-mm Goldenrod animal lancet in heparinized capillary tubes. Whole blood samples were centrifuged at 8,000 g for 5 min. The plasma supernatant was then collected, immediately placed on dry ice, and stored at −80 °C until analysis.
2.5.3. In vivo pharmacokinetic study
Pharmacokinetic studies were performed following an established protocol [19]. For in vivo studies, rifampin was prepared for intravenous administration by dissolving the powder in DMSO (10%), then adding sterile PBS (90%), stepwise to create a 4 mg/mL solution. Micafungin was prepared by dissolving the powder in sterile PBS to create a 20 mg/mL solution. Serial whole blood samples were collected from adult FVB mice (weight, 20–30 g; age, 8–12 weeks) before administration (pre-) and 0.25, 0.5, 1, 2, and 4 h or 0.08, 0.75, 2, and 4 h after the administration of the OATP1B inhibitors rifampin or micafungin. Blood was collected from the submandibular vein for the initial three time-points, from the retro-orbital sinus vein for the subsequent two time-points, and by cardiac puncture at the terminal time-point. Blood samples were centrifuged at 8,000 g for 5 min, and the plasma supernatants collected, immediately placed on dry ice, and stored at −80°C until analysis.
Non-compartmental analysis using Phoenix WinNonLin version 8.0 (Certara, Princeton, NJ, USA) was used to determine changes in the concentration-time profile of the bile acids. Peak plasma concentration (Cmax) was determined by visual inspection of the data from the log concentration-time curves. The linear trapezoidal rule was used to obtain the area under the plasma concentration-time curve (AUC). Student t-tests were used to compare the observed parameters of mice receiving OATP1B inhibitors versus untreated mice sampled at the corresponding time points on the same day.
2.6. Sample preparation
A single-stage protein precipitation method was used to extract GCDCA-S and CDCA-24G from either human or mouse plasma. Frozen plasma samples were thawed at room temperature, and 10 μL volumes of the thawed plasma were transferred to a 0.5 mL tube. Then, 5 μL of IS methanolic working solution (1 μg/mL) and 85 μL methanol were successively added. After vortex-mixing for 30 s, samples were centrifuged at 15,000 g for 9.5 min at 4°C. From the resulting solution, 60 μL were transferred to a 96-well non-coated plastic microplate (Thermo Scientific) and 5 μL of the sample from the plate were injected into the column.
3. Results and discussion
3.1. Chromatographic and mass spectrometric conditions
The MS settings for GCDCA-S and CDCA-24G were obtained after performing optimization steps for each compounds using an ESI source operating in negative ion mode. The following SRM transition were monitored: m/z 528.4→448.3 and 567.4→391.1 for GCDCA-S and CDCA-24G, respectively, while m/z 533.5→453.3 and 572.5→396.1 were monitored for their corresponding deuterium-labelled IS. The chromatographic conditions, including selection of the mobile phase, elution gradient, column type and temperature, and flow rate, were optimized in preliminary studies (not shown) to improve resolution and peak shape symmetry. Under the selected conditions, the retention time averaged 2.06 min for GCDCA-S and its IS and 2.38 min for CDCA-24G and its IS, with a total run time of 4.6 min.
3.2. Method Validation
3.2.1. Linearity, accuracy and precision
Since are endogenous biomarkers that are already present in the biological matrix of interest, water was selected as an artificial surrogate matrix free of endogenous analytes to prepare calibration curves for this study to achieve a desired lower limit of quantification. An overview of approaches used for the quantification of endogenous compounds by LC-MS/MS and validation requirements and compatibility with FDA guidelines to ensure method reliability in quantifying endogenous compounds has been reported elsewhere [20]. In the context of GCDCA-S and CDCA-24G analyses, QCs at different levels in pooled human, mouse plasma, or water were prepared and quantified to demonstrate that calibration curves prepared in water can accurately measure these compounds in plasma and support in vivo studies to explore their utility as biomarkers of OATP1B function in the context of polypharmacy.
Duplicate calibration curves (r2>0.99) generated on four consecutive days (n=8) were found to be linear in the concentration range 0.5–100 ng/mL for CDCA-24G (human and mouse plasma), and 0.5–100 ng/mL (mouse plasma) or 0.5–1000 ng/mL (human plasma) for GCDCA-S. Values for intra- and inter-day precision and accuracy for GCDCA-S and CDCA-24G in human and mouse plasma are shown in Table 2. For GCDCA-S, the overall accuracy was between - 8.15% and 5.96%, and values for inter-day precision were ≤11.6%. The intra-day precision of QC samples at different levels in pooled plasma from male FVB mice, water, and blank K2-EDTA human plasma were always within 9.72%. The overall accuracy for CDCA-24G ranged from −0.1% to 10.9%, with values for inter-day precision of ≤10.4% and intra-day precision values at different concentration levels in different matrices were ≤7.23%. Collectively, these findings indicate that the use of water as a surrogate matrix for preparing calibration curve standards allows a lower limit quantification level of 0.5 ng/mL, which would not be possible if standards were prepared in plasma already containing varying amounts of GCDCA-S and CDCA-24G endogenously. The preparation of LQC samples in water is typically not ideal, but precedent studies have suggested this is a viable option when the authentic matrix is not suitable to achieve a desired degree of sensitivity [21, 22].
Table 2.
Accuracy and precision of GCDCA-S and CDCA-24G in different matrices.
| Drug | Matrix | Level | Nominal Concentratio n (ng/mL) | Inter-Day Precision (CV(%), n=5) | Intra-Day Precision (CV(%), n=20) | Accuracy (Bias(%) , n=20) |
|---|---|---|---|---|---|---|
| GCDCA-S | Mouse Plasma | LLOQb | 0.500 | 11.4 | 9.72 | 0.270 |
| LOQa | 1.50 | 9.91 | 7.96 | −0.730 | ||
| MQCa | 40.0 | 9.23 | 8.84 | 0.0700 | ||
| HQCa | 90.0 | 11.2 | 9.18 | 0.960 | ||
| Diluted-QCa | 900* | 9.80 | 8.13 | 2.62 | ||
| Human Plasma | LLOQb | 0.500 | 9.03 | 5.40 | −2.28 | |
| LOQb | 5.00 | 9.19 | 5.08 | 5.96 | ||
| MQCc | 400 | 11.6 | 6.08 | −6.24 | ||
| HQCc | 900 | 7.23 | 5.84 | −8.15 | ||
| Diluted-QCc | 9000* | 8.03 | 6.01 | −3.35 | ||
| CDCA-24G | Mouse Plasma | LLOQb | 0.500 | 10.3 | 7.23 | 6.60 |
| LOQa | 1.50 | 7.86 | 5.86 | 3.03 | ||
| MQCa | 40.0 | 5.63 | 3.81 | 4.27 | ||
| HQCa | 90.0 | 6.21 | 5.16 | 5.54 | ||
| Diluted-QCa | 900* | 4.52 | 3.40 | 8.31 | ||
| Human Plasma | LLOQb | 0.500 | 8.54 | 5.95 | −0.100 | |
| LOQb | 1.50 | 7.49 | 4.71 | 1.42 | ||
| MQCc | 40.0 | 8.83 | 6.73 | 0.0500 | ||
| HQCc | 90.0 | 10.4 | 7.07 | 10.9 | ||
| Dilution QCc | 900* | 14.7 | 10.0 | 10.1 |
QC samples were prepared using Pooled Male FVB mouse plasma,
QC samples were prepared using water as the matrix,
QC samples were prepared in pooled human K2-EDTA plasma,
QC samples were measured after 10X of dilution using the respective matrix.
3.2.2. Specificity and selectivity (LLOQ)
A common challenge for the development of a quantitative method for the determination of endogenous compounds is the assessment of specificity since, unlike for xenobiotic compounds and drugs, no true blank biological matrix is available. In this study, water was used as the surrogate matrix of choice was present to evaluate the possible interferences in different matrices. As shown in Fig. 1a–b, no significant interfering compounds were present in water, while varying levels of GCDCA-S and CDCA-24G were found depending on the source of the human and mouse plasma samples (Fig. 1c–f). There was also no interfering peak from both mouse and human matrices at the retention times and in the SRM channel of GCDCA-S-d5 and CDCA-24G-d5 (Supplementary Fig. 1). Based on these considerations, the sensitivity for the method was assessed using water samples spiked at concentrations of 0.5 ng/mL, the lowest non-zero concentration in the calibration curve, demonstrating that a sufficient degree of selectivity was achieved when the LLOQ was prepared in water (Fig 2).
Fig. 1.
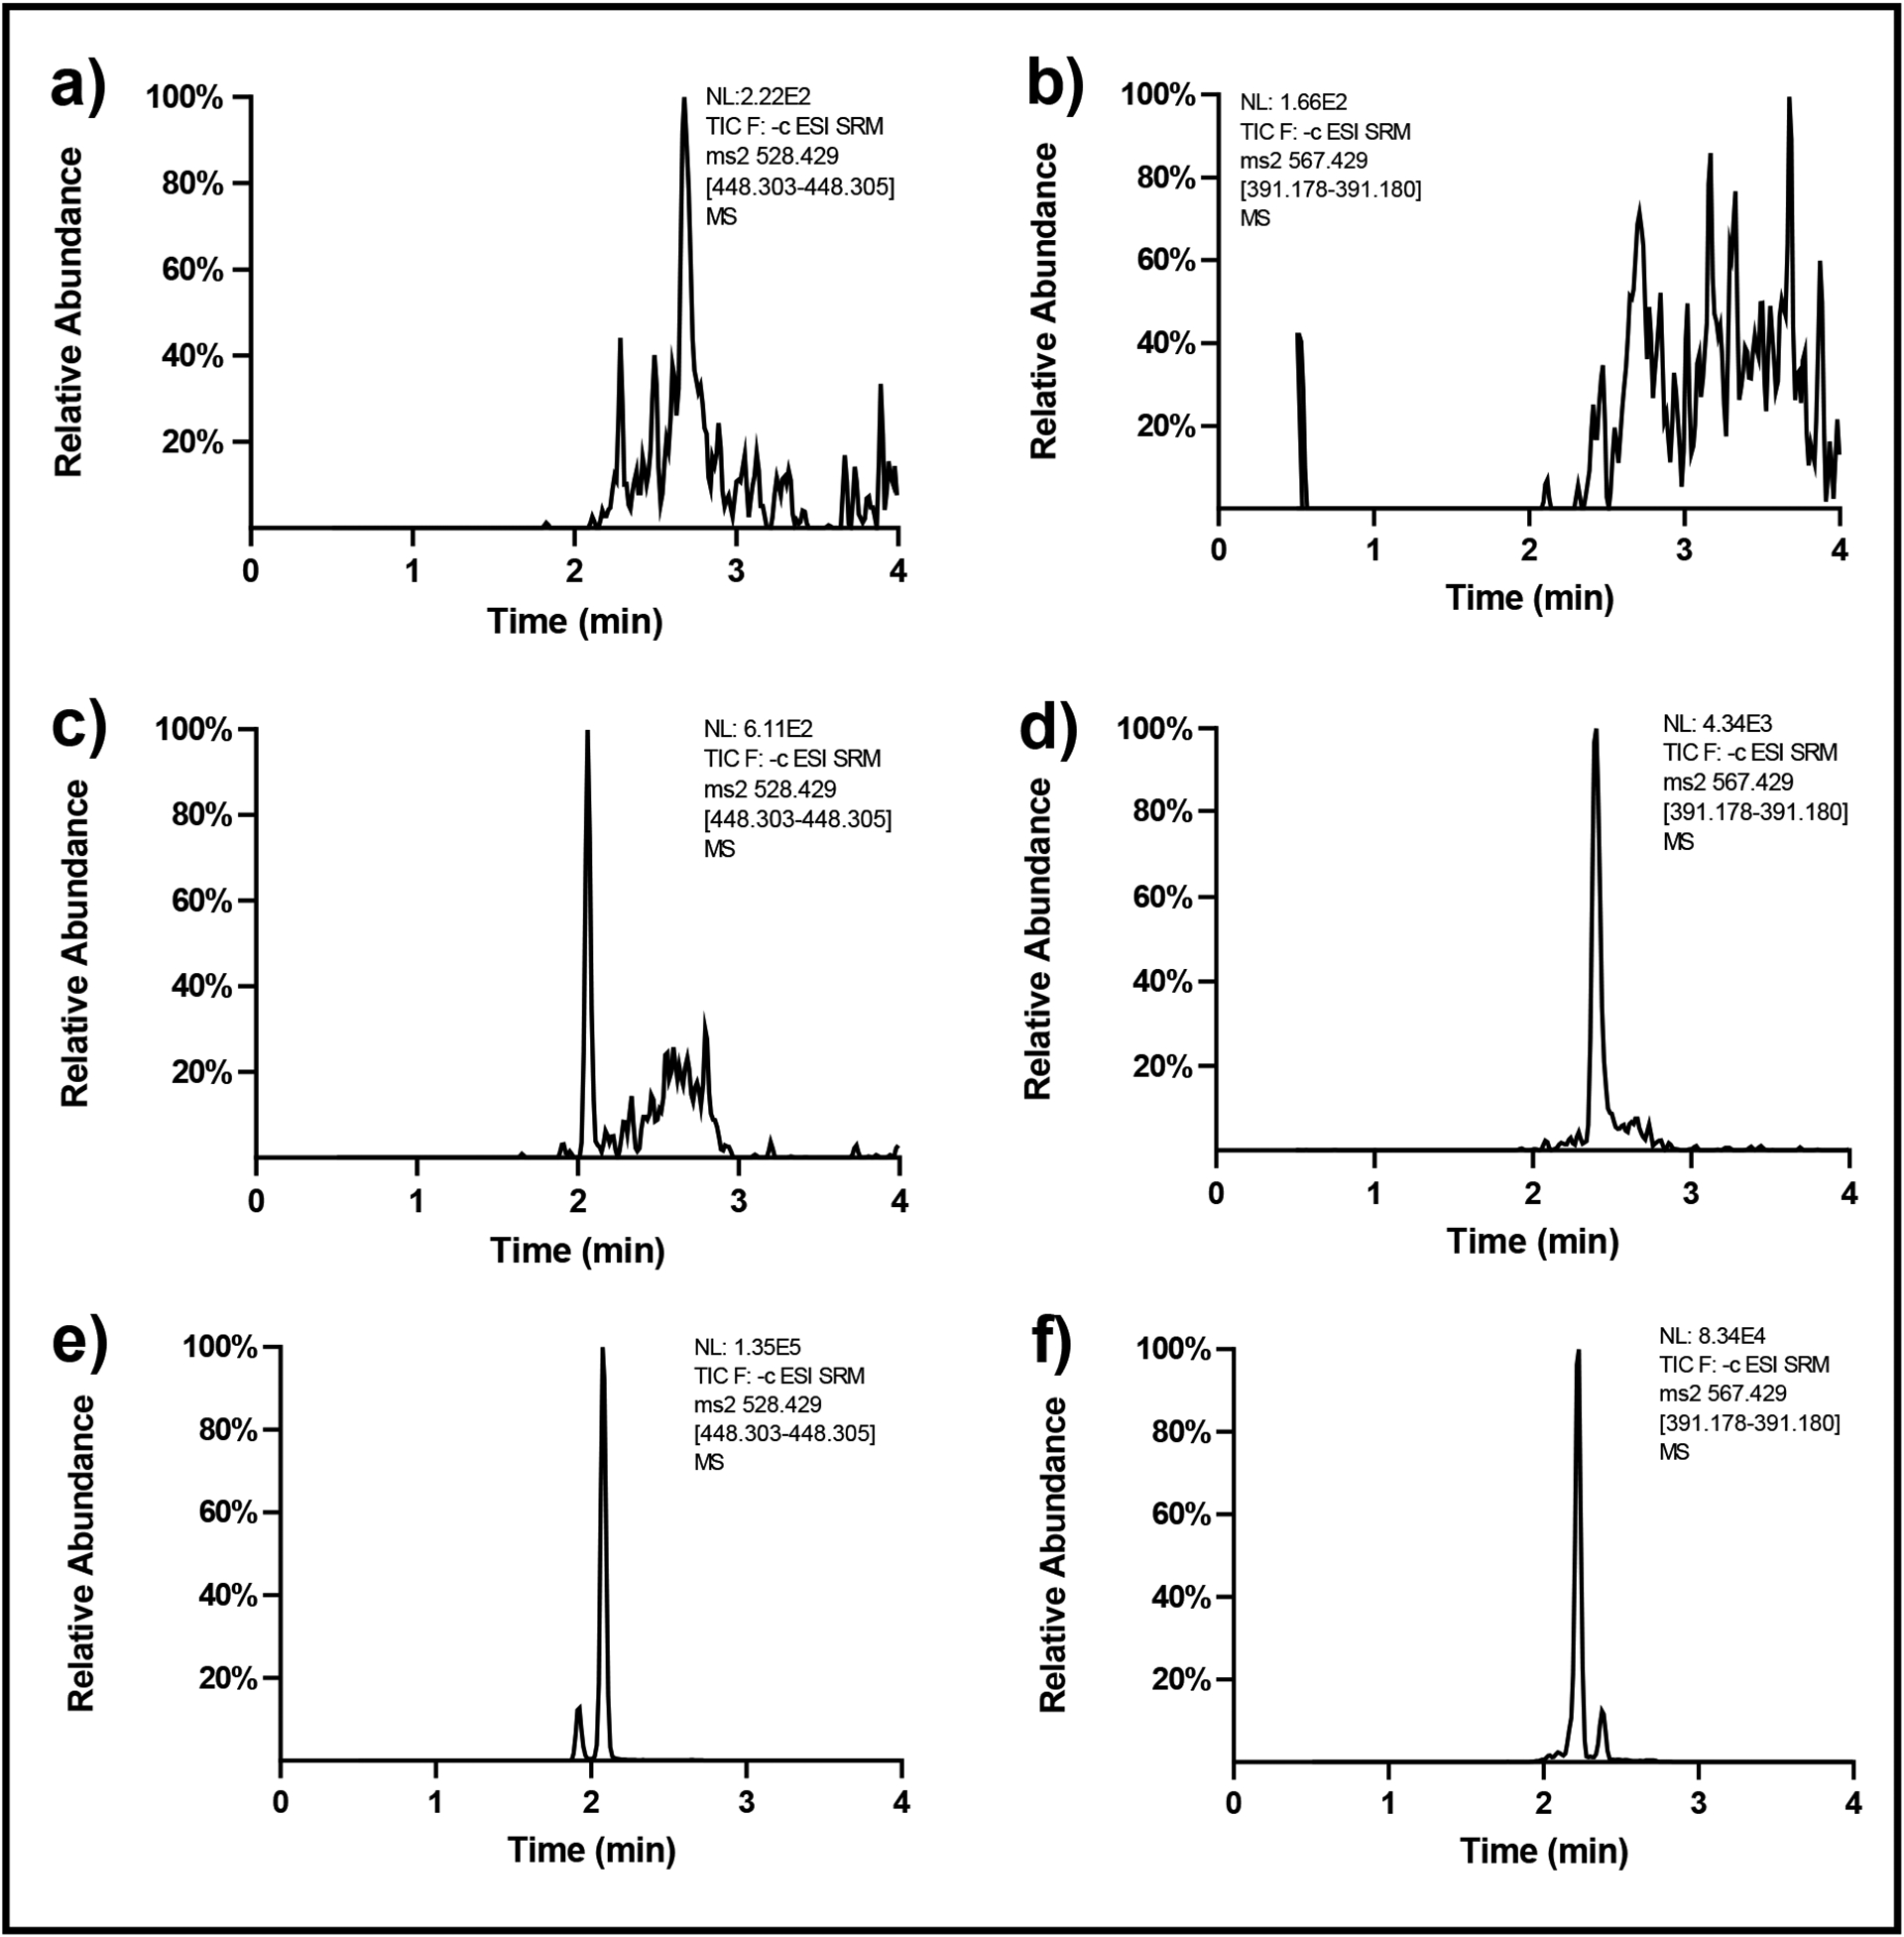
Chromatograms of GCDCA-S and CDCA-24G in different blank matrices: (a) GCDCA-S and (b) CDCA-24G in water, (c) GCDCA-S and (d) CDCA-24G in the non-treated mouse plasma, (e) GCDCA-S and (f) CDCA-24G in human plasma before treating paclitaxel.
Fig. 2.

Chromatograms of (a) GCDCA-S and (b) CDCA-24G at LLOQ level (i.e., 0.5 ng/mL) in water, 20 ng/mL of (c) GCDCA-S-d5 and (d) CDCA-24G in water when the analytes of interest at LLOQ level.
3.2.3. Matrix effect and extraction recovery
The results from evaluating potential matrix effects are presented in Table 3. No significant matrix effects were observed in pooled mouse plasma. Although a direct analysis for LQC samples of GCDCA-S and CDCA-24G in pooled human plasma could not be accomplished, results with GCDCA-S and CDCA-24G in mouse plasma at a concentration of 1.5 ng/mL demonstrated negligible matrix effects. This supports the thesis that a similar lack of matrix effects is expected in human plasma at LQC level.
Table 3.
Matrix effect and extraction recovery of GCDCA-S and CDCA in different matrices.
| Conc. (ng/mL) | QC Matrices | Matrix Effect | Recovery | ||
|---|---|---|---|---|---|
| Mean Matrix Effect (%) | CV (%) | Mean Recovery (%) | CV (%) | ||
| GCDCA-S | |||||
| 1.5 | Pooled mouse plasma | 111 | 10.9 | 88.8 | 9.58 |
| 90 | 115a | 11.2 | 120 | 13.6 | |
| 5 | pooled human plasma | NAb | NAb | 80.7 | 1.16 |
| 900 | 111 | 6.70 | 114 | 6.72 | |
| CDCA-24G | |||||
| 1.5 | Pooled mouse plasma | 88.0 | 8.88 | 89.8 | 7.26 |
| 90 | 109 | 8.70 | 104 | 3.78 | |
| 1.5 | pooled human plasma | NAb | NAb | 90.6 | 12.2 |
| 90 | 87.1 | 11.1 | 94.0 | 4.91 | |
The calculated mean matrix effect 114.814 was rounded to 115 as 3 significant figures kept.
The matrix effect result of prepared GCDCA-S and CDCA-24G at 5 ng/mL and 1.5 ng/mL in pooled human plasma was not available.
Neat methanol was used as the organic solvent to examine the extraction recovery of GCDCA-S and CDCA-24G at low and high QC levels in both mouse and human plasma, and the observed results are shown in Table 3. The overall extraction efficiency and the loss of material for both analytes were considered acceptable considering the sample preparation method (i.e., a one-step protein precipitation) and the small volume of each sample (i.e., 10 μL).
3.2.4. Carryover and dilution integrity
Carryover was found to be negligible for either CDCA-24G or GCDCA-S as no peaks were detectable in zero-calibrator samples spiked with IS and the percentage deviation from the nominal concentration was less than 20% in over two-thirds of LLOQ samples. A dilution factor of 10-fold was established for both pooled mouse and human plasma as a diluent in a two-step process. The observed values for accuracy, intra-day precision, and inter-day precision for dilution integrity of diluted-QCs were found to be within the acceptance limits at an overall accuracy of ±15.0% and precision ≤15.0% (Table 2).
3.2.5. Stability
The stability experiments in this project were conducted to simulate a worst-case scenario of both sample and compound storage and transfer or handling that would occur during typical research operations. The GCDCA-S and CDCA-24G stock solutions demonstrated a storage stability of at least 60 days at −20°C (recovery, within 90–110% compared to fresh stock). Analysis of the IS stock solutions indicated that GCDCA-S should be prepared fresh within at least 30 days, while the IS stock solution of CDCA-24G was found to be stable for at least 60 days. The stock solutions and diluted working solutions of all analytes were found to be stable for at least 6 h at room temperature, which bench-top stability is sufficiently long enough for daily handling and preparation of calibrators, QCs, and samples. The stability results of GCDCA-S and CDCA-24G in pooled mouse plasma and human plasma as well as in water are shown in Table 4. These results indicate that the deviations from fresh preparation were always less than ±8.00% for all matrices, indicating that the analytes are stable for at least 6 hour at room temperature and for at least 28 days at −80°C. The re-injection stability studies of the analytes indicated that no substantial degradation occurred within at least 21 h with samples kept at 4°C in a temperature-controlled autosampler. Furthermore, freeze-thaw stability results suggested that 3 consecutive freeze-thaw cycles did not affect the integrity of GCDCA-S and CDCA-24G irrespective of the matrix. These findings indicate that the selected storage, transfer, and handling conditions of biological samples does not negatively influence the assay performance and the ability to generate useful in vivo results.
Table 4.
Stability of GCDCA-S and CDCA-24G in different matrices under various conditions.
| Conc. (ng/mL) | QC Matrices | Sample Conditions | |||||||
|---|---|---|---|---|---|---|---|---|---|
| Bench-Top Stabilitya | Long-Term Stabilityb | Re-injection Stabilityc | Freeze-Thaw Stabilityd | ||||||
| Mean Deviation (%) of t = 0 | CV (%) | Mean Deviation (%) of t = 0 | CV (%) | Mean Deviation (%) | CV (%) | Mean Deviation (%) of nominal Conc. | CV (%) | ||
| GCDCA-S | |||||||||
| 1.5 | Pooled mouse plasma | 5.25 | 4.75 | 1.94 | 3.45 | −6.79 | 4.53 | 7.47 | 5.26 |
| 90 | −7.22 | 5.55 | 7.48 | 4.00 | 6.00 | 5.38 | −1.51 | 4.50 | |
| 5 | water | −5.61 | 8.06 | 2.45 | 7.14 | −8.33 | 6.70 | 2.93 | 3.08 |
| 900 | pooled human plasma | −1.54 | 3.68 | 7.75 | 7.23 | 2.16 | 4.59 | −7.09 | 4.66 |
| CDCA-24G | |||||||||
| 1.5 | Pooled mouse plasma | −7.20 | 5.82 | −8.00 | 5.95 | 1.69 | 3.35 | −5.53 | 4.77 |
| 90 | −7.57 | 8.37 | −5.14 | 6.40 | −0.0600 | 7.20 | −14.3 | 9.14 | |
| 1.5 | water | −2.05 | 4.17 | −3.12 | 4.94 | −4.34 | 4.06 | −5.78 | 5.26 |
| 90 | pooled human plasma | −4.68 | 4.00 | 1.94 | 2.63 | −6.50 | 5.85 | −4.45 | 3.96 |
Stored at ambient temperature (25 °C) for 6 hours,
Stored for 28 days at −80°C,
Stored the analyzed samples at auto-sampler (4°C) and reanalyzed samples after 24 hours,
After three freeze-thaw cycles.
3.3. Quantification of GCDCA-S and CDCA-24G in biological samples
3.3.1. Clinical samples
The developed method for quantification of GCDCA-S and CDCA-24G in human plasma ranged from 0.5–1000 ng/mL for GCDCA-S and from 0.5–100 ng/mL for CDCA-24G. The mean concentrations of GCDCA-S and CDCA-24G at baseline, prior to initiation of chemotherapy, in plasma of cancer patients were 251 and 20.6 ng/mL, respectively, and substantial inter-individual variation was observed (Fig. 3a). Of the 42 patients evaluated, samples from four patients contained concentrations of CDCA-24G that were below the LLOQ, while GCDCA-S could be quantified in all samples. These findings are consistent with a previous report in which baseline concentrations of CDCA-24G in human plasma samples could not be adequately quantified due to sensitivity constraints of the assay [13] that were at least partially resolved with our current method that displayed improved sensitivity and more suitable for implementation in studies aimed at understanding the contribution of OATP1B inhibition to the prediction of DDIs.
Fig. 3.
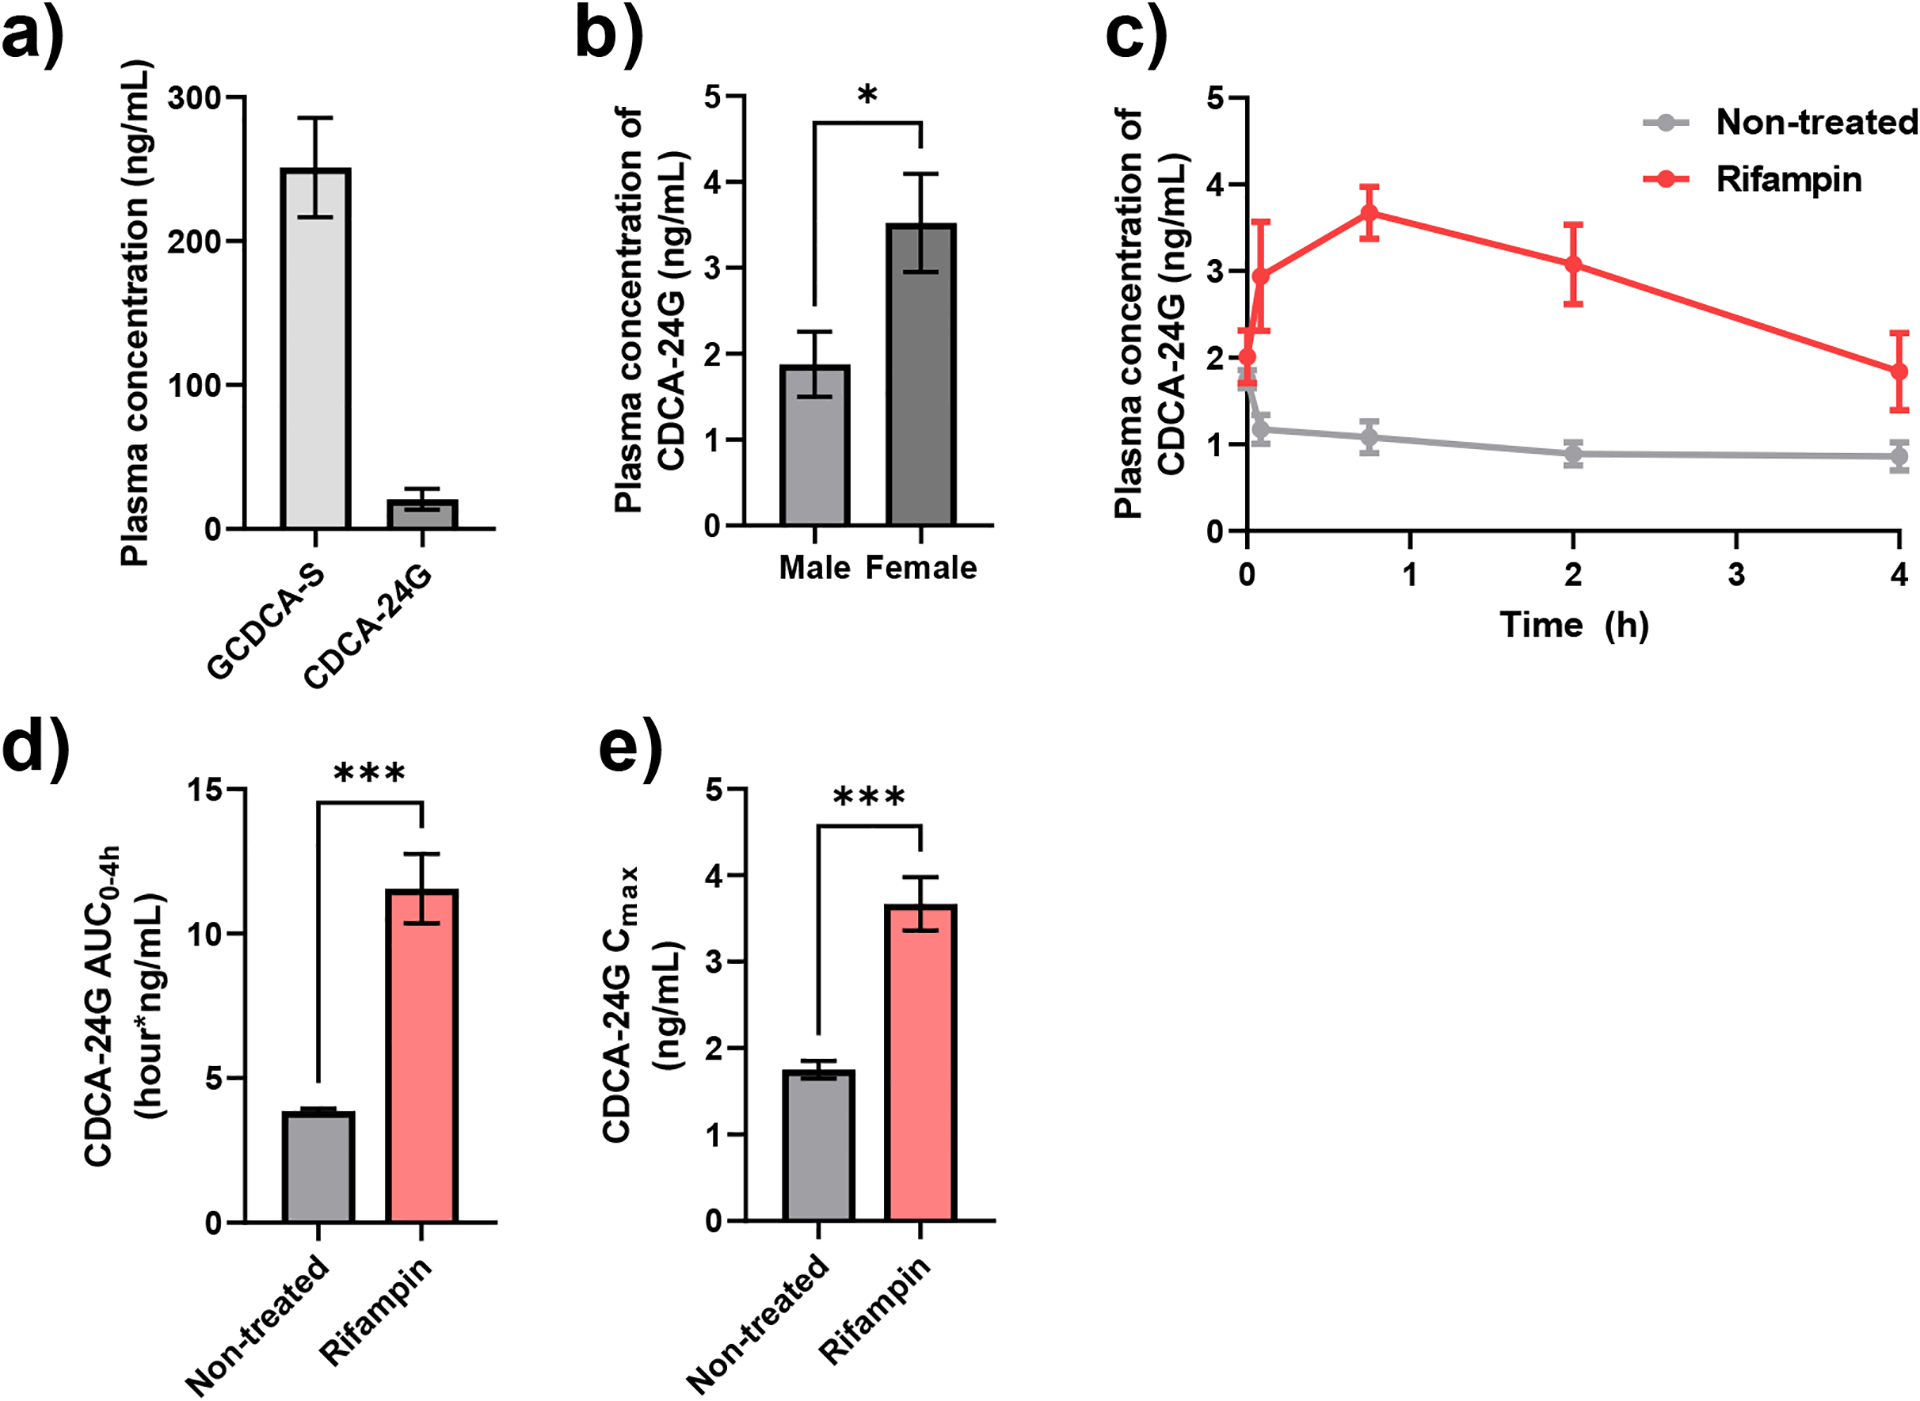
Quantification of GCDCA-S and CDCA-24G levels in human and mice. (a) Plasma concentrations of GCDCA-S and CDCA-24G in cancer patients (n = 42). (b) Plasma levels of CDCA-24G in FVB mice (n = 4–6 per group) *P < 0.05, (c) Plasma concentration-time curves profile of CDCA-24G in wild-type mice not treated (n=5) or administered rifampin (n=4; 20 mg/kg, I.V.), (d) Plasma AUC and (e) Cmax calculated from plasma concentration-time curve. ***P < 0.001 All data presented represent the mean ± SEM.
3.3.2. Mouse samples
Baseline concentrations of GCDCA-S and CDCA-24G in plasma obtained from untreated mice of the FVB strain were below the LLOQ (i.e. <0.5 ng/mL). Additionally, the plasma concentrations of GCDCA-S in the samples taken from mice after the administration of the OATP1B inhibitor rifampin were also below the LLOQ. These observations suggest a species difference in the contribution of OATP1B-mediated transport of these bile acids between humans and mice and indicate that GCDCA-S is not a useful endogenous biomarker for studying potential OATP1B-mediated DDIs in mice [17]. Nonetheless, we found that CDCA-24G was quantifiable at baseline and the observed mean plasma concentration of CDCA-24G was sexually dimorphic with about 2-fold higher levels in female mice than in male mice (Fig. 3b). We next found that a single intravenous dose of rifampin (20 mg/kg) was associated with a transient, statistically significant increase in the plasma levels of CDCA-24G in wild-type mice (Table 5; Fig. 3c–e). Compared to mice that were not administered rifampin, mice that were received rifampin had a 3-fold higher total increase in systemic exposure to CDCA-24G (Fig. 3e). These data indicate that CDCA-24G is a suitable endogenous biomarker to evaluate inhibition of OATP1B function by xenobiotics and drugs in mice. This conclusion is further supported by the notion that intravenous administration of micafungin (100 mg/kg), an antifungal recently identified as an OATP1B inhibitor [23], also affected CDCA-24G levels to a statistically significant degree (Supplementary Table 1; Supplementary Fig. 2).
Table 5.
Effect of rifampin on plasma Cmax and AUC0–4h of CDGA-24G in mice.
| Treatment group | N | Cmax (ng/mL)a | AUC0–4h (ng × h/mL)a |
|---|---|---|---|
| No Treatment | 5 | 1.75 (± 0.104) | 3.86 (± 0.0900) |
| Rifampin | 4 | 3.67 (± 0.308) *** | 11.6 (± 1.20) *** |
Data represent mean and SEM in parenthesis.
P < 0.001
4. Conclusion
A simple, rapid, sensitive, and specific LC-MS/MS method was developed for the simultaneous determination of GCDCA-S and CDCA-24G levels in plasma of cancer patients and mice. The selection of a simple, one-step protein precipitation for sample preparation and a relatively short overall run time supports the implementation of this assay in large-scale studies in a cost-effective and time-efficient manner. Compared to previously reported methods, our newly developed assay offers an increase in sensitivity that allows quantification of GCDCA-S and CDCA-24G in microvolumes of human or mouse plasma. Furthermore, our murine studies have revealed a species-dependence in the utility of GCDCA-S as a biomarker of OATP1B function that should be taken into consideration when selection suitable model organisms for predicting biomarker-driven DDI liabilities. We are currently implementing the developed assay to evaluate the association of OATP1B-deficiency in mice with or without transgenic overexpression of human OATP1B transporters with treatment-related changes in the plasma levels of GCDCA-S and CDCA-24G.
Supplementary Material
Highlights.
A simple UHPLC-MS/MS method for mouse and human plasma was developed for OATP1Bs biomarkers GCDCA-S and CDCA-24G.
Our method is suitable for DDI studies with only micro-volume plasma samples and short sample run time.
Distinct species and sex differences were observed for GCDCA-S and CDCA-24G.
CDCA-24G was confirmed to be a sensitive probe for DDI studies involved with OATP1Bs transporters.
Acknowledgements
This work was supported in part by funds from The Ohio State University Comprehensive Cancer Center Pelotonia foundation (to SDB and SH) and from the National Institutes of Health Grant R01CA238946 (to SH), U24CA247648 (to SDB). The content is solely the responsibility of the authors and does not necessarily represent the official views of the funding agencies.
Footnotes
Publisher's Disclaimer: This is a PDF file of an unedited manuscript that has been accepted for publication. As a service to our customers we are providing this early version of the manuscript. The manuscript will undergo copyediting, typesetting, and review of the resulting proof before it is published in its final form. Please note that during the production process errors may be discovered which could affect the content, and all legal disclaimers that apply to the journal pertain.
Declaration of Competing Interest
The authors declare that they have no known competing financial interests or personal relationships that could have appeared to influence the work reported in this paper.
References
- [1].Magro L, Moretti U, Leone R, Epidemiology and characteristics of adverse drug reactions caused by drug–drug interactions, Expert Opin. Drug Saf, 11 (2012) 83–94. [DOI] [PubMed] [Google Scholar]
- [2].Subramanian A, Adhimoolam M, Kannan S, Study of drug–drug interactions among the hypertensive patients in a tertiary care teaching hospital, Perspect. Clin. Res, 9 (2018) 9. [DOI] [PMC free article] [PubMed] [Google Scholar]
- [3].Fuhr U, Hsin C.-h., Li X, Jabrane W, Sörgel F, Assessment of pharmacokinetic drug–drug interactions in humans: In vivo probe substrates for drug metabolism and drug transport revisited, Annu. Rev. Pharmacol. Toxicol , 59 (2019) 507–536. [DOI] [PubMed] [Google Scholar]
- [4].Di L, The role of drug metabolizing enzymes in clearance, Expert Opin. Drug Metab. Toxicol, 10 (2014) 379–393. [DOI] [PubMed] [Google Scholar]
- [5].Srinivas NR, Pharmacokinetic interaction of rifampicin with oral versus intravenous anticancer drugs: challenges, dilemmas and paradoxical effects due to multiple mechanisms, Drugs in R&D, 16 (2016) 141–148. [DOI] [PMC free article] [PubMed] [Google Scholar]
- [6].Yoshida K, Maeda K, Sugiyama Y, Transporter-mediated drug–drug interactions involving OATP substrates: predictions based on in vitro inhibition studies, Clin. Pharmacol. Ther, 91 (2012) 1053–1064. [DOI] [PubMed] [Google Scholar]
- [7].Alam K, Crowe A, Wang X, Zhang P, Ding K, Li L, Yue W, Regulation of organic anion transporting polypeptides (OATP) 1B1- and OATP1B3-mediated transport: an updated review in the context of OATP-mediated drug-drug interactions, Int. J. Mol. Sci, 19 (2018) 855. [DOI] [PMC free article] [PubMed] [Google Scholar]
- [8].Yu J, Zhou Z, Tay-Sontheimer J, Levy RH, Ragueneau-Majlessi I, Intestinal drug interactions mediated by OATPs: a systematic review of preclinical and clinical findings, J. Pharm. Sci, 106 (2017) 2312–2325. [DOI] [PubMed] [Google Scholar]
- [9].Patel M, Taskar KS, Zamek-Gliszczynski MJ, Importance of hepatic transporters in clinical disposition of drugs and their metabolites, J. Clin. Pharmacol, 56 Suppl 7 (2016) S23–39. [DOI] [PubMed] [Google Scholar]
- [10].Kalliokoski A, Niemi M, Impact of OATP transporters on pharmacokinetics, Br. J. Pharmacol, 158 (2009) 693–705. [DOI] [PMC free article] [PubMed] [Google Scholar]
- [11].Mori D, Kimoto E, Rago B, Kondo Y, King-Ahmad A, Ramanathan R, Wood LS, Johnson JG, Le VH, Vourvahis M, Dose‐dependent inhibition of OATP1B by rifampicin in healthy volunteers: comprehensive evaluation of candidate biomarkers and OATP1B probe drugs, Clin. Pharmacol. Ther, 107 (2020) 1004–1013. [DOI] [PMC free article] [PubMed] [Google Scholar]
- [12].Kalluri HV, Kikuchi R, Coppola S, Schmidt J, Mohamed M-EF, Bow DAJ, Salem AH, Coproporphyrin I can serve as an endogenous biomarker for OATP1B1 inhibition: assessment using a glecaprevir/pibrentasvir clinical study, Clin. Transl. Sci, 14 (2021) 373–381. [DOI] [PMC free article] [PubMed] [Google Scholar]
- [13].Takehara I, Terashima H, Nakayama T, Yoshikado T, Yoshida M, Furihata K, Watanabe N, Maeda K, Ando O, Sugiyama Y, Kusuhara H, Investigation of glycochenodeoxycholate sulfate and chenodeoxycholate glucuronide as surrogate endogenous probes for drug iteraction sudies of OATP1B1 and OATP1B3 in halthy Japanese vlunteers, Pharm. Res, 34 (2017) 1601–1614. [DOI] [PubMed] [Google Scholar]
- [14].Barnett S, Ogungbenro K, Ménochet K, Shen H, Humphreys WG, Galetin A, Comprehensive evaluation of the utility of 20 endogenous molecules as biomarkers of OATP1B inhibition compared with rosuvastatin and coproporphyrin I, J. Pharmacol. Exp. Ther, 368 (2019) 125–135. [DOI] [PubMed] [Google Scholar]
- [15].Watanabe M, Watanabe T, Yabuki M, Tamai I, Dehydroepiandrosterone sulfate, a useful endogenous probe for evaluation of drug–drug interaction on hepatic organic anion transporting polypeptide (OATP) in cynomolgus monkeys, Drug Metab. Pharmacokinet, 30 (2015) 198–204. [DOI] [PubMed] [Google Scholar]
- [16].Takehara I, Yoshikado T, Ishigame K, Mori D, Furihata K.-i., Watanabe N, Ando O, Maeda K, Sugiyama Y, Kusuhara H, Comparative study of the dose-dependence of OATP1B inhibition by rifampicin using probe drugs and endogenous substrates in healthy volunteers, Pharm. Res, 35 (2018) 138. [DOI] [PubMed] [Google Scholar]
- [17].Ma Y, Xin M, Wen Y, Wang H, Zhang G, Dai J, Wu X-A, The utility of endogenous glycochenodeoxycholate-3-sulfate and 4β-hydroxycholesterol to evaluate the hepatic disposition of atorvastatin in rats, Asian J. Pharm. Sci, 16 (2021) 519–529. [DOI] [PMC free article] [PubMed] [Google Scholar]
- [18].Gardner ER, Dahut WL, Scripture CD, Jones J, Aragon-Ching JB, Desai N, Hawkins MJ, Sparreboom A, Figg WD, Randomized crossover pharmacokinetic study of solvent-based paclitaxel and nab-paclitaxel, Clin. Cancer Res, 14 (2008) 4200–4205. [DOI] [PMC free article] [PubMed] [Google Scholar]
- [19].Leblanc AF, Huang KM, Uddin ME, Anderson JT, Chen M, Hu S, Murine pharmacokinetic studies, Bio-protocol, 8 (2018). [DOI] [PMC free article] [PubMed] [Google Scholar]
- [20].Thakare R, Chhonker YS, Gautam N, Alamoudi JA, Alnouti Y, Quantitative analysis of endogenous compounds, J. Pharm. Biomed. Anal, 128 (2016) 426–437. [DOI] [PubMed] [Google Scholar]
- [21].Saini GS, Wani TA, Gautam A, Varshney B, Ahmed T, Rajan KS, Pillai KK, Paliwal JK, Validation of the LC-MS/MS method for the quantification of mevalonic acid in human plasma and determination of the matrix effect, J. Lipid Res, 47 (2006) 2340–2345. [DOI] [PubMed] [Google Scholar]
- [22].Kim H, Kosinski P, Kung C, Dang L, Chen Y, Yang H, Chen Y-S, Kramer J, Liu G, A fit-for-purpose LC–MS/MS method for the simultaneous quantitation of ATP and 2,3-DPG in human K2EDTA whole blood, J. Chromatogr. B, 1061–1062 (2017) 89–96. [DOI] [PubMed] [Google Scholar]
- [23].Eisenmann ED, Garrison DA, Talebi Z, Jin Y, Silvaroli JA, Kim JG, Sparreboom A, Savona MR, Mims AS, Baker SD, Interaction of antifungal drugs with CYP3A- and OATP1B-mediated venetoclax elimination, Pharmaceutics, 14 (2022). [DOI] [PMC free article] [PubMed] [Google Scholar]
Associated Data
This section collects any data citations, data availability statements, or supplementary materials included in this article.