

SUMMARY
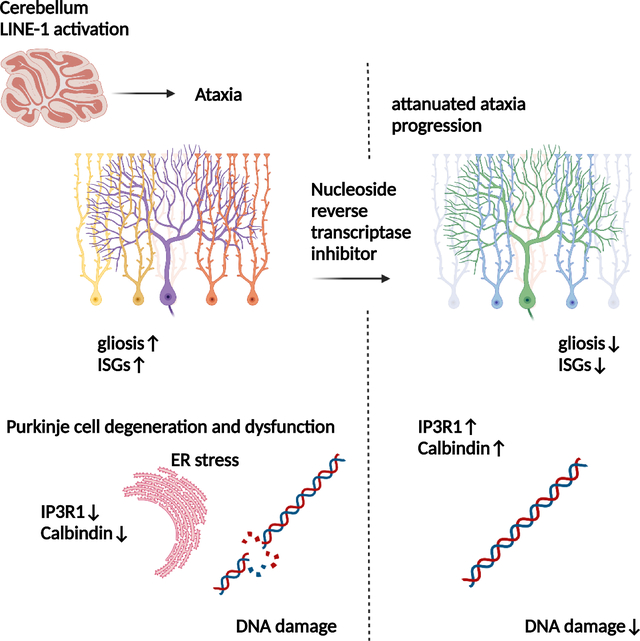
Dysregulation of long interspersed nuclear element 1 (LINE-1, L1), a dominant class of transposable elements in the human genome, has been linked to neurodegenerative diseases, but whether elevated L1 expression is sufficient to cause neurodegeneration has not been directly tested. Here we show that cerebellar expression of L1 is significantly elevated in the ataxia-telangiectasia patients, and strongly anticorrelated with the expression of epigenetic silencers. To examine the role of L1 in the disease etiology, we developed an approach for direct targeting of L1 promoter for overexpression in mice. We demonstrated that L1 activation in the cerebellum led to Purkinje cell dysfunctions and degeneration and was sufficient to cause ataxia. Treatment with a nucleoside reverse transcriptase inhibitor blunted ataxia progression by reducing DNA damage, attenuating gliosis, and reversing deficits of molecular regulators for calcium homeostasis in Purkinje cells. Our study provides the first direct evidence that L1 activation can drive neurodegeneration.
Graphical Abstract
eTORC blurb:
Takahashi et al. found elevated expression of the transposable element LINE-1 in the cerebella of ataxia-telangiectasia patients. A mouse model in which LINE-1 is activated in cerebellar Purkinje neurons showed significant ataxia with neurodegeneration and electrophysical abnormalities. The progression of the ataxia was attenuated with a reverse transcriptase inhibitor treatment.
INTRODUCTION
The long interspersed nuclear element 1 (LINE-1, L1) constitutes 20% of mammalian genomes and is the only actively replicating retroelement in the human genome (Kazazian and Moran, 2017). While L1 is active even in the healthy brain contributing to the neuronal somatic diversification and genomic plasticity (Muotri et al., 2005), mounting evidence shows aberrant L1 activities in neurological and neurodevelopmental disorders suggesting its role in neuroinflammation and neuronal DNA damages (Gorbunova et al., 2021; Jonsson et al., 2020; Muotri et al., 2010; Peze-Heidsieck et al., 2021; Reilly et al., 2013; Saleh et al., 2019).
A recent study of TE expression in developing human brain (Playfoot et al., 2021) demonstrated that cerebellum retains exceptionally high expression of epigenetic silencers of TEs including young L1 such as TRIM28 and DNMT1 (Castro-Diaz et al., 2014; Robbez-Masson et al., 2018) throughout fetal development and after birth, while these silencers are downregulated in all other brain regions after birth. The relevance for this specific brain region to maintain higher expression of these regulators has not been explored. Here we analyzed cerebella of patients with the three most prevalent types of hereditary ataxia. In parallel, we constructed a mouse model with cerebellar L1 overexpression and investigated its phenotype.
RESULTS
Loss of TE silencers and L1 activation in ataxia telangiectasia cerebellum
We examined cerebellar samples from hereditary cerebellar ataxia patients: Ataxia Telangiectasia (AT), Spinocerebellar ataxia type 3 (SCA3), and Friedreich’s ataxia patients, along with control individuals (Table S1). We assessed L1 mRNA expression using primers targeting younger families L1HS/L1PA (De Cecco et al., 2019), and found its upregulation in AT compared to controls, coupled with downregulation of TRIM28 and DNMT1 (Figure 1A). Interferon-stimulated genes (ISGs) were upregulated in AT (Figure 1B), which showed positive correlations with L1 (Figure S1A). Using samples from AT patients and matched controls, we performed RNA-seq. Principal component analysis (PCA) showed clear segregation of two groups (Figure S1B). We found upregulation of ISGs in AT (Figures 1C, S1C). Upregulated genes also included GFAP, indicating astrogliosis (Figure 1C). The most downregulated genes included ITPR1, CALB1, and CALB2 (qPCR validation in Figure S1D), encoding inositol 1,4,5-trisphosphate receptor type 1 (IP3R1), Calbindin, and Calretinin, respectively, all critical regulators of calcium in Purkinje cells (PCs) (Bezprozvanny, 2009; Hisatsune and Mikoshiba, 2017). AT had generally higher expression of L1 across many subfamilies (Figure 1D). We found the significant upregulation in younger L1HS, L1PA/PB families in AT in line with qPCR results, while no differences in ancient families L1MA/ME (Figure S1E). Endogenous retroviruses (ERVs) were also upregulated in AT. However, clustering between AT and controls was more distinct for L1s (Figures 1D, S1F).
Figure 1. Expression of L1 in the cerebellar ataxia patients’ cerebella.
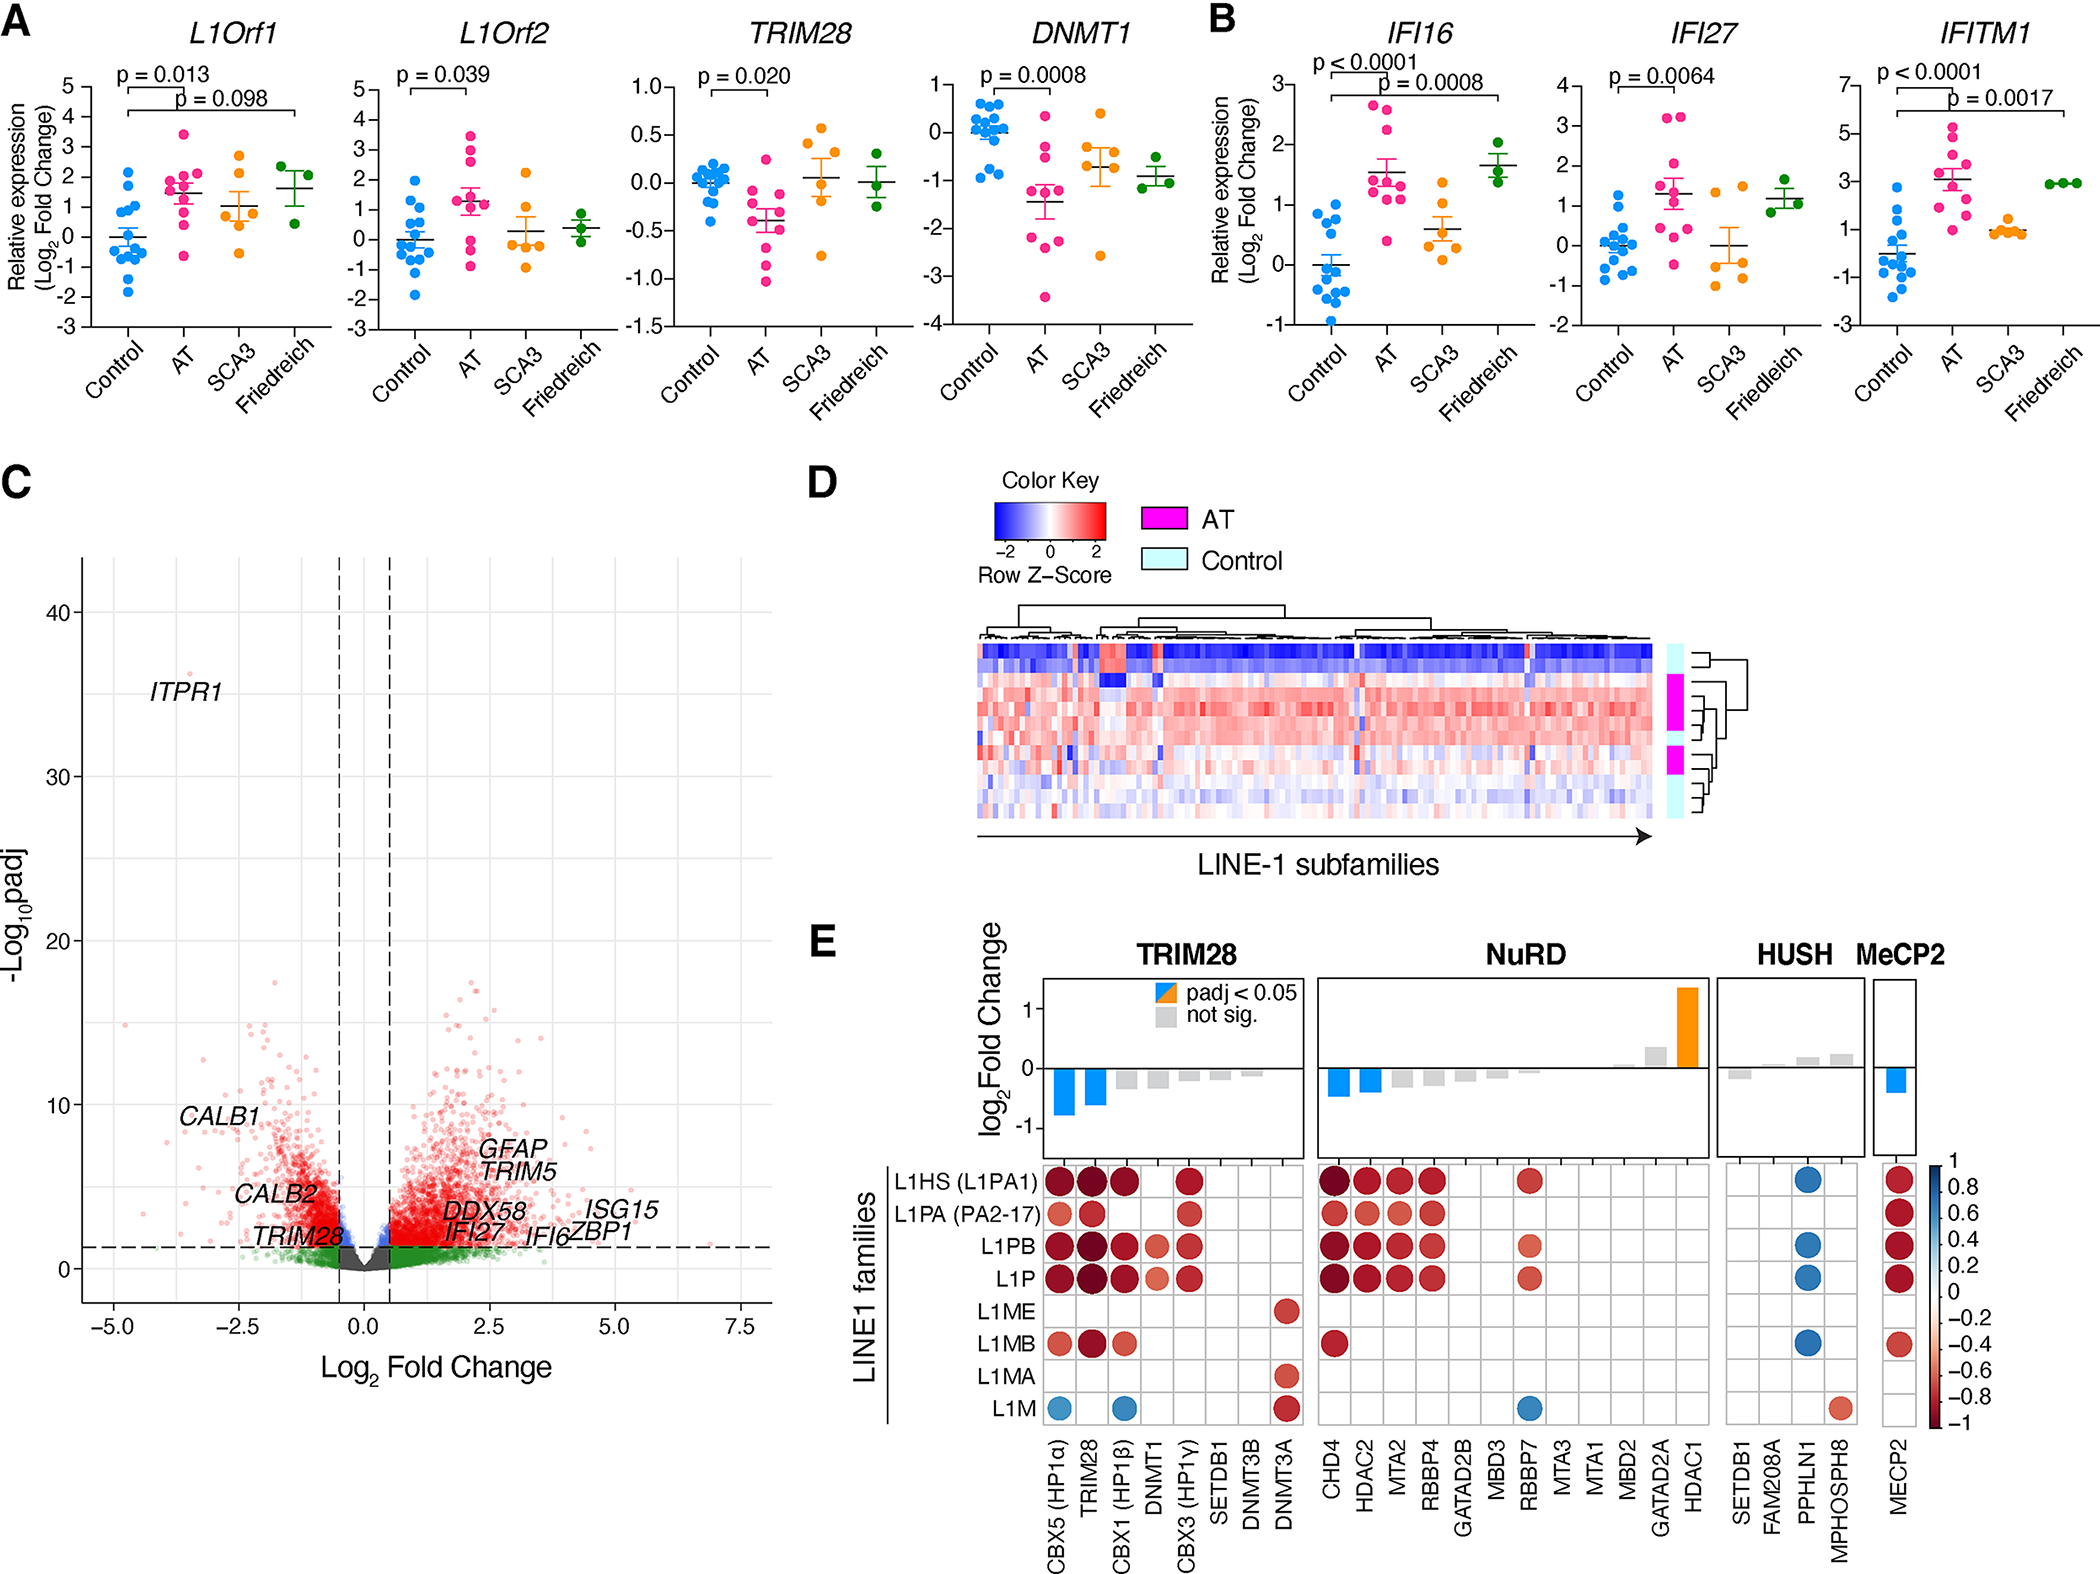
(A) mRNA expressions in the cerebellum. n = 14, 10, 6, and 3 for controls, AT, SCA3, and Friedreich’s ataxia, respectively. Data are mean ± SEM. p-values with One-way ANOVA with Bonferroni’s multiple comparison test. Values are shown as log-2 fold change. (B) Expression of representative ISGs. (C) Volcano plot of DEGs between AT and controls. Adjusted p-values (padj) and log-2 fold change (log2FC) compared to control samples are plotted. (D) Heatmap for L1 subfamilies across samples. Each column represents L1 subfamilies. (E) Correlation heatmap summarizing Pearson correlation coefficients (r) between TE regulators and each L1 family. Representative TE regulators are selected and categorized to TRIM28-, NuRD-, and HUSH-related (Tokuyama et al., 2021). MeCP2, a known L1 regulator in the brain, is additionally included. The upper bar graph represents padj and log2FC of each regulator between AT and controls. Blue: downregulation, Orange: upregulation. Only significant correlations (p < 0.05) are shown as filled circles. Color represents the Pearson coefficient and color scale is presented on the right. See also Figure S1 and Table S1.
In parallel, we noticed an extensive downregulation of TE regulators in AT (Figures 1E, S1G, S1H). Expression of these regulators showed a robust negative correlation with the abundance of younger L1 families such as L1HS, but not with older families (Figure 1E, S1I). Thus, a strong negative correlation was found for TE regulator downregulation and de-repression of young L1s in AT cerebellum.
L1 activation in the cerebellum leads to ataxia
We set out to establish a system in which L1 is directly manipulated in mice. We adopted clustered regularly interspaced short palindromic repeat (CRISPR)-mediated approach. We targeted the Tf family, the youngest mouse L1 family (Sookdeo et al., 2013). The promoter sequence consists of repeats of 212 bp monomer (Naas et al., 1998). We designed 5 sgRNAs targeting this monomer with no overlap. We transduced NIH-3T3 cells with CRISPR-activation (CRISPRa) machinery (Konermann et al., 2015), and transfected Tf-promoter targeting sgRNA- or scrambled (Scr) sgRNA-expression plasmids. While Scr_sgRNA and 4 out of 5 Tf promoter-targeting sgRNAs led to no or weak Orf1p protein expression, we found one sgRNA robustly inducing Orf1p expression (Figure S2A). We selected this sgRNA as our L1 targeting sgRNA (L1_sgRNA).
We examined mRNA expression with qPCR and found a significant upregulation in L1 as well as ISGs in L1_sgRNA-condition (Figure S2B). We performed RNA-seq, and found a significant upregulation of young L1 subfamilies in L1_sgRNA condition, with the most significant increase in Tf_I subfamily belonging to Tf family (Sookdeo et al., 2013) (Figure S2C). Gene ontology analysis of cellular DEGs showed that anti-viral genes were the most differentially expressed (Figure S2D). Further, we identified terms related to ion homeostasis (Figures S2D, S2E), particularly related to calcium homeostasis.
To assess the cis-regulatory effects of CRISPRa using our L1_sgRNA, we investigated associations between the magnitude of gene expression changes and the distance of transcription start sites (TSS) from its closest L1_sgRNA target sites in the genome (Figure S2F), as done in a previous study in which ERVs were targeted with CRISPR (Fuentes et al., 2018). We did not observe a general trend that genes closer to L1_sgRNA target loci were preferentially upregulated (Figure S2F), in which case dots in the center bins show an overall trend for the upward shift from 0. However, at the level of individual dots/genes, we did find some genes significantly upregulated in L1-activated condition, which are located close to the target loci (Figure S2F, Table S2). Thus, our system does not allow us to exclude the involvement of of CRISPRa effects on these off-target genes on the observed phenotypes.
We applied this L1 CRISPRa system to primary cells, and established mouse embryonic fibroblasts (MEFs) stably overexpressing L1 (Figure S2G, S2H). These cells exhibited cytosolic ssDNA accumulation and DNA damages, which were both attenuated by treatment of nucleoside reverse transcriptase inhibitor (NRTI) lamivudine (3TC) (Figures S2I, S2J).
Next, we sought to generate an in vivo model in which L1 is directly activated. We obtained dCas9-SPH mice (hereafter dCas mice) with a transgene encoding dCas9 and CRISPR activator under pCAG promoter followed by Lox-Stop-Lox (LSL) sequence (Zhou et al., 2018) (Figure 2A). We generated two strains of sgRNA Tg mice, Scr_sgRNA mice and L1_sgRNA mice (Figures 2A, S3A). We crossed these mice with dCas mice to generate dCas/L1_sgRNA and dCas/Scr_sgRNA double Tg mice (LINE-1a mice and dCasScr mice, respectively). Our plan was to cross these mice with Cre Tg mice. However, we noticed a robust ataxia in LINE-1a mice (Figure 2B). In fact, dCas mice revealed basal expression of dCas9 without Cre in the cerebellum (Figures S3B, S3C). Studies have documented leakiness of LSL cassette (Cheung et al., 2008; Sohal et al., 2009). PCR of genomic DNA did not show evidence for recombination of LSL (Figure S3D). Thus, expression of dCas9 in dCas cerebellum may be due to read-through transcription beyond LSL. Staining of dCas mouse cerebella revealed expression of dCas9 in PCs, with a modest expression also in astrocytes (Figure S3E). Although the reason for this read-through is unknown, these findings indicated that dCas strain stably expresses dCas9 principally in PCs.
Figure 2. L1 CRISPRa in the cerebellum drives ataxia.
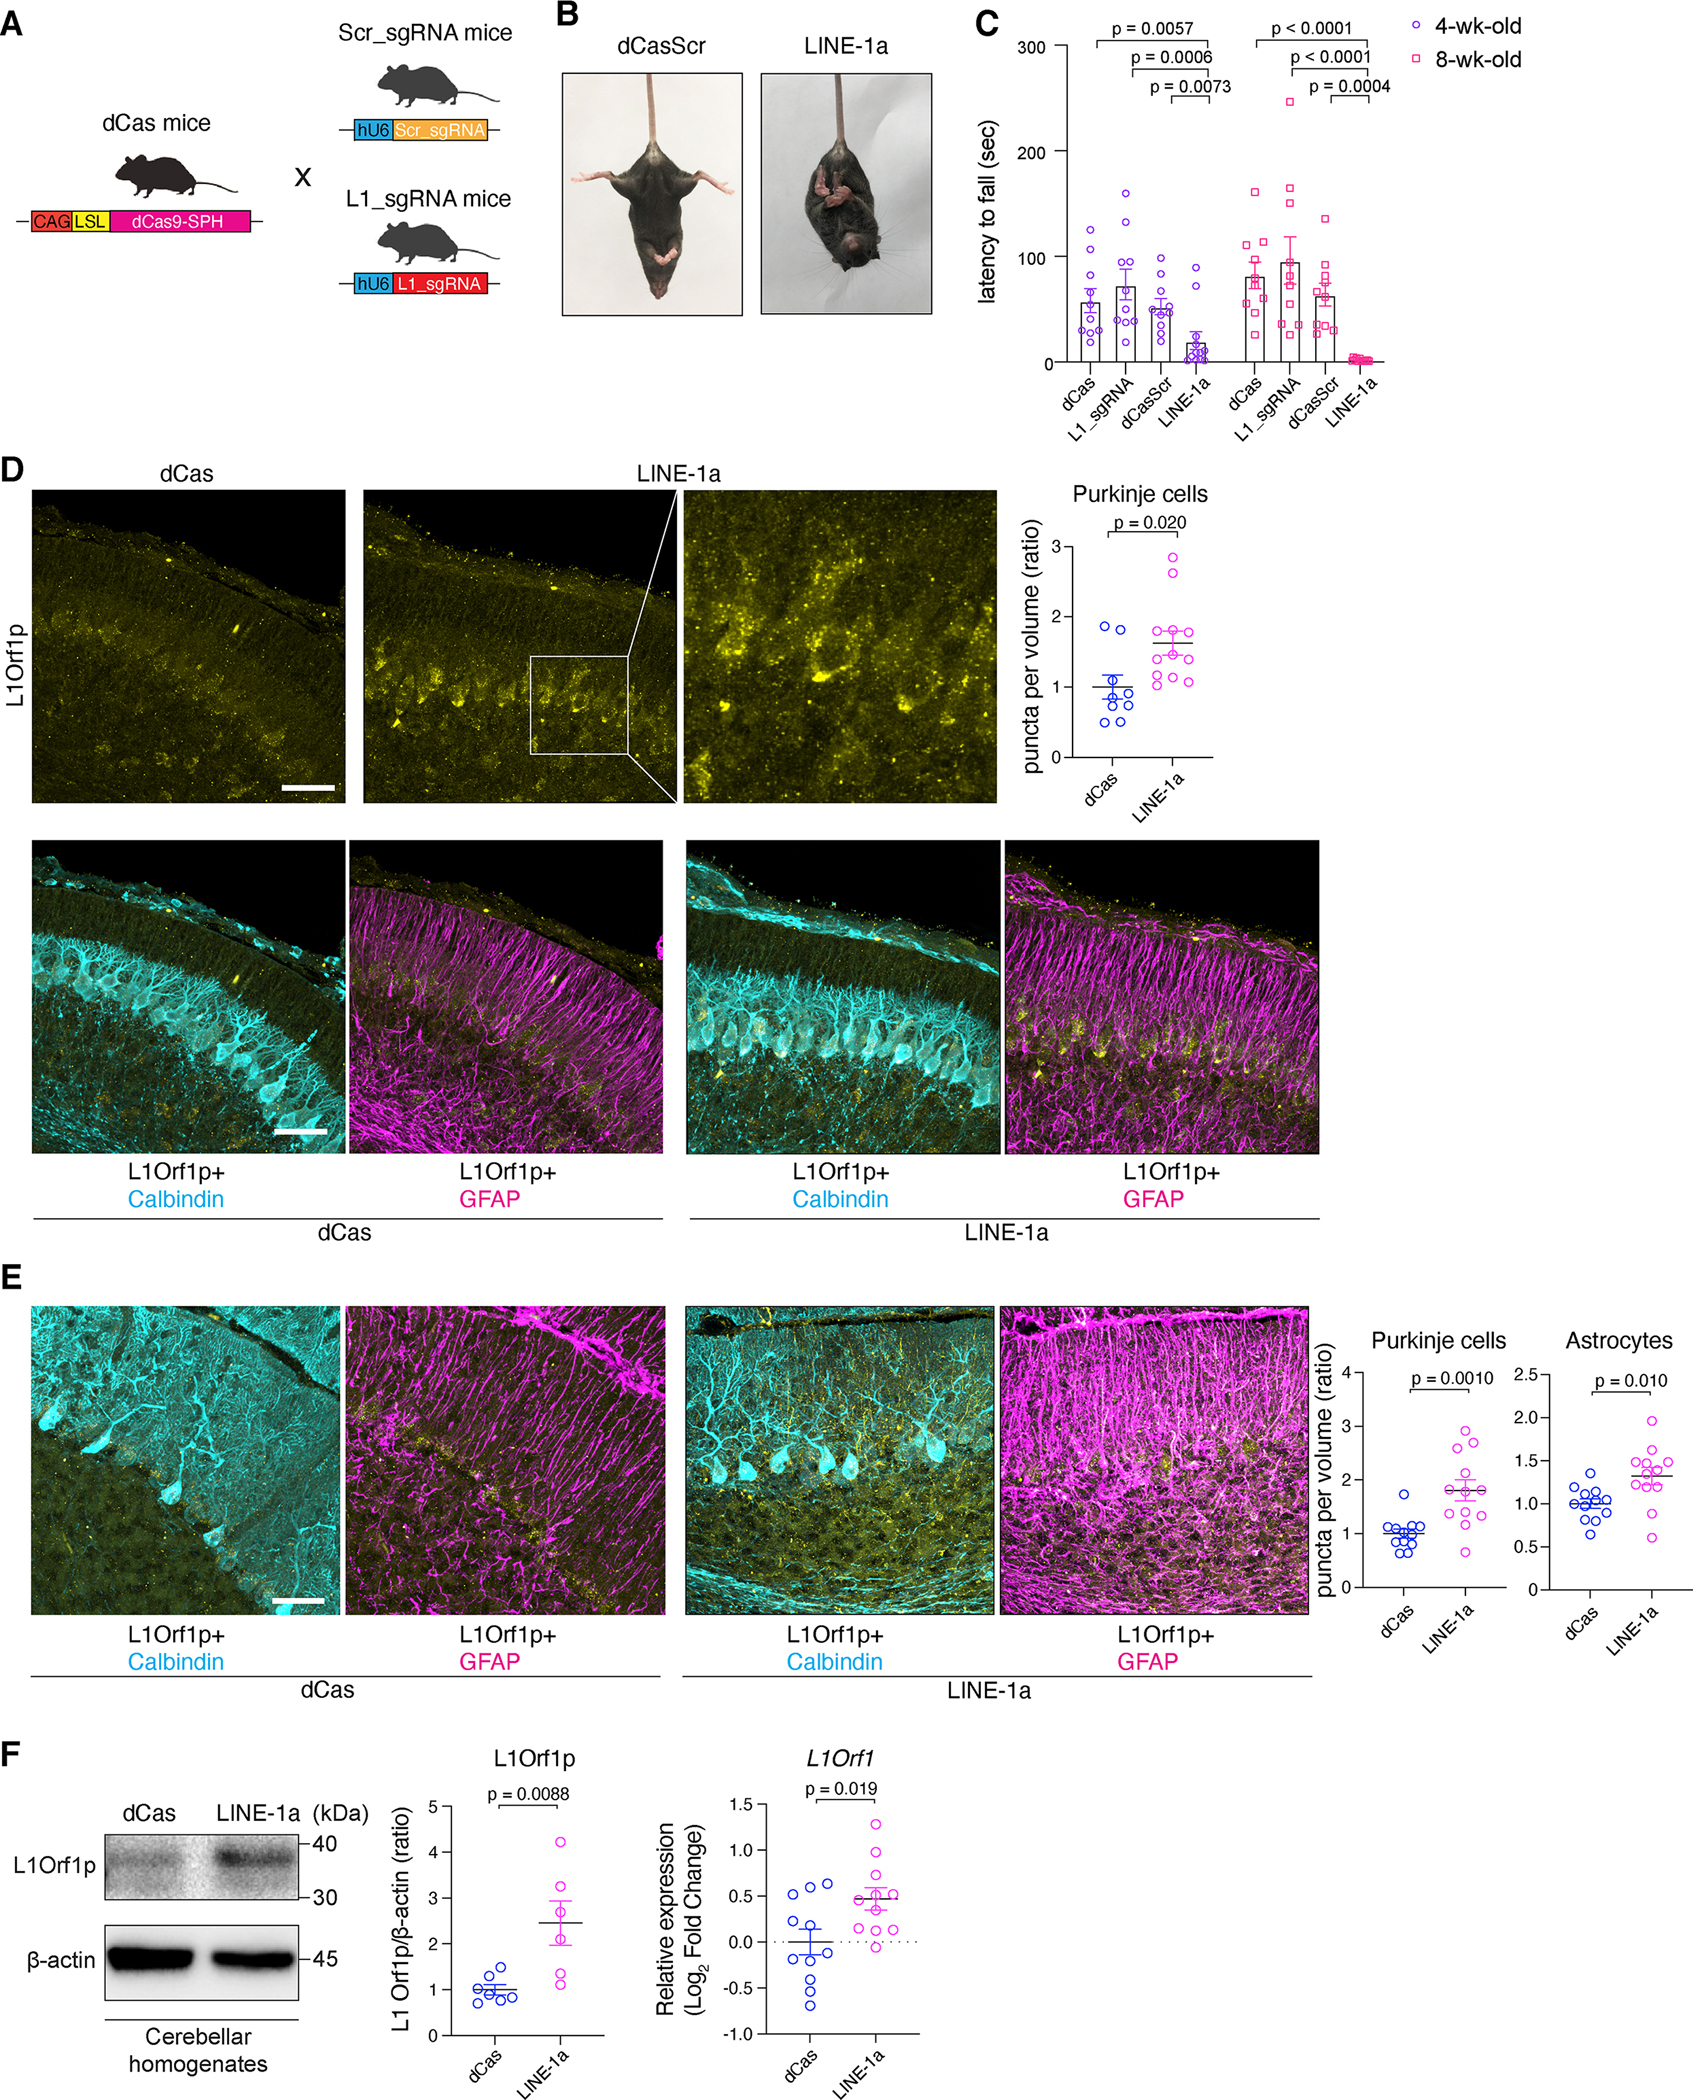
(A) Tg mice harboring Scr_sgRNA or L1_sgRNA were generated and crossed with dCas mice. (B) LINE-1a mice exhibit hindlimb clasping. (C) Results of rotarod tests at 4- and 8-wk-old. n = 10, 10, 10, and 12 for dCas, L1_sgRNA, dCasScr, and LINE-1a mice, respectively. Data are mean ± SEM. p-values with One-way ANOVA Kruskal-Wallis test for the comparison to LINE-1a group at each age. (D) Cerebella from p7 mice were stained for L1Orf1p, Calbindin, and GFAP. Representative images are shown. Scale bar = 30 μm. Puncta densities inside PCs were calculated and shown as ratio. n=3 and 4 for dCas and LINE-1a mice, respectively, and images from 3 different lobules in each mouse. (E) Representative staining images in 8-wk-old mice cerebellum. Scale bar = 30 μm. Relative L1Orf1p puncta densities inside PCs and astrocytes (right). n = 4 per group, assessed in 3 different lobules (n = 12). (F) Representative blots for L1Orf1p and β-actin for cerebellar homogenates (n = 7 and 6, respectively, left panel). Intensities of L1Orfp1 bands shown as ratio (middle panel). L1Orf1 mRNA expression were assessed in bulk cerebellum RNA samples (n = 11 for each group). Results were normalized to Gapdh and shown as log-2 fold change to dCas group. p-values with unpaired t-test. Data are mean ± SEM. See also Figure S2, S3, and Table S2.
The ataxia in LINE-1a mice was progressive. LINE-1a mice showed worse rotarod performance compared to age-/sex-matched controls (dCas mice, L1_sgRNA mice, or dCasScr mice (Figure 2C). We scored ataxia using a scoring system (Guyenet et al., 2010), which also showed progressive ataxia in LINE-1a. There was no significant sex differences (Figures S3F, S3G). Since their rotarod performances were comparable across control groups, we used littermate or age-/sex-matched dCas mice as controls in subsequent studies.
Neurodegeneration in LINE-1a mouse cerebellum
We examined cerebella of LINE-1a mice at postnatal day 7 (p7) and found a significant cytoplasmic accumulation of ribonucleoprotein (RNP) L1Orf1p in PCs (Figure 2D). At 8 weeks of age, the puncta were seen more diffusely in the molecular layer, and again significantly increased in LINE-1a mice compared to dCas mice (Figure 2E). We also noticed reduced staining intensities of Calbindin, and enhancement of GFAP staining, suggesting astrogliosis (Figure 2E). In the cerebellum, granule cells constitute the large majority among cell populations (~99% of neurons) whereas PCs constitute ~1% (Consalez et al., 2020). Despite that, we detected a significant upregulation of L1 at the bulk level in LINE-1a mice (Figure 2F) as well, supporting our staining results.
PCs significantly decreased in LINE-1a mice by 24 weeks of age (Figure 3A). Electron microscopy (EM) revealed the shrinkage and darker color of PCs in LINE-1a mice, which had been reported also in PCs of Atm-KO mice (Kuljis et al., 1997) (Figure 3B). Dilated ERs in LINE-1a PCs suggested ER stress (Figure 3B). Consistently, we found upregulated immunoglobulin heavy chain-binding protein (BiP), a marker for unfolded protein responses, in LINE-1a cerebellum (Figures 3C, 3D).
Figure 3. Neurodegeneration in LINE-1a mice cerebellum.
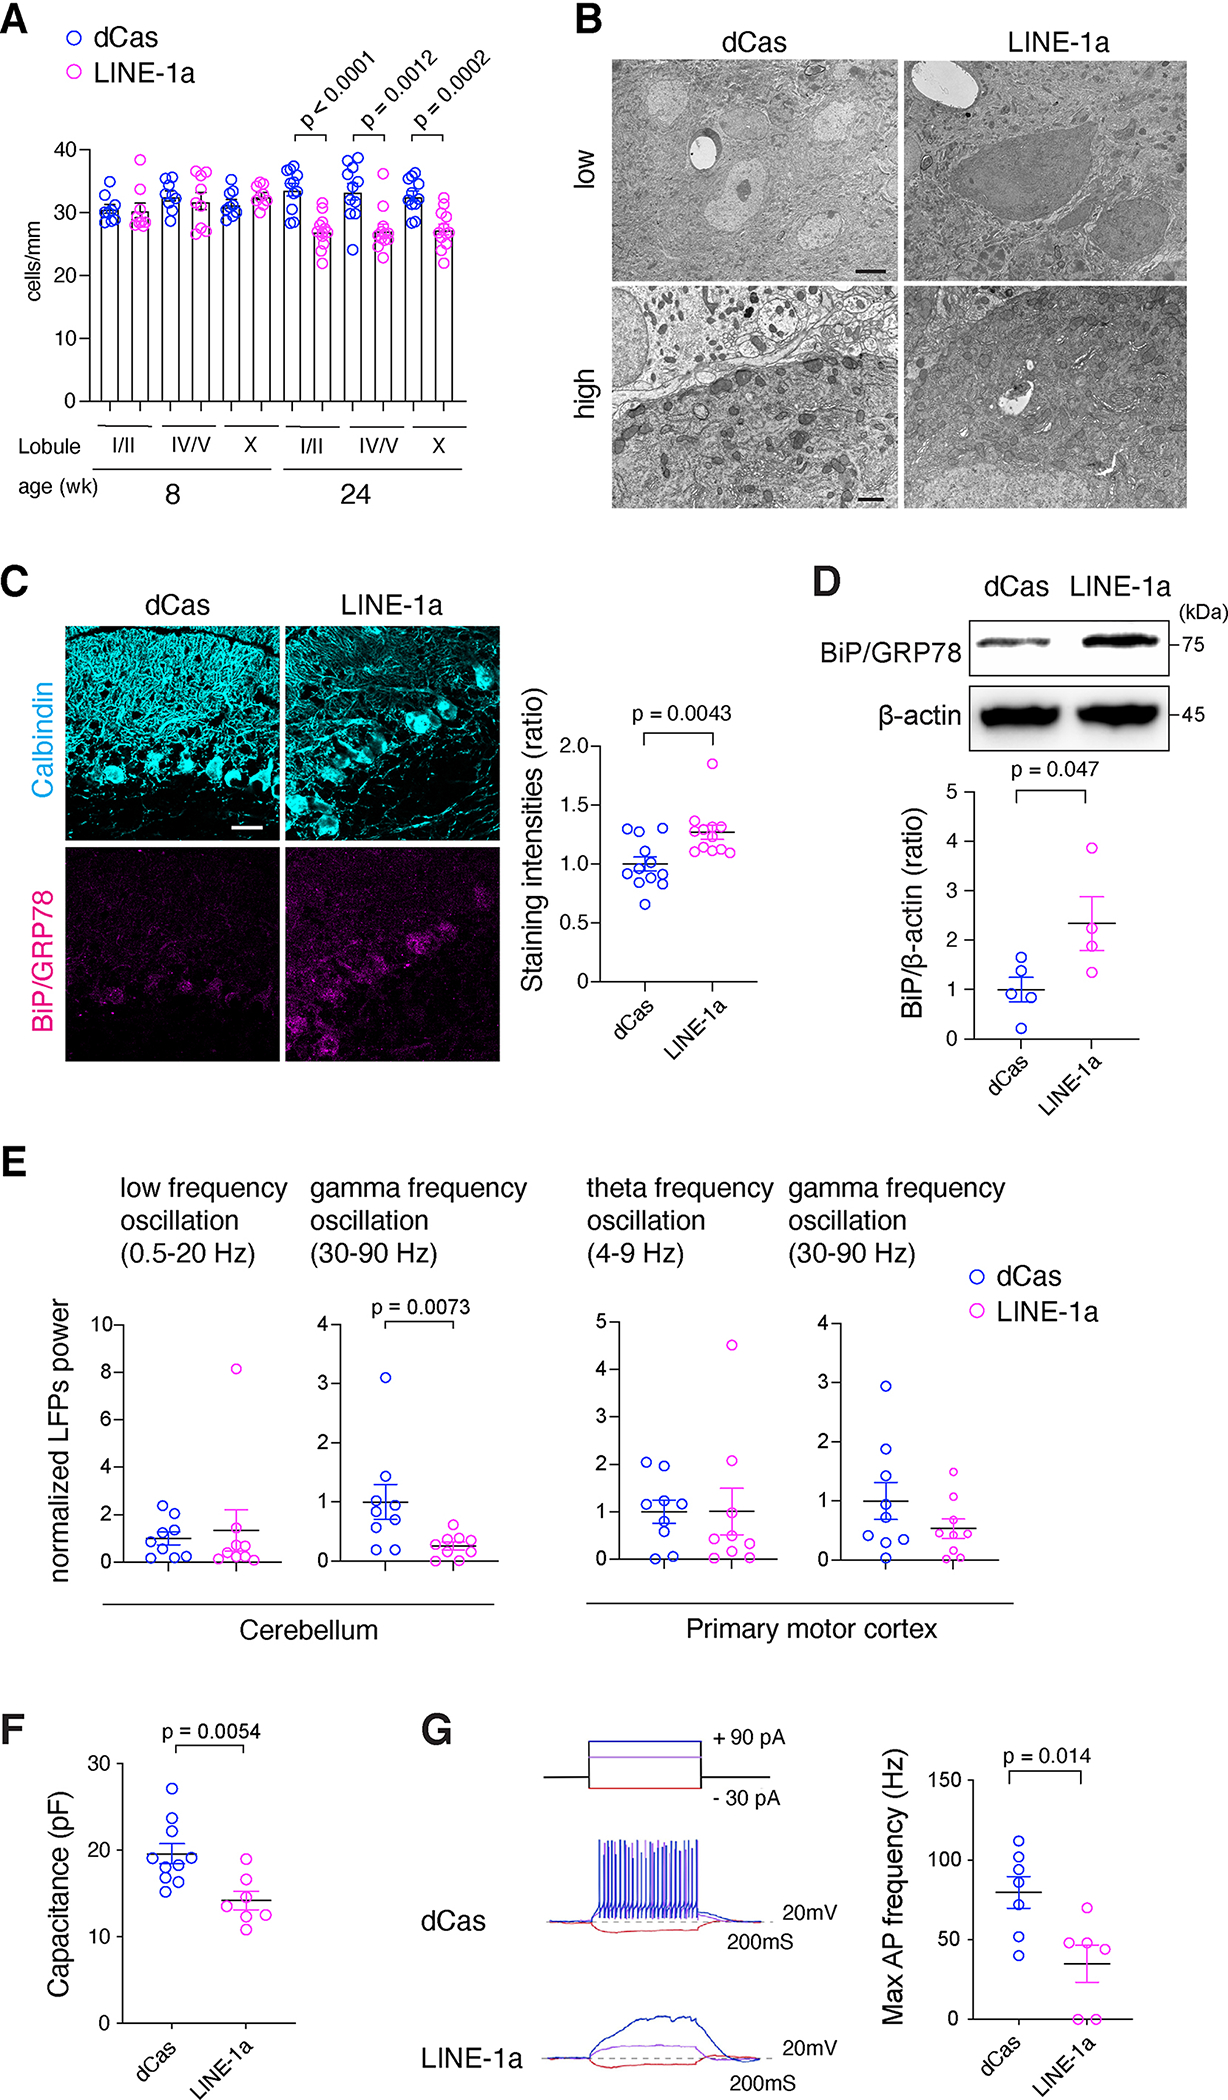
(A) PC numbers were counted and normalized to the length. n = 3 or 4 mice at 8-wk- and 24-wk-old were assessed per group. Three separate sections per mouse were assessed. (B) Representative EM images. n = 3 mice per group. Scale bar = 2 μm for upper panels and 500 nm for lower panels. (C) Representative staining of Calbindin and BiP/GRP78 in the cerebellum. Scale bar = 30 μm. Staining intensities of BiP inside PCs were assessed (n = 4 mice per group and 3 independent lobules per mice). (D) Representative blots for BiP and β-actin for cerebellar homogenates (n = 5 and 4, respectively, upper panel). Intensities of BiP bands shown as ratio (lower panel). (E) LFPs from the cerebellum and M1 in 8-wk-old mice were analyzed. n = 9 mice per group. (F) Capacitances of PCs (n = 10 from 4 dCas and n = 7 from 3 LINE-1a mice, respectively). (G) Upper left, a diagram of current injections. Middle and lower left, membrane responses of representative PCs to current injection. Right, bar graph shows maximal AP frequency from all recorded cells in dCas (n = 7 from 4 mice) and LINE-1a mice (n = 6 from 3 mice). Data are mean ± SEM and p-values with unpaired two-sided t-test in (A), (C), (E), (F), and (G), and Mann-Whitney t-test in (D) for non-normal distribution.
We performed in vivo local field potentials (LFPs) recordings. Power spectrum analysis showed a reduction in cerebellar high-frequency gamma band oscillation in LINE-1a mice. Low-frequency oscillations did not differ between groups, as well as their primary motor cortex M1 field oscillations (Figure 3E). Cerebellar gamma oscillations result from synchronized PC discharges (Middleton et al., 2008), suggesting that PC activity is impaired in LINE-1a mice. Because PCs provide the only pathway from the cerebellum, a defect in their firing patterns impair all computations carried out by the cerebellocerebral loop (De Zeeuw et al., 2008). In contrast, low-frequency oscillations, which were unchanged in LINE-1a mice, arise from the network of granule and Golgi neurons within the granular layer (De Zeeuw et al., 2008).
To probe PC dysfunction directly, we performed ex-vivo recordings of PCs. By whole-cell patch clamp, membrane capacitance was measured in PCs, which was significantly smaller LINE-1a mice (Figure 3F), supporting smaller soma sizes observed in EM (Figure 3B). We performed current-clamp experiments (Figure 3G). In dCas mouse PCs, supra-threshold current injections induced a train of fast action potentials (APs) in all PCs (7 out of 7 cells from 4 mice). In LINE-1a mouse PCs, depolarizing currents up to the maximal level applied to control neurons from dCas mice evoked fewer APs with zero APs in 2 of 6 cells from 3 mice (Figure 3G). Thus, PCs of LINE-1a mice exhibit a functional deficiency along with severe degeneration resulting in impaired PC output.
Attenuation of disease progression with NRTI treatment in LINE-1a mice
Studies have shown that pathologies associated with L1 can be attenuated with NRTIs such as 3TC, FDA-approved antiretroviral drugs (Blaudin de The et al., 2018; De Cecco et al., 2019; Simon et al., 2019; Thomas et al., 2017). NRTIs are in clinical use against HIV encephalitis and are currently tested in trials for TE modulation in neurodegenerative diseases (Peze-Heidsieck et al., 2021).
We tested the impact of 3TC treatment in LINE-1a mice. Following treatment of 4-week-old mice with 3TC over a period of 4 weeks, we found an attenuation of the ataxia progression in LINE-1a 3TC treatment group in contrast to untreated or nevirapine (NEV)-treated LINE-1a group (Figures 4A, S6A). NEV is a non-nucleoside RTI (NNRTI) that cannot suppress L1 activities (Dai et al., 2011). In dCas mice, neither 3TC nor NEV treatment had a negative impact on rotarod performances (Figure 4A). Next, we assessed gene expression in the cerebellum at 8 weeks of age. We observed significantly higher levels of ISGs in LINE-1a compared with dCas mice, which were reduced upon 3TC treatment but not upon NEV treatment (Figure 4B).
Figure 4. Attenuation of disease progression and its underlying molecular signatures with NRTI treatment in LINE-1a mice.
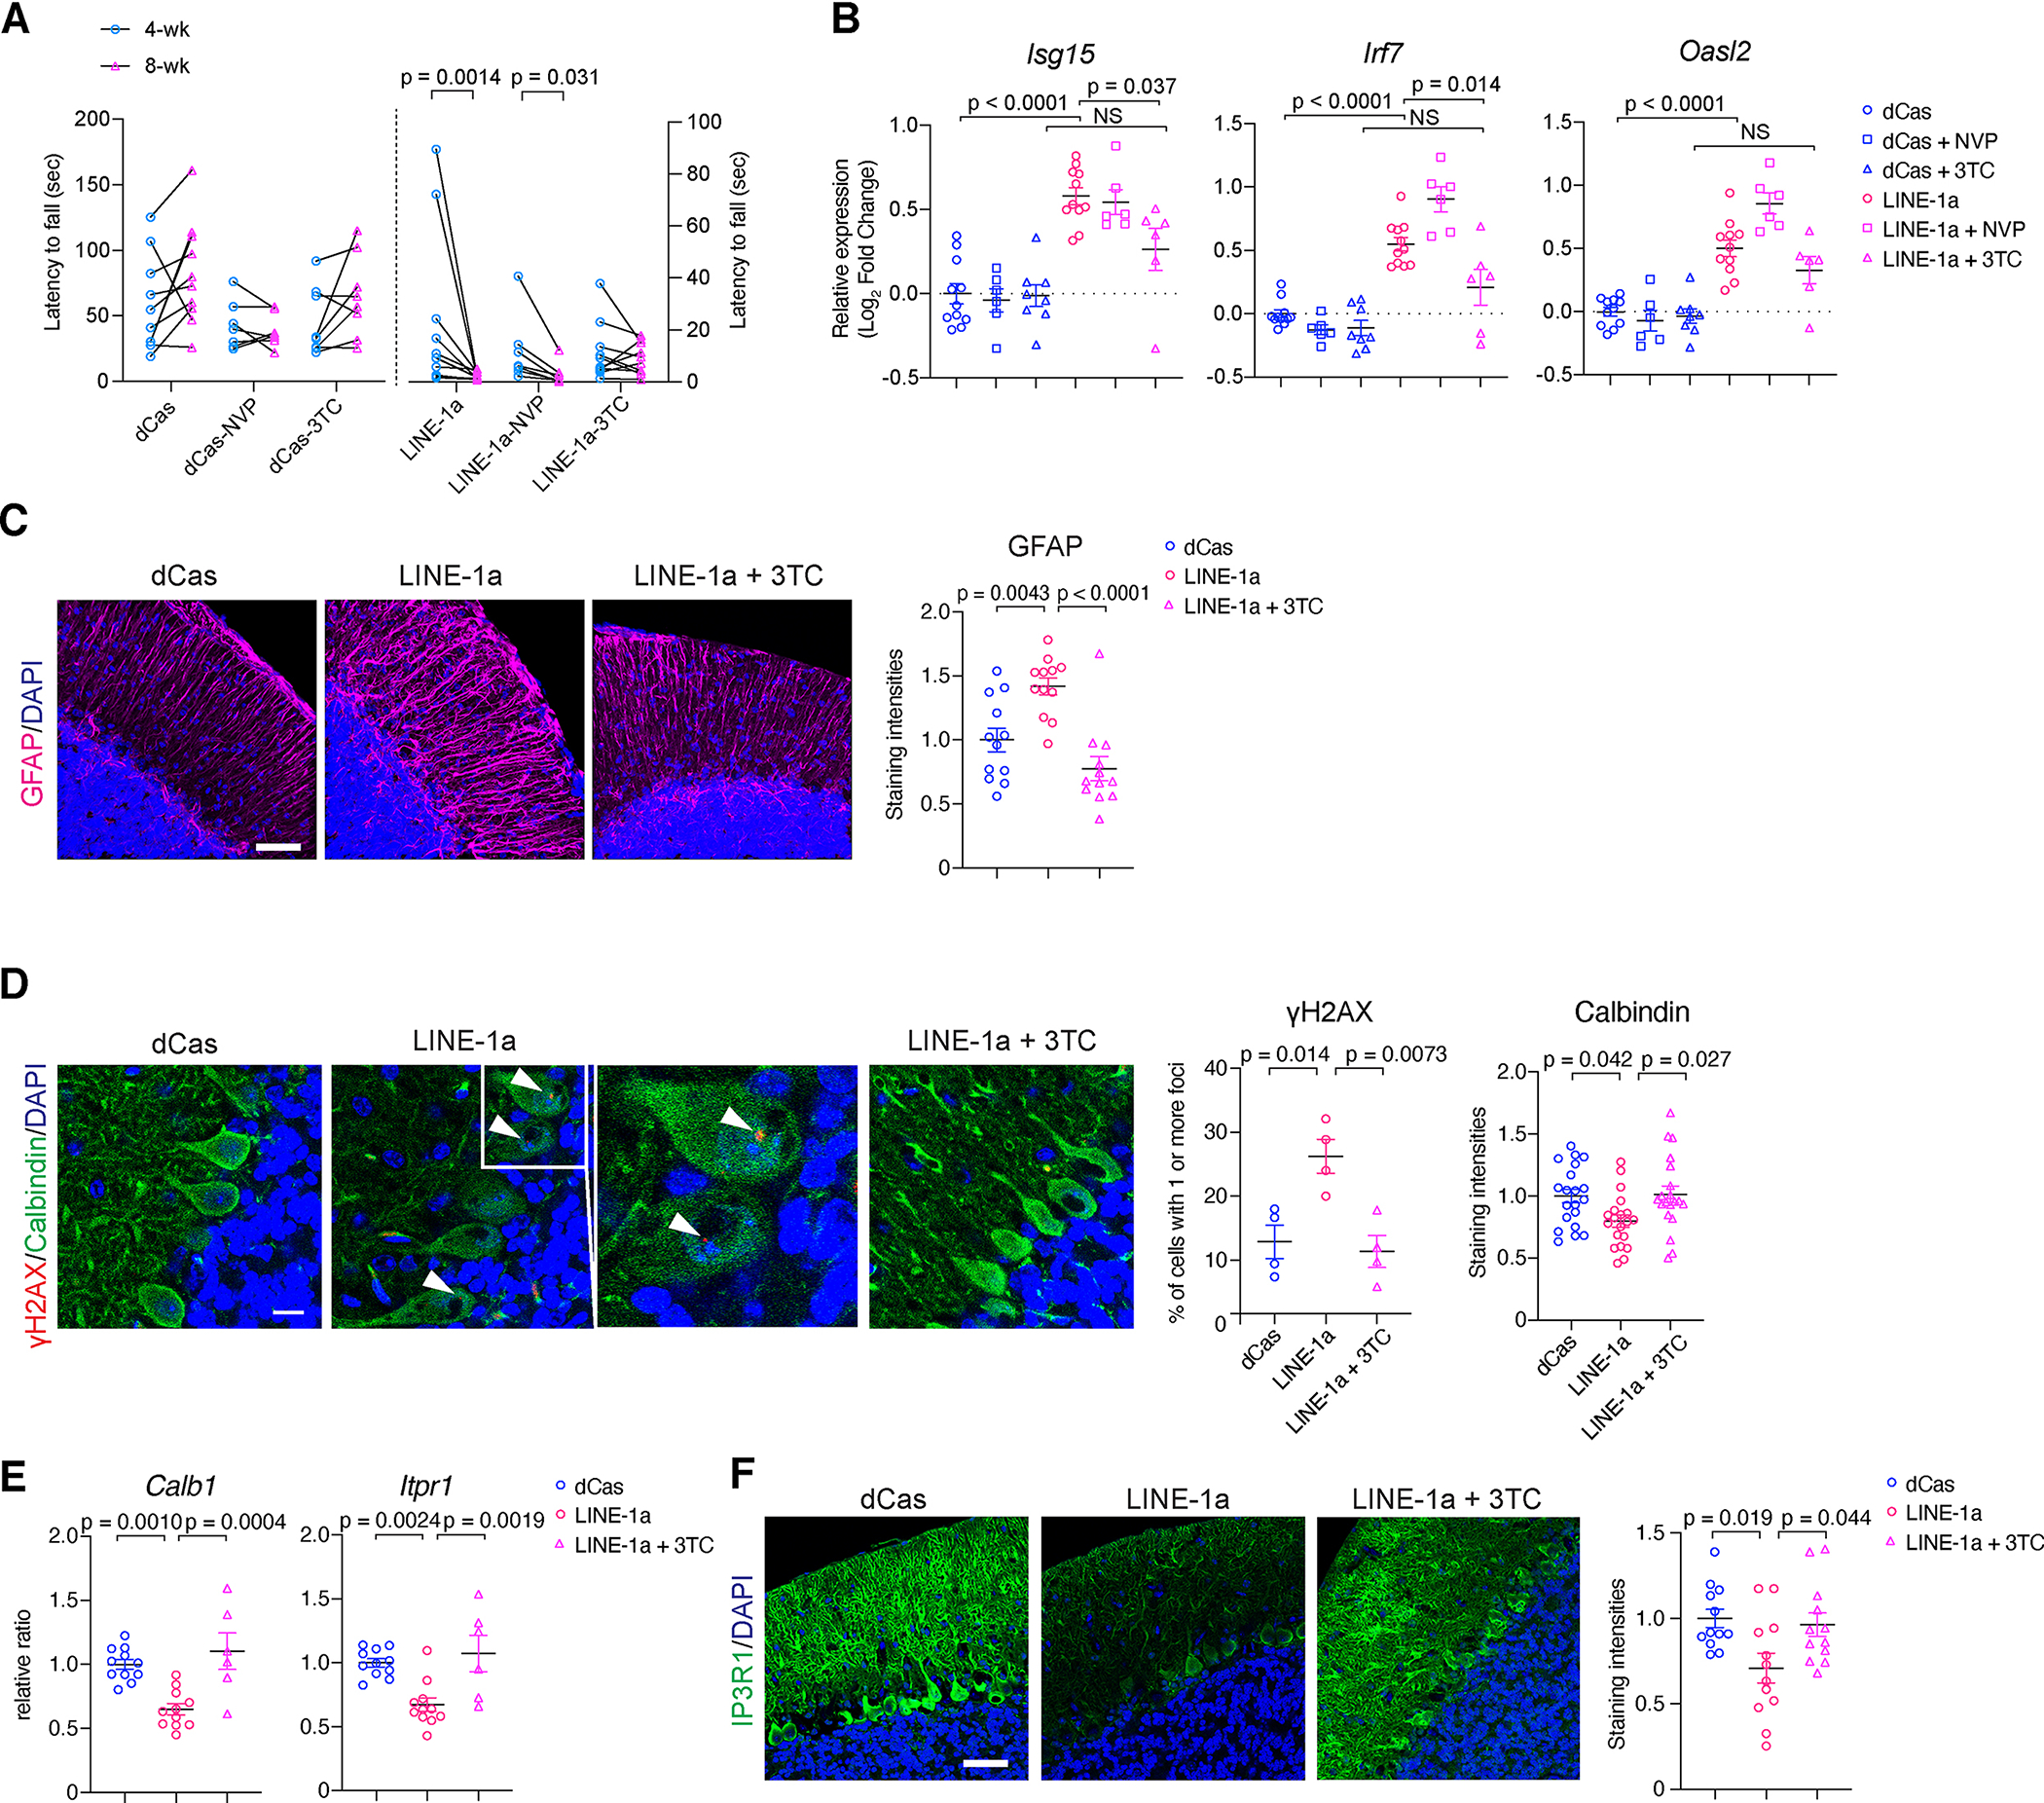
(A) Rotarod test results at 4- and 8-wk-old dCas and LINE-1a mice, either naïve, 3TC-treated, or NEV-treated (n for dCas-naïve/-NEV/−3TC, LINE-1a-naïve/-NEV/−3TC group are 10, 7, 8, 12, 7, and 10, respectively). Left y-axis for dCas groups and right y-axis for LINE-1a groups. Data in naïve groups (dCas and LINE-1a) are the same as shown in Figure 2C. Wilcoxon matched-pairs signed rank test was used for 4- and 8-wk time point comparisons in each group. (B) ISG expressions were compared jn 8-wk-old mice (n= 11, 6, 8, 11, 6, and 6, respectively). Gene expressions were normalized to Gapdh and shown as log2FC with average of dCas-naïve group set at 0. (C) Representative images of GFAP staining in 8-wk-old mice. Scale bar = 30 μm. Mean staining intensities of GFAP are compared. Data are shown as the ratio. (D) Cerebellum in 8-wk-old mice were stained for γH2AX, Calbindin, and DAPI (Scale bar = 10 μm). γH2AX foci in PC nuclei were assessed and quantified (middle panel). n = 4 mice per group and more than 50 PC nuclei were examined per mouse. Arrowheads: γH2AX foci. Mean staining intensities of Calbindin shown as the ratio (right). n = 20 fields in dCas, LINE-1a, and 3TC-treated LINE-1a mice, respectively (n = 4 mice per group and 5 independent fields per mouse). (E) mRNA expression of Calb1 and Itpr1. (F) Representative IP3R1 staining. Quantification of staining intensities on the right (n = 4 mice per group and 3 independent lobules per mice). Scale bar = 30 μm. Data are mean ± SEM. One-way ANOVA with Tukey’s post-hoc test in (B), (C), (D), (E), and (F). See also Figure S4.
We next assessed molecular signatures the cerebella of dCas naive, LINE-1a naive, and LINE-1a-3TC mice. We found a significant decrease in GFAP after 3TC treatment, suggesting attenuated astrogliosis by 3TC (Figure 4C). We found a significantly increased number of γH2AX-positive PC nuclei in LINE-1a mice, which was reduced by 3TC (Figure 4D). At the same time, we noticed that the staining intensity of Calbindin, which was reduced in LINE-1a mice (Figures 2E, 3C), was restored upon 3TC treatment (Figure 4D, 4E). Calbindin is a key calcium buffer in PCs, and its gene CALB1 was among the most significantly downregulated in AT (Figures 1C, S1D). We also assessed Itpr1 encoding IP3R1, which was the most significantly downregulated gene in AT (Figure 1C). IP3R1 is a calcium channel on ER critically regulating the cellular calcium (Bezprozvanny, 2009; Hisatsune and Mikoshiba, 2017; Mikoshiba, 2007). We found a significant decrease in IP3R1 in LINE-1a mice, which was also recovered by 3TC (Figures 4E, 4F). Analyzing RNA-seq from human cerebella, we found that CALB1 and ITPR1 strongly correlated with L1HS and TRIM28 (Figure S4B), implicating common molecular pathways in AT and LINE-1a mice. Collectively, these findings revealed that L1 activation damages PCs triggering genotoxic stress and neuroinflammation, whereas NRTI treatment attenuated DNA damage and mitigated dysregulation of molecules involved in calcium homeostasis.
DISCUSSION
Ataxia telangiectasia is a hereditary cerebellar ataxia caused by mutations in ATM, which initiates DNA damage response (Shiloh, 2020; Shiloh and Ziv, 2013). Studies have shown that ATM regulates L1 activities (Coufal et al., 2011; Jacob-Hirsch et al., 2018). In this study, we created a mouse model in which L1 overexpression is achieved within the cerebella. L1 expression was most prominent in the PC, with evidence of DNA damage, ER stress, ISG elevation, and neurodegeneration. These mice developed severe ataxia that could be prevented by NRTI treatment. In AT patients, we observed elevation of L1 and transcriptional signatures that were observed in LINE-1a mice. The close parallel between AT and LINE-1a mice suggests LINE-1 activation as one of the disease-driving factors in human cerebellar ataxia along with other mechanisms.
In our mouse model of L1 overexpressing mice, we found severe degeneration of PCs with cytoplasmic aggregates of Orf1p and ER stress, potentially disturbing calcium homeostasis (Ron and Walter, 2007). The possible roles of L1Orf1p aggregates and ERV-derived proteins have been suggested in neurodegeneration (Jonsson et al., 2021; Li et al., 2015; Liu et al., 2019; Pereira et al., 2018). Emerging studies are elucidating the crosstalk between DNA damage and ER stress (Hetz et al., 2020). Our data suggest that ER stress and DNA damage by L1 activation might lead to PC degeneration. Additionally, glial cell activation by L1 activation could be playing a role (Thomas et al., 2017). ssDNA accumulation caused by L1 activities engages cGAS-STING pathway (Erdal et al., 2017), whereas STING and IP3R1, both on the ER membrane, form complex and control calcium (Zhang et al., 2020). Interactions between DNA damage and calcium dysregulation by L1 activation awaits further investigations.
Our study has several limitations. First, we generated L1-targeting sgRNA Tg mice with only one sgRNA, and in only one genetic background. Second, dCas9 basal expression was primarily seen in the cerebellum but was not entirely restricted to this organ. Further refinement of the system to allow a more temporally and spatially controlled L1 activation system in vivo is necessary for future studies. Third, we do not rule out the off-target CRISPRa effects. For example, mutations of some of the genes listed in Table S2 have been reported to be associated with neurological manifestations including ataxia (e.g. Reln, Dpp6) (D’Arcangelo et al., 1995; Zarrei et al., 2018). Although NRTI treatment has been widely used to demonstrate the dependency on TE activities in the disease pathologies, it also has intrinsic anti-inflammatory effects independent of reverse transcriptase inhibition, and thus, not entirely specific (Fowler et al., 2014). Additionally, effects of L1 promoter activation could include the effects on the cis-regulatory functions of LINE-1 over gene expressions (Feschotte, 2008). L1 has been reported to act as the alternative promoter for many genes involved in neuronal functions in neural progenitor cells (Jonsson et al., 2019).
While we acknowledge these limitations, the findings of our study support the notion that L1 activation is sufficient to induce neurodegenerative processes which could be attenuated by NRTI treatments. Our collective evidence implicates the pathological role of L1 activation in the cerebellum in the development of ataxia and points to the pleiotropic pathological effects caused by TE activation in neurodegeneration.
STAR METHODS
Resource availability
Lead contact
Further information and requests for resources should be directed to and will be fulfilled by the lead contact, Akiko Iwasaki (akiko.iwasaki@yale.edu).
Materials availability
All unique/stable reagents and mice generated in this study are available from the Lead Contact upon request with a completed Materials Transfer Agreement.
Data and code availability
The RNA-seq datasets in this paper have been deposited in the Gene Expression Omnibus (GEO) database with accession numbers GSE175774 for LINE-1 CRISPRa NIH3T3 cells and control cells and GSE175776 for human cerebellum samples, respectively.
The codes originated in this study for the mapping of L1_sgRNA target site in the mouse genome can be found at http://graphics.med.yale.edu/pattern/ and are publicly available.
Any additional information required to reanalyze the data reported in this work paper is available from the Lead Contact upon request.
Experimental model and subject details
Mice
C57BL/6J mice (stock #000664) and B6;D2-Gm33925Tn(pb-CAG-cas9*,-EGFP)1Yangh/J mice (dCas mice, stock #031645), B6.129-Tg(Pcp2-cre)2Mpin/J (PcP2Cre mice, stock #004146) were obtained from Jackson. All the transgenes were kept heterozygote upon breeding throughout the study. Otherwise indicated in legend, mice from both sexes were used for the experiments, and age information of the mice used can be found in each figure legend. Sex differences in the LINE-1a mice phenotype were assessed but no significant differences were found (Figure S3G), and no remarkable sex differences were noted in histology and gene expressions examined. All the mice were bred in-house at Yale University. Mice were housed in SPF condition and care was provided in accordance with Yale Institutional Animal Care and Use Committee guidelines (protocol #10365).
Human cerebellum tissue samples
Human tissue was obtained from the NIH Neurobiobank at the University of Maryland, Baltimore, MD. Additional tissue specimens were obtained from the NIH Brain & Tissue Repository-California, Human Brain & Spinal Fluid Resource Center, VA West Los Angeles Medical Center, Los Angeles, California, which is supported in part by National Institutes of Health and the US Department of Veterans Affairs. Detailed demographic information of participants and samples (age, sex, post-mortem interval (PMI), manner of death, etc.) can be found in Table S1. For RNA sequencing, cerebellar samples from age-matched 4 males and 2 females were used for both control group and AT group (demographic information for these samples also found in Table S1). In PCA plots (Figure S1B), samples from the same sex showed a tendency to cluster together, while the top principal component (PCA1) clearly segregated between groups (control and AT), meaning that differences between the groups are more pronounced than differences between the sexes within the same group. Due to limited sample size, we did not further assess the sex differences in these human samples, for which much larger cohorts are necessary to draw meaningful and robust conclusions.
Method details
Plasmids and lentivirus packaging
LentiMPHv2, lenti dCas-VP64_Blast, lentiSAMv2, pX330-U6-Chimeric_BB-CBh-hSpCas9, and sgRNA(MS2) cloning backbone were gifts from Dr. Feng Zhang (Addgene plasmid # 89308; http://n2t.net/addgene:89308; RRID:Addgene_89308, Addgene plasmid # 61425; http://n2t.net/addgene:61425; RRID:Addgene_61425, Addgene plasmid # 75112; http://n2t.net/addgene:75112; RRID:Addgene_75112, Addgene plasmid # 99372; http://n2t.net/addgene:99372; RRID:Addgene_99372, Addgene plasmid # 42230; http://n2t.net/addgene:42230; RRID:Addgene_42230, and Addgene plasmid # 61424; http://n2t.net/addgene:61424; RRID:Addgene_61424, respectively) (Cong et al., 2013; Joung et al., 2017; Konermann et al., 2015). The plasmids were amplified in E. coli DH5a or Stbl3 (Thermo Fisher) and purified with Plasmid Plus Kit (QIAGEN). The lentiviruses were packaged in Lenti-X 293T cell line (Takara Bio) with Lenti-X packaging single shots (Takara Bio), and concentrated using Lenti-X concentrator (Takara Bio) following the manufacturer’s instructions.
sgRNA cloning
sgRNA(MS2) cloning backbone or LentiSAMv2 were digested with BbsI (both NEW ENGLAND BIOLABS) in the digestion buffer (NEB 2.1, respectively, NEW ENGLAND BIOLABS) 2 hours at 55 °C or 37 °C, respectively. After digestion, the fragments were electrophoresed in 0.8% agarose gel and purified with Qiaquick Gel Extraction Kit (QIAGEN). Oligos including 20 bp sgRNA sequences plus appropriate overhangs were resuspended in ddH2O at 100 μM and annealed in T4 ligase buffer with T4 polynucleotide kinase (both NEW ENGLAND BIOLABS) starting from 95 °C for 5 minutes and then temperature was ramped down to 25 °C at 5 °C/min. The digested vector and annealed oligos were ligated with T4 ligase and T4 ligase buffer (both NEW ENGLAND BIOLABS) at room temperature for 2 hours, transformed in Stbl3 or DH5a competent cells (Thermo Fisher), and plated onto LB plates with appropriate antibiotics. The colonies were picked up for miniprep (QIAprep Spin Miniprep Kit, QIAGEN) and sequencing, and confirmed that the correct sequences were cloned into the sgRNA cloning sites. The sequences of the oligos used for sgRNAs can be found in Table S3.
Generation of L1_sgRNA and Scr_sgRNA Tg mice
L1_sgRNA and Scr_sgRNA Tg mice were designed and generated in collaboration with Yale Genome Editing Center at Yale University. First, pX330 vector (addgene plasmid #42230) was digested with BbsI (NEW ENGLAND BIOLABS), and each sgRNA sequence was cloned into the sgRNA cloning site as described above. The plasmids were amplified in E. coli DH5α and purified with a EndoFree Plasmid Maxi Kit (QIAGEN). The plasmids were then digested with AflIII and XbaI (both NEW ENGLAND BIOLABS) to cut out the hU6 promoter and sgRNA sequence. After linearization, the plasmids were microinjected into C57BL/6J × C57BL/6J fertilized oocytes. The incorporation of the transgene into the genome was determined by PCR analysis using genomic DNA extracted from tails. One of the mouse from each strain was chosen as the founder mouse and mated with C57BL/6J mice, and the germ line transmission of the transgene was determined by PCR. The progenies of both sgRNA strains were fertile and had normal litter sizes.
Plasmid transfections, lentiviral transductions, and 3TC treatment
For lentivirus transduction, 2 × 10⁵ NIH-3T3 cells were seeded in 6-well cell culture plate. The next day, packaged and concentrated lentivirus supes were added in the cell culture and spinfected for 90 min at 25 °C, 1200 g in the presence of 5 μg/ml polybrene (Santa Cruz). Forty-eight hours after spinfection, antibiotics selection was started. The cells were selected with Hygromycin B (Invivogen) 200 μg/ml, Blasticidin (Thermo Fisher) 5 μg/ml, or Puromycin (Sigma) 2 μg/ml for 4 days. For plasmid transfection, 4 × 10⁴ cells/well or 2 × 10⁵ cells/well were seeded in 24 or 6 well culture dish, respectively, the day before transfection. The plasmids were transfected to the cells using lipofectamine 3000 transfection reagent (Thermo Fisher). The cells were harvested and analyzed at the time point(s) indicated in each figure legend.
Reverse transcription-quantitative polymerase chain reaction (RT-PCR)
RNA was isolated from total NIH-3T3 cells, mouse tissues, or postmortem human cerebellar vermis samples using either the RNeasy Kit or RNeasy Fibrous Tissue Kit following the manufacturer’s protocols (QIAGEN). For tissue RNA extraction, tissues were harvested into RLT buffer (QIAGEN) and disrupted by the bead homogenization in Lysing Matrix D tubes using a FastPrep-24 5G homogenizer (MP Biomedicals). cDNA was synthesized using Quantitect Reverse Transcription Kit (QIAGEN) from 200 ng isolated mRNA. Quantitative PCR was performed using iTaq Universal SYBR Green Supermix (Biorad). To completely eliminate the genomic DNA contamination, RNA samples were treated with RNase-Free DNase I (Qiagen) and genomic DNA wipeout buffer (Qiagen) during and after the RNA extraction procedures, respectively. Negative amplifications with qRT-PCR were confirmed in the samples in which reverse transcriptase were not added in the cDNA synthesis step to exclude the genomic DNA contaminations. Primers sequences are listed in Table S3. For dCas9 mRNA detection, a commercially available specific primer set was used (System Biosciences). For the detection of some other targets, Taqman primer sets were used with TaqMan Fast Advanced Master Mix (ThermoFisher) following the manufacturer’s instructions (Table S3).
RNA sequencing, data processing, and analysis
Two hundred ng of total RNA was used for paired-end library generation with the NEBNext Ultra II RNA Library Prep Kit for Illumina (E7770) for mouse samples. In the library generation of human cerebellum RNA samples, NEBNext rRNA Depletion Kit (NEB E6310) was used. Libraries were run on a NextSeq500 to generate 2×75 bp reads for mouse samples and 2×42bp reads for human samples.
Sequencing raw data were aligned using STAR (STAR/2.5.3a-foss-2016b, mm10 assembly for mouse and hg38 for human samples, respectively)(Dobin et al., 2013) with parameters: --runThreadN 20 --outSAMtype BAM SortedByCoordinate --limitBAMsortRAM 35129075129 --outFilterMultimapNmax 1 --outFilterMismatchNmax 999 --outFilterMismatchNoverLmax 0.02 --alignIntronMin 20 --alignIntronMax 1000000 --alignMatesGapMax 1000000 for mapping host genes. For endogenous retroelements, ERVMAP(Tokuyama et al., 2018; Treger et al., 2019) and RepEnrich2(Criscione et al., 2014) were used using modules, Python/2.7.13-foss-2016b, Bowtie2/2.2.9-foss-2016b, BEDTools/2.27.1-foss-2016b and SAMtools/1.9-foss-2016b using repeatmasker mm10 assembly. Counts were counted using BEDTools (BEDTools/2.27.1-foss-2016b)(Quinlan and Hall, 2010), coverageBed function, and normalized using DESeq2 (Love et al., 2014). The heatmaps and volcano plots were prepared using R version 4.0.5. Gene ontology (GO) analysis were performed with DEGs (genes with |Log2FoldChange| > 1, Padj < 1 × 10⁻²), using Database for Annotation Visualization and Integrated Discovery (DAVID) ver 6.8 (NIH/NIAID) (Huang da et al., 2009).
Analysis on the correlation between expression fold changes of the genes and distances to the L1_sgRNA target sites in CRISPRa cells
The L1_sgRNA target sequences were searched in the mouse genome (GRCm38) using a program with 0 or 1 edit distance (mismatch, insertion, or deletion) The scripts are publicly available at http://graphics.med.yale.edu/pattern/. The transcription start sites (TSS) were downloaded from Ensembl website (http://useast.ensembl.org/biomart/martview/) on 2019/2/14. The fields downloaded are “Transcription start site (TSS)”, “Gene name”, “Gene stable ID”, “Transcript stable ID”, “Gene type”, and “Strand”. The TSS sites were then grouped by chromosome, “Gene name”, “Gene stable ID”, “Gene type” and “Strand” to get a minimum and maximum to serve as a TSS region for each gene. The file was then sorted and converted to BED format. The BED file was further cleaned by only keeping entries from chromosomes 1–22, X, Y, and MT. The L1_sgRNA target site with exact 20 bp match or at most one matching error was used to search the BED file of TSS sites to obtain the closest TSS for each L1_sgRNA target site, using the program “closest” from bedtools suite (Quinlan and Hall, 2010). The closest TSS sites were then linked to log2FoldChange from DESeq2. The plot was generated using R package, with genes whose “Gene type” is protein coding.
Western Blotting
For cultured cells, cells were lysed with 1x cell lysis buffer (Cell signaling). For mouse tissues, tissues were harvested in lysis buffer (20 mM Tris (pH 7.5), 1% NP-40, 150 mM NaCl with protease inhibitor cocktail (Roche Diagnostics)) and disrupted by the bead homogenization in Lysing Matrix D tubes using a FastPrep-24 5G homogenizer (MP Biomedicals). Lysates were centrifuged at 4°C, 15,000 g for 10 minutes and supernatants were collected. Proteins were fractionated by 10% SDS-PAGE and transferred onto PVDF membranes. The membranes were blocked with TBST with 5% Non-Fat Dry Milk (AmericanBio) for 30 minutes. After blocking, the membrane was probed with the following primary antibodies for overnight at 4°C: Rabbit anti-mouse LINE-1Orf1p (Abcam, ab216324, 1:1000), Mouse anti-GAPDH antibody (HRP conjugated, GeneTex, GT239, 1:5000), Rabbit anti-Cas9 antibody (Diagenode, C15310258, 1:1000), Rabbit anti-BiP antibody (Cell signaling, #3177, 1:1000), Mouse anti-β actin antibody (HRP conjugated, Cell signaling, #5125, 1:2000). After washing, secondary IgG-HRP antibodies (anti-Rabbit IgG, HRP and anti-Mouse IgG, HRP, Cell signaling, #7074 and #7076, respectively. Both 1:1000) were added and incubated for 1 hour at room temperature. The blot was visualized using SuperSignal West Pico PLUS Chemiluminescent Substrate (Thermo Fisher). The band intensities were quantified with ImageJ software (NIH, ImageJ version 1.51m9). The band intensities of the target molecules were normalized to the intensities of β-actin.
Assessment of composite ataxia scores
The mice were assessed on their ataxia score using the composite phenotype scoring system by Guyenet et al. (Guyenet et al., 2010). Mice at the age of 4-, 8--wk-old were evaluated. The evaluation was not blinded for the genotype and sex of the animals.
Rotarod test
The mice were placed on a horizontally oriented rod (ACCUROTOE ROTAROD: AccuScan Instruments, Inc) that has an accelerating rotation speed (0–40 rpm over 0–300 seconds). Mice were put on the rod when the rotation speed was 4 rpm, and time to fall off the rod was recorded. Each mouse underwent three trials per day with an interval of 15 minutes between trials. Records for the last performances in the three consecutive trials were used for the analysis.
In vitro electrophysiology
Sagittal cerebellar slices, 300 μm thick, were cut from mice as described previously (Liu et al, 2010). Briefly, dCas and LINE-1a mice were deeply anesthetized with isoflurane and decapitated. Then brains were rapidly removed, trimmed to a tissue block containing only the cerebellum, and sectioned with a vibratome in an oxygenated (with 5% CO2 and 95% O2) cutting solution at 4 °C containing sucrose 220 mM, KCl 2.5 mM, CaCl2 1 mM, MgCl2 6 mM, NaH2PO4 1.25 mM, NaHCO3 26 mM, and glucose 10 mM, at pH 7.3 titrated with NaOH. After preparation, slices were maintained in a storage chamber with oxygenated artificial cerebrospinal fluid (ACSF) containing NaCl 124 mM, KCl 3 mM, CaCl2 2 mM, MgCl2 2 mM, NaH2PO4 1.23 mM, NaHCO3 26 mM, glucose 10 mM, at pH 7.4 titrated with NaOH. Cerebellar slices were transferred to a recording chamber constantly perfused with ACSF at 33 °C with a rate of 2 ml/min after at least 1 hour of recovery.
Whole-cell voltage and current clamp was performed with a Multiclamp 700B amplifier (Axon instrument, CA) as described previously (Liu et al., 2011; Liu and Gao, 2007). The patch pipettes with a tip resistance of 4–6 MΩ were made of borosilicate glass (World Precision Instruments) with a Sutter pipette puller (P-97) and filled with a pipette solution containing K-gluconate 135 mM, MgCl2 2 mM, HEPES 10 mM, EGTA 1.1 mM, Mg-ATP 2 mM, Na2-phosphocreatine 10 mM, and Na2-GTP 0.3 mM, at pH 7.3 titrated with KOH. After a giga-ohm (GΩ) seal and whole-cell access were achieved, the series resistance (between 10 and 20 MΩ) was partially compensated by the amplifier. Membrane resistance and capacitance were measured under voltage clamp at −60 mV immediately after the establishment of whole cell configuration with a test protocol included in AxoGraph X. To arcuately measure capacitance, membrane response to the test protocol was sampled at 10 kHz and not filtered. All recordings with a serial resistance larger than 15 MΩ were not included in capacitance measurements. To test the action potential firing properties in PCs, whole-cell current clamp was performed and a series of current injections (initial = −30 pA, increment = 20 pA, duration 500 ms, 7 steps) were applied to recorded cells. However, the exact intensity of the current injection was adjusted according to input resistance in each recorded neuron.
All data were sampled at 10 kHz and filtered at 3 kHz with an Apple Macintosh computer using AxoGraph X (AxoGraph, Inc.). Electrophysiological data were analyzed with AxoGraph X and plotted with Igor Pro software (WaveMetrics, Lake Oswego, OR).
In vivo electrophysiology
Local field potentials (LFPs) recordings were performed in vivo from the primary motor cortex (M1) and cerebellum in dCas and LINE-1a mice (n = 5 and 4 for male and female, respectively) using a 16-channel silicon probe (A1×16; NeuroNexus Technologies, Inc). Eight-week-old mice were anesthetized with urethane (1.5 g/kg) given by intraperitoneal injection, and placed in a stereotaxic frame (Kopf) on a temperature-regulated heating pad (Physitemp Instruments Inc.) set to maintain body temperature at 37–38 °C. After unilateral craniotomies above the targeted regions, the recording probe was positioned and lowered first in the M1 region (1.1 mm anterior from bregma, 1.5 mm lateral, and 1.0 mm ventral from the brain surface) and then in the cerebellum (6.2 mm posterior from bregma, at midline and 1.7 mm ventral from the brain surface) using coordinates from the stereotaxic atlas (Franklin and Paxinos, 2013). Before the beginning of recordings at each site, animals were allowed to stabilize for 15 minutes, whereupon spontaneous LFPs from M1 and cerebellum were measured over 20 minutes. The recording signal was amplified using A-M System amplifier (model 3600, Carlsborg) with filters set between 1 Hz and 500 Hz, digitized at a rate of 1 kHz, and collected on a computer via a CED Micro1401-3 interface and Spike2 software (Cambridge Electronic Design).
For quantitative offline analyses, LFPs were subjected to Fast Fourier transform at a spectral resolution of 0.24 Hz using Spike2. The range of the bands/oscillations are defined as follows: theta band: 4–9 Hz, gamma band: 30–90 Hz, and low oscillation (encompassing delta, theta, alfa, and low beta) from 0.5–20 Hz. The magnitude of the power of spontaneous oscillatory activity was computed in 5-minute-long epochs of stable LFP signals for each animal by averaging power in a given band across the 5 superficial channels (15–11) for both cerebellum and M1. To determine gamma oscillation power, the signal was first band-pass filtered between 30 Hz and 90 Hz. For statistical comparisons LFPs power values in each band were normalized to the respective mean values of controls in each sex, and then the results were combined for male and female mice.
Purkinje cell count and measurement
Purkinje cell numbers were counted using 3 different sections of midsagittal cerebellar sections for each mouse. Cells in each lobule were counted and normalized to the length measured with ImageJ.
Immunocytochemistry staining of single-stranded DNA (ssDNA) and L1Orf1p
MEFs transduced with lentiviruses and selected with antibiotics as described above were seeded at the concentration of 4 × 10⁴ cells/well in the 4-well cell culture chamber slides (Nunc Lab-Tek Chamber Slide, C6932), and the cells were cultured for 48 hours under the presence of 3TC (10 μg/ml) or DMSO. Then the cells were washed with ice-cold PBS, fixed on ice with 4% paraformaldehyde (PFA) for 10 minutes, and then incubated in 100% methanol at −20 °C overnight. The cells were then treated with 200 mg/ml RNase A (Thermo Fisher) at 37°C for 4 hrs. Cells were blocked with 3% BSA and incubated overnight at 4°C with primary antibodies diluted in 3% BSA. The antibodies used and dilutions were as follows: Rabbit anti-mouse L1 Orf1p (Abcam, ab216324, 1:100), Mouse anti-single strand DNA (Sigma-Millipore, MAB3299, 1:100). After incubation, cells were washed three times with PBS for 5 minutes, and incubated with secondary antibodies (Goat anti-Rabbit IgG Alexa Fluor 488, Thermo Fisher, A11008, 1:1000; Goat anti-Mouse IgG Alexa Fluor 647, A21235, 1:1000) for 1 hour at room temperature, washed three times with PBS, counterstained with DAPI (Sigma-Millipore, MBD0015), washed, and coverslips were mounted on slides with ProLong Gold (Invitrogen). The cells were observed, and images were acquired with Leica SP8 on HC PL APO 40x/1.30 oil-immersion.
Immunohistochemistry and immunofluorescence staining of the mouse cerebellum
For immunohistochemistry, mice were euthanized and perfused transcardially with 4% PFA in PBS, pH 7.4. Brains were kept in 4% PFA in PBS overnight at 4 °C, dehydrated in 70 % ethanol, and embedded in paraffin. Sections were made and slides were stained for Hematoxylin and Eosin (H&E) at the Yale Pathology Tissue Services Core.
For immunofluorescence studies, mice were euthanized and perfused transcardially with 4% PFA in PBS, pH 7.4. Brains were kept in fixation solution overnight at 4 °C, transferred to 30% sucrose solution for 24 hours, and embedded in O.C.T. (Tissue-Tek) for frozen sectioning in a cryostat. Cerebellar parasagittal sections were cut at a thickness of 40 μm through the vermis. Tissues were permeabilized, washed and stained while free-floating in 24-well cell culture plate. First, tissues were permeabilized with 0.3% Triton X-100 in PBS, then incubated with 10% normal donkey serum (Jackson ImmunoResearch) in 0.3% Triton X-100 in PBS (blocking solution) for 1 hour, and subsequently immunoreacted with the primary antibodies (Mouse anti-Calbindin antibody, Abcam, ab82812, 1:200; Chicken anti-GFAP antibody, Thermo Fisher, PA1-10004, 1:200; Rabbit anti-mouse LINE-1 Orf1p antibody, Abcam, ab216324, 1:100, Rabbit anti-IP3 Receptor 1 antibody, Thermo Fisher, PA1-901, 1:200, Rabbit anti-γH2AX antibody, Cell Signaling, #9718, 1:200, Rabbit anti-BiP antibody, Cell signaling, #3177, 1:100, Rabbit anti-Cas9 antibody, Cell signaling, #19526, 1:100, anti-GFP antibody, abcam, ab290, 1:100) at 4 °C for 16 hours. Tissues were washed with PBS, immunoreacted with secondary antibodies (Goat anti-Mouse IgG Alexa Fluor 488, Goat anti-Chicken IgY Alexa Fluor 555, Donkey anti-Rabbit IgG Alexa Fluor 647, all from Thermo Fisher and used at 1:1000 dilution), washed with PBS, stained with DAPI (Sigma-Millipore), washed with PBS, and tissues were placed on the slide glasses. Coverslips were mounted with ProLong Gold Antifade mountant (Invitrogen). Z-stack images (1μm step) from three different cerebellar lobules (lobule I/II, IX, and X) per mouse were acquired using the same settings on Leica SP8 on HC PL APO 40x/1.30 oil-immersion. The 3D images reconstructed from the stacked confocal images were analyzed for staining surface, staining intensities, γH2AX foci, and LINE-1Orf1p puncta with the image analyzer IMARIS (Imaris 9.2, Bitplane AG). The puncta were quantified using the spot detection function of the IMARIS software (expected puncta radius set at 1 μm). The number of puncta inside Calbindin staining surface (PCs) or GFAP staining (astrocytes) surface was divided by the volume inside each surface to calculate the puncta densities per volume in each cell type. For staining intensity assessments, the mean staining intensity inside the staining structures (GFAP for astrocytes and Calbindin for PCs) in the given 3D field computed by the IMARIS software was used as the staining intensities for that field. In the figures, staining intensity in each visual field is shown and presented as a dot with the average intensity in the control group set at 1, thus showing the ratio between groups.
DNA damage assessment in vitro with γH2AX staining
Immunofluorescent staining and analysis for γH2AX foci analysis were performed as previously described (Sulkowski et al., 2017; Sulkowski et al., 2018). MEFs were transduced with lentiMPHv2 and lentiSAMv2 with either scr_sgRNA or L1_sgRNA, selected and passaged as described above and treated with 10 μM of 3TC or DMSO for 7 days. Then the cells were trypsinized and seeded in chamber slides. Subsequently, cells were fixed and permeabilized in 1% Formaldehyde/0.2% Triton-X100 for 15 minutes and blocked with 5% bovine serum albumin in PBS for 1 hour at room temperature. Proteins were stained overnight at 4°C with primary antibody (Mouse anti-γH2AX antibody; Millipore Sigma #05-636, 1:300) diluted in blocking solution. Upon washing with 0.5% Triton-X100 in PBS, samples were incubated with secondary antibody (Thermo Fisher, anti-mouse AF 555, 1:1000) for 60 minutes at room temperature. DNA was stained with for 5 minutes at room temperature with DAPI. Data were collected with an EVOS FL microscope (Advanced Microscopy Group). Foci were analyzed with Cell Profiler software (McQuin et al., 2018). More than 100 cells analyzed per condition for each experiment.
DNA damage assessment in cerebellar Purkinje cell nuclei in vivo
For the assessment of γH2AX foci in Purkinje cell nuclei, γH2AX, Calbindin, and DAPI were costained in cerebellum as described above, and images were obtained with Leica SP8 on HC PL APO 60x/1.30 oil-immersion. Each visual field contained 7–15 Purkinje cell nuclei, and presence of γH2AX foci inside each Purkinje cell nucleus was evaluated. Foci inside nuclei that were visible in two consecutive Z-stack images (Z-step 1 μm) were counted as γH2AX foci. Images from 4 to 6 fields from at least 3 different lobules were collected in order to assess > 50 Purkinje cell nuclei per mouse, and percentage of foci positive Purkinje nuclei among the total nuclei assessed were calculated for each mouse.
Electron microscopy
Mice were deeply anesthetized and were perfused with Somogyi-Takagi fixative (Somogyi and Takagi, 1982). The cerebellum was cut with Vibratome in 50 μm thick sections. After osmication, the sections were dehydrated in ascending ethanol and propylene oxide, and flat-embedded and polymerized in Durcupan ACM (EMS14040). 70 nm ultrathin sections were cut on Leica ultramicrotome, and the images were collected on transmission electron microscope (FEI). The analysis was carried out in a blinded manner.
3TC and NEV treatment of the mice
Lamivudine (Selleckchem, S1706) and nevirapine (Selleckchem, S1742) were dissolved in PBS at the concentration of 2 mg/ml and 1 mg/ml, respectively, and 100 μl solution was given to the mice with oral gavage daily (200 μg/day and 100 μg/day, respectively) for 4 weeks, starting from 4-week of age and up to 8-wk of age. On the next day of the final treatment, the mice were evaluated for ataxia scoring and rotarod tests, euthanized, and the cerebella were collected for experiments.
Quantification and statistical analysis
Statistical analyses were performed by unpaired two-sided t-test, Mann-Whitney test, One-way ANOVA with Tukey’s post-hoc test, and Wilcoxon matched-pairs signed-rank test using GraphPad Prism 8, as described in each figure legend. Values were initially determined to be suitable for parametric analysis according to normality and homoscedasticity, and an appropriate test was chosen accordingly which is designated in each figure legend. Exact values of N, and what N represents, can be found in each figure legend. Data are expressed as means ± SEM. In all tests, differences were considered statistically significant for a p-value of < 0.05.
Supplementary Material
Key resources table.
| REAGENT or RESOURCE | SOURCE | IDENTIFIER |
|---|---|---|
| Antibodies | ||
| Mouse anti-γH2AX antibody | Cell signaling | Cat# 9718, RRID: AB_2118009 |
| Mouse anti-Calbindin | Abcam | Cat# ab82812, RRID: RRID:AB_1658451 |
| Chicken anti-GFAP antibody | Thermo Fisher | Cat# PA1-10004, RRID:AB_1074620 |
| Rabbit anti-BiP antibody | Cell signaling | Cat# 3177, RRID:AB_2119845 |
| Rabbit anti-Cas9 antibody | Diagenode | Cat# C15310258, RRID:AB_2715516 |
| Rabbit anti-Cas9 antibody | Cell signaling | Cat# #19526, RRID:AB_2798820 |
| Rabbit anti-mouse LINE-1 Orf1p | Abcam | Cat# ab216324, RRID:AB_2921327 |
| Mouse anti-GAPDH, HRP | GeneTex | Cat# GTX627408, RRID:AB_2888014 |
| Rabbit anti-IP3 Receptor 1 | Thermo Fisher | Cat# PA1-901, RRID:AB_2129984 |
| Mouse anti-ssDNA | Millipore | Cat# MAB3299, RRID:AB_94795 |
| Mouse anti-beta Actin | Abcam | Cat# ab8226, RRID:AB_306371 |
| Goat anti-Rabbit IgG, HRP | Cell Signaling | Cat# 7074, RRID:AB_2099233 |
| Horse anti-Mouse IgG, HRP | Cell Signaling | Cat# 7076, RRID:AB_330924 |
| Goat anti-Mouse IgG Alexa Fluor 488 | Thermo Fisher | Cat# A11029, RRID:AB_2534088 |
| Goat anti-Chicken IgY Alexa Fluor 555 | Thermo Fisher | Cat# A32932, RRID:AB_2762844 |
| Donkey anti-Rabbit IgG Alexa Fluor 647 | Thermo Fisher | Cat# A31573, RRID:AB_2536183 |
| Bacterial and virus strains | ||
| lentiMPH v2 | Joung et al. 2017 | Addgene #89308 |
| lenti dCAS-VP64_Blast | Konermann et al. 2015 | Addgene #61425 |
| sgRNA(MS2) cloning backbone | Konermann et al. 2015 | Addgene #61424 |
| lentiSAM v2 | Joung et al. 2017 | Addgene #75112 |
| Biological samples | ||
| Frozen postmortem human cerebellar tissues | NIH neurobiobank., Demographic information can be found in Table S1 | https://neurobiobank.nih.gov/ |
| Chemicals, peptides, and recombinant proteins | ||
| Lipofectamine 3000 | ThermoFisher | Cat# L3000075 |
| PhosSTOP phosphatase inhibitor | Roche | Cat# 4906837001 |
| cOmplete ULTRA mini protease inhibitor | Roche | Cat# 5892791001 |
| Dako Target Retrieval Solution | Agilent | Cat# S169984-2 |
| LIVE/DEAD fixable aqua dead cell stain kit | ThermoFisher | Cat# L34957 |
| BbsI | New England Biolabs | Cat# R0539 |
| BsmBI | New England Biolabs | Cat# R0580 |
| AflIII | New England Biolabs | Cat# R0541 |
| Xbal | New England Biolabs | Cat# R0145 |
| NEBuffer2.1 | New England Biolabs | Cat# B7202S |
| NEBuffer3.1 | New England Biolabs | Cat# B7203S |
| T4 DNA ligase | New England Biolabs | Cat# M0202S |
| T4 polynucleotide kinase | New England Biolabs | Cat# M0201S |
| T4 DNA ligase reaction buffer | New England Biolabs | Cat# B0202S |
| Tissue-Tek O.C.T. Compound | Sakura Finetek | Cat# 4583 |
| Durcupan ACM | Millipore Sigma | Cat# 44610-1EA |
| Hygromycin-B | InvivoGen | Cat# ant-hg-1 |
| Blasticidin | Thermo Fisher | Cat# A1113903 |
| Puromycin | Millipore Sigma | Cat# P8833 |
| Normal donkey serum | Jackson ImmunoResearch | Cat# 017-000-121 |
| Lamivudine | Selleckchem | Cat# S1706 |
| Nevirapine | Selleckchem | Cat# S1742 |
| DAPI | Millipore Sigma | Cat# MBD0015 |
| RNase A | Thermo | Cat# EN0531 |
| Critical commercial assays | ||
| Rneasy Mini Kit | QIAGEN | Cat# 74106 |
| iTaq Universal SYBR Green Supermix | Bio-rad | Cat# 172-5124 |
| QIAprep Spin Miniprep Kit | QIAGEN | Cat# 27104 |
| QIAquick Gel Extraction Kit | QIAGEN | Cat# 28704 |
| QuantiTect Reverse Transcription Kit | QIAGEN | Cat# 205311 |
| NEBNext Ultra II RNA Library Prep Kit for Illumina | New England Biolabs | Cat# E7770L |
| NEBNext Poly(A) mRNA Magnetic Isolation Module | New England Biolabs | Cat# E7490S |
| Takara LA Taq polymerase with GC buffer | Takara Bio | Cat# RR02AG |
| Zero Blunt TOPO PCR Cloning Kit | Thermo Fisher | Cat# 450159 |
| SuperSignal West Pico PLUS Chemiluminescent Substrate | Thermo Fisher | Cat# 34577 |
| EndoFree Plasmid Maxi Kit | QIAGEN | Cat# 12362 |
| ProLong Gold Antifade Mountant | Thermo Fisher | Cat# P36930 |
| Deposited Data | ||
| LINE-1 CRISPRa NIH3T3 cells RNA-seq | This study | NCBI Gene Expression Omnibus, GSE175774 |
| AT patients and control individuals cerebellar vermis RNA-seq | This study | NCBI Gene Expression Omnibus, GSE175776 |
| Experimental models: Cell lines | ||
| NIH/3T3 | ATCC | Cat# CRL-1658 |
| Experimental models: Organisms/strains | ||
| Mouse: C57BL/6J | Jackson laboratory | stock #000664 |
| Mouse: B6;D2-Gm33925Tn(pb-CAG-cas9*,-EGFP)1Yangh/J | Jackson laboratory | stock #031645 |
| Mouse: scramble sgRNA Transgenic mice (Scr_sgRNA mice) | This study | N/A |
| Mouse: LINE-1 sgRNA Transgenic mice (L1_sgRNA mice) | This study | N/A |
| Mouse: B6.129-Tg(Pcp2-cre)2Mpin/J | Jackson laboratory | stock #004146 |
| Oligonucleotides | ||
| qPCR primers, see Table S3 | This study | N/A |
| sgRNA sequence, see Table S3 | This study | N/A |
| Recombinant DNA | ||
| pX330-U6-Chimeric_BB-CBh-hSpCas9 | Cong et al. 2013 | Addgene #42230 |
| Software and algorithms | ||
| R version 4.0.5 | R Foundation | https://www.r-project.org/ |
| STAR | Dobin et al., 2013 | https://github.com/alexdobin/STAR |
| Repenrich | Criscione et al., 2014 | https://github.com/nskvir/RepEnrich |
| ERV mapping script | Tokuyama et al., 2018 | N/A |
| DEseq2 | Love et al., 2014 | https://bioconductor.org/packages/release/bioc/html/DESeq2.html |
| BEDTools | Quinlan and Hall, 2010 | https://bedtools.readthedocs.io/en/latest/ |
| GraphPad Prism 8 | GraphPad Software | https://www.graphpad.com/ |
| AxoGraph X | AxoGraph | https://axograph.com/ |
| Igor Pro | WaveMetrics | https://www.wavemetrics.com/ |
| GSEA | Subramanian et al., 2005, Mootha et al., 2003 | https://www.gsea-msigdb.org/gsea/index.jsp |
| DAVID | Huang da et al, 2009 | https://david.ncifcrf.gov/ |
| Spike2 | Cambridge Electronic Design | http://ced.co.uk/ |
| L1_sgRNA targeting genomic locus mapping script | This study | http://graphics.med.yale.edu/pattern/ |
| Other | ||
Highlights:
LINE-1 is significantly upregulated in ataxia-telangiectasia patients’ cerebella.
Targeted activation of LINE-1 in cerebellar Purkinje cells in mice caused ataxia.
Purkinje cells in diseased mice showed prominent signs of ER stress and DNA damage.
Treatment with reverse transcriptase inhibitor attenuated disease progression.
ACKNOWLEDGEMENTS
We thank Melissa Linehan and Huiping Dong for technical assistance. We thank Dr. William Philbrick and Dr. Timothy Nottoli at Yale Genome Editing Center for the assistance in generating Tg mice. Human tissue was obtained from the NIH Neurobiobank at the University of Maryland, Baltimore, MD. This work was supported by the Howard Hughes Medical Institute (A.I.), National Institutes of Health (NIH) grants R01 NS111242 (A.I. and L.K.K.), R01 AG067329, R01 052005 and P01 AG051459 (T.L.H.), the Uehara Memorial Foundation (T.T.), and the Japan Society for the Promotion of Science (T.T.).
Footnotes
DECLARATION OF INTERESTS
The authors declare no competing interests.
Publisher's Disclaimer: This is a PDF file of an unedited manuscript that has been accepted for publication. As a service to our customers we are providing this early version of the manuscript. The manuscript will undergo copyediting, typesetting, and review of the resulting proof before it is published in its final form. Please note that during the production process errors may be discovered which could affect the content, and all legal disclaimers that apply to the journal pertain.
REFERENCES
- Bezprozvanny I (2009). Calcium signaling and neurodegenerative diseases. Trends Mol Med 15, 89–100. [DOI] [PMC free article] [PubMed] [Google Scholar]
- Blaudin de The FX, Rekaik H, Peze-Heidsieck E, Massiani-Beaudoin O, Joshi RL, Fuchs J, and Prochiantz A (2018). Engrailed homeoprotein blocks degeneration in adult dopaminergic neurons through LINE-1 repression. EMBO J 37. [DOI] [PMC free article] [PubMed] [Google Scholar]
- Castro-Diaz N, Ecco G, Coluccio A, Kapopoulou A, Yazdanpanah B, Friedli M, Duc J, Jang SM, Turelli P, and Trono D (2014). Evolutionally dynamic L1 regulation in embryonic stem cells. Genes Dev 28, 1397–1409. [DOI] [PMC free article] [PubMed] [Google Scholar]
- Cheung AF, Dupage MJ, Dong HK, Chen J, and Jacks T (2008). Regulated expression of a tumor-associated antigen reveals multiple levels of T-cell tolerance in a mouse model of lung cancer. Cancer Res 68, 9459–9468. [DOI] [PMC free article] [PubMed] [Google Scholar]
- Cong L, Ran FA, Cox D, Lin S, Barretto R, Habib N, Hsu PD, Wu X, Jiang W, Marraffini LA, et al. (2013). Multiplex genome engineering using CRISPR/Cas systems. Science 339, 819–823. [DOI] [PMC free article] [PubMed] [Google Scholar]
- Consalez GG, Goldowitz D, Casoni F, and Hawkes R (2020). Origins, Development, and Compartmentation of the Granule Cells of the Cerebellum. Front Neural Circuits 14, 611841. [DOI] [PMC free article] [PubMed] [Google Scholar]
- Coufal NG, Garcia-Perez JL, Peng GE, Marchetto MC, Muotri AR, Mu Y, Carson CT, Macia A, Moran JV, and Gage FH (2011). Ataxia telangiectasia mutated (ATM) modulates long interspersed element-1 (L1) retrotransposition in human neural stem cells. Proc Natl Acad Sci U S A 108, 20382–20387. [DOI] [PMC free article] [PubMed] [Google Scholar]
- Criscione SW, Zhang Y, Thompson W, Sedivy JM, and Neretti N (2014). Transcriptional landscape of repetitive elements in normal and cancer human cells. BMC Genomics 15, 583. [DOI] [PMC free article] [PubMed] [Google Scholar]
- D’Arcangelo G, Miao GG, Chen SC, Soares HD, Morgan JI, and Curran T (1995). A protein related to extracellular matrix proteins deleted in the mouse mutant reeler. Nature 374, 719–723. [DOI] [PubMed] [Google Scholar]
- Dai L, Huang Q, and Boeke JD (2011). Effect of reverse transcriptase inhibitors on LINE-1 and Ty1 reverse transcriptase activities and on LINE-1 retrotransposition. BMC Biochem 12, 18. [DOI] [PMC free article] [PubMed] [Google Scholar]
- De Cecco M, Ito T, Petrashen AP, Elias AE, Skvir NJ, Criscione SW, Caligiana A, Brocculi G, Adney EM, Boeke JD, et al. (2019). L1 drives IFN in senescent cells and promotes age-associated inflammation. Nature 566, 73–78. [DOI] [PMC free article] [PubMed] [Google Scholar]
- De Zeeuw CI, Hoebeek FE, and Schonewille M (2008). Causes and consequences of oscillations in the cerebellar cortex. Neuron 58, 655–658. [DOI] [PubMed] [Google Scholar]
- Dobin A, Davis CA, Schlesinger F, Drenkow J, Zaleski C, Jha S, Batut P, Chaisson M, and Gingeras TR (2013). STAR: ultrafast universal RNA-seq aligner. Bioinformatics 29, 15–21. [DOI] [PMC free article] [PubMed] [Google Scholar]
- Erdal E, Haider S, Rehwinkel J, Harris AL, and McHugh PJ (2017). A prosurvival DNA damage-induced cytoplasmic interferon response is mediated by end resection factors and is limited by Trex1. Genes Dev 31, 353–369. [DOI] [PMC free article] [PubMed] [Google Scholar]
- Feschotte C (2008). Transposable elements and the evolution of regulatory networks. Nat Rev Genet 9, 397–405. [DOI] [PMC free article] [PubMed] [Google Scholar]
- Fowler BJ, Gelfand BD, Kim Y, Kerur N, Tarallo V, Hirano Y, Amarnath S, Fowler DH, Radwan M, Young MT, et al. (2014). Nucleoside reverse transcriptase inhibitors possess intrinsic anti-inflammatory activity. Science 346, 1000–1003. [DOI] [PMC free article] [PubMed] [Google Scholar]
- Franklin KBJ, and Paxinos G (2013). Paxinos and Franklin’s The mouse brain in stereotaxic coordinates, Fourth edition. edn (Amsterdam: Academic Press, an imprint of Elsevier). [Google Scholar]
- Fuentes DR, Swigut T, and Wysocka J (2018). Systematic perturbation of retroviral LTRs reveals widespread long-range effects on human gene regulation. Elife 7. [DOI] [PMC free article] [PubMed] [Google Scholar]
- Gorbunova V, Seluanov A, Mita P, McKerrow W, Fenyo D, Boeke JD, Linker SB, Gage FH, Kreiling JA, Petrashen AP, et al. (2021). The role of retrotransposable elements in ageing and age-associated diseases. Nature 596, 43–53. [DOI] [PMC free article] [PubMed] [Google Scholar]
- Guyenet SJ, Furrer SA, Damian VM, Baughan TD, La Spada AR, and Garden GA (2010). A simple composite phenotype scoring system for evaluating mouse models of cerebellar ataxia. J Vis Exp. [DOI] [PMC free article] [PubMed] [Google Scholar]
- Hetz C, Zhang K, and Kaufman RJ (2020). Mechanisms, regulation and functions of the unfolded protein response. Nat Rev Mol Cell Biol 21, 421–438. [DOI] [PMC free article] [PubMed] [Google Scholar]
- Hisatsune C, and Mikoshiba K (2017). IP3 receptor mutations and brain diseases in human and rodents. J Neurochem 141, 790–807. [DOI] [PubMed] [Google Scholar]
- Huang da W, Sherman BT, and Lempicki RA (2009). Systematic and integrative analysis of large gene lists using DAVID bioinformatics resources. Nat Protoc 4, 44–57. [DOI] [PubMed] [Google Scholar]
- Jacob-Hirsch J, Eyal E, Knisbacher BA, Roth J, Cesarkas K, Dor C, Farage-Barhom S, Kunik V, Simon AJ, Gal M, et al. (2018). Whole-genome sequencing reveals principles of brain retrotransposition in neurodevelopmental disorders. Cell Res 28, 187–203. [DOI] [PMC free article] [PubMed] [Google Scholar]
- Jonsson ME, Garza R, Johansson PA, and Jakobsson J (2020). Transposable Elements: A Common Feature of Neurodevelopmental and Neurodegenerative Disorders. Trends Genet 36, 610–623. [DOI] [PubMed] [Google Scholar]
- Jonsson ME, Garza R, Sharma Y, Petri R, Sodersten E, Johansson JG, Johansson PA, Atacho DA, Pircs K, Madsen S, et al. (2021). Activation of endogenous retroviruses during brain development causes an inflammatory response. EMBO J 40, e106423. [DOI] [PMC free article] [PubMed] [Google Scholar]
- Jonsson ME, Ludvik Brattas P, Gustafsson C, Petri R, Yudovich D, Pircs K, Verschuere S, Madsen S, Hansson J, Larsson J, et al. (2019). Activation of neuronal genes via LINE-1 elements upon global DNA demethylation in human neural progenitors. Nat Commun 10, 3182. [DOI] [PMC free article] [PubMed] [Google Scholar]
- Joung J, Konermann S, Gootenberg JS, Abudayyeh OO, Platt RJ, Brigham MD, Sanjana NE, and Zhang F (2017). Genome-scale CRISPR-Cas9 knockout and transcriptional activation screening. Nat Protoc 12, 828–863. [DOI] [PMC free article] [PubMed] [Google Scholar]
- Kazazian HH Jr., and Moran JV (2017). Mobile DNA in Health and Disease. N Engl J Med 377, 361–370. [DOI] [PMC free article] [PubMed] [Google Scholar]
- Konermann S, Brigham MD, Trevino AE, Joung J, Abudayyeh OO, Barcena C, Hsu PD, Habib N, Gootenberg JS, Nishimasu H, et al. (2015). Genome-scale transcriptional activation by an engineered CRISPR-Cas9 complex. Nature 517, 583–588. [DOI] [PMC free article] [PubMed] [Google Scholar]
- Kuljis RO, Xu Y, Aguila MC, and Baltimore D (1997). Degeneration of neurons, synapses, and neuropil and glial activation in a murine Atm knockout model of ataxia-telangiectasia. Proc Natl Acad Sci U S A 94, 12688–12693. [DOI] [PMC free article] [PubMed] [Google Scholar]
- Li W, Lee MH, Henderson L, Tyagi R, Bachani M, Steiner J, Campanac E, Hoffman DA, von Geldern G, Johnson K, et al. (2015). Human endogenous retrovirus-K contributes to motor neuron disease. Sci Transl Med 7, 307ra153. [DOI] [PMC free article] [PubMed] [Google Scholar]
- Liu EY, Russ J, Cali CP, Phan JM, Amlie-Wolf A, and Lee EB (2019). Loss of Nuclear TDP-43 Is Associated with Decondensation of LINE Retrotransposons. Cell Rep 27, 1409–1421 e1406. [DOI] [PMC free article] [PubMed] [Google Scholar]
- Liu ZW, Gan G, Suyama S, and Gao XB (2011). Intracellular energy status regulates activity in hypocretin/orexin neurones: a link between energy and behavioural states. J Physiol 589, 4157–4166. [DOI] [PMC free article] [PubMed] [Google Scholar]
- Liu ZW, and Gao XB (2007). Adenosine inhibits activity of hypocretin/orexin neurons by the A1 receptor in the lateral hypothalamus: a possible sleep-promoting effect. J Neurophysiol 97, 837–848. [DOI] [PMC free article] [PubMed] [Google Scholar]
- Love MI, Huber W, and Anders S (2014). Moderated estimation of fold change and dispersion for RNA-seq data with DESeq2. Genome Biol 15, 550. [DOI] [PMC free article] [PubMed] [Google Scholar]
- McQuin C, Goodman A, Chernyshev V, Kamentsky L, Cimini BA, Karhohs KW, Doan M, Ding L, Rafelski SM, Thirstrup D, et al. (2018). CellProfiler 3.0: Next-generation image processing for biology. PLoS Biol 16, e2005970. [DOI] [PMC free article] [PubMed] [Google Scholar]
- Middleton SJ, Racca C, Cunningham MO, Traub RD, Monyer H, Knopfel T, Schofield IS, Jenkins A, and Whittington MA (2008). High-frequency network oscillations in cerebellar cortex. Neuron 58, 763–774. [DOI] [PMC free article] [PubMed] [Google Scholar]
- Mikoshiba K (2007). IP3 receptor/Ca2+ channel: from discovery to new signaling concepts. J Neurochem 102, 1426–1446. [DOI] [PubMed] [Google Scholar]
- Muotri AR, Chu VT, Marchetto MC, Deng W, Moran JV, and Gage FH (2005). Somatic mosaicism in neuronal precursor cells mediated by L1 retrotransposition. Nature 435, 903–910. [DOI] [PubMed] [Google Scholar]
- Muotri AR, Marchetto MC, Coufal NG, Oefner R, Yeo G, Nakashima K, and Gage FH (2010). L1 retrotransposition in neurons is modulated by MeCP2. Nature 468, 443–446. [DOI] [PMC free article] [PubMed] [Google Scholar]
- Naas TP, DeBerardinis RJ, Moran JV, Ostertag EM, Kingsmore SF, Seldin MF, Hayashizaki Y, Martin SL, and Kazazian HH (1998). An actively retrotransposing, novel subfamily of mouse L1 elements. EMBO J 17, 590–597. [DOI] [PMC free article] [PubMed] [Google Scholar]
- Pereira GC, Sanchez L, Schaughency PM, Rubio-Roldan A, Choi JA, Planet E, Batra R, Turelli P, Trono D, Ostrow LW, et al. (2018). Properties of LINE-1 proteins and repeat element expression in the context of amyotrophic lateral sclerosis. Mob DNA 9, 35. [DOI] [PMC free article] [PubMed] [Google Scholar]
- Peze-Heidsieck E, Bonnifet T, Znaidi R, Ravel-Godreuil C, Massiani-Beaudoin O, Joshi RL, and Fuchs J (2021). Retrotransposons as a Source of DNA Damage in Neurodegeneration. Front Aging Neurosci 13, 786897. [DOI] [PMC free article] [PubMed] [Google Scholar]
- Playfoot CJ, Duc J, Sheppard S, Dind S, Coudray A, Planet E, and Trono D (2021). Transposable elements and their KZFP controllers are drivers of transcriptional innovation in the developing human brain. Genome Res 31, 1531–1545. [DOI] [PMC free article] [PubMed] [Google Scholar]
- Quinlan AR, and Hall IM (2010). BEDTools: a flexible suite of utilities for comparing genomic features. Bioinformatics 26, 841–842. [DOI] [PMC free article] [PubMed] [Google Scholar]
- Reilly MT, Faulkner GJ, Dubnau J, Ponomarev I, and Gage FH (2013). The role of transposable elements in health and diseases of the central nervous system. J Neurosci 33, 17577–17586. [DOI] [PMC free article] [PubMed] [Google Scholar]
- Robbez-Masson L, Tie CHC, Conde L, Tunbak H, Husovsky C, Tchasovnikarova IA, Timms RT, Herrero J, Lehner PJ, and Rowe HM (2018). The HUSH complex cooperates with TRIM28 to repress young retrotransposons and new genes. Genome Res 28, 836–845. [DOI] [PMC free article] [PubMed] [Google Scholar]
- Ron D, and Walter P (2007). Signal integration in the endoplasmic reticulum unfolded protein response. Nat Rev Mol Cell Biol 8, 519–529. [DOI] [PubMed] [Google Scholar]
- Saleh A, Macia A, and Muotri AR (2019). Transposable Elements, Inflammation, and Neurological Disease. Front Neurol 10, 894. [DOI] [PMC free article] [PubMed] [Google Scholar]
- Shiloh Y (2020). The cerebellar degeneration in ataxia-telangiectasia: A case for genome instability. DNA Repair (Amst) 95, 102950. [DOI] [PubMed] [Google Scholar]
- Shiloh Y, and Ziv Y (2013). The ATM protein kinase: regulating the cellular response to genotoxic stress, and more. Nat Rev Mol Cell Biol 14, 197–210. [PubMed] [Google Scholar]
- Simon M, Van Meter M, Ablaeva J, Ke Z, Gonzalez RS, Taguchi T, De Cecco M, Leonova KI, Kogan V, Helfand SL, et al. (2019). LINE1 Derepression in Aged Wild-Type and SIRT6-Deficient Mice Drives Inflammation. Cell Metab 29, 871–885 e875. [DOI] [PMC free article] [PubMed] [Google Scholar]
- Sohal VS, Zhang F, Yizhar O, and Deisseroth K (2009). Parvalbumin neurons and gamma rhythms enhance cortical circuit performance. Nature 459, 698–702. [DOI] [PMC free article] [PubMed] [Google Scholar]
- Somogyi P, and Takagi H (1982). A note on the use of picric acid-paraformaldehyde-glutaraldehyde fixative for correlated light and electron microscopic immunocytochemistry. Neuroscience 7, 1779–1783. [DOI] [PubMed] [Google Scholar]
- Sookdeo A, Hepp CM, McClure MA, and Boissinot S (2013). Revisiting the evolution of mouse LINE-1 in the genomic era. Mob DNA 4, 3. [DOI] [PMC free article] [PubMed] [Google Scholar]
- Sulkowski PL, Corso CD, Robinson ND, Scanlon SE, Purshouse KR, Bai H, Liu Y, Sundaram RK, Hegan DC, Fons NR, et al. (2017). 2-Hydroxyglutarate produced by neomorphic IDH mutations suppresses homologous recombination and induces PARP inhibitor sensitivity. Sci Transl Med 9. [DOI] [PMC free article] [PubMed] [Google Scholar]
- Sulkowski PL, Sundaram RK, Oeck S, Corso CD, Liu Y, Noorbakhsh S, Niger M, Boeke M, Ueno D, Kalathil AN, et al. (2018). Krebs-cycle-deficient hereditary cancer syndromes are defined by defects in homologous-recombination DNA repair. Nat Genet 50, 1086–1092. [DOI] [PMC free article] [PubMed] [Google Scholar]
- Thomas CA, Tejwani L, Trujillo CA, Negraes PD, Herai RH, Mesci P, Macia A, Crow YJ, and Muotri AR (2017). Modeling of TREX1-Dependent Autoimmune Disease using Human Stem Cells Highlights L1 Accumulation as a Source of Neuroinflammation. Cell Stem Cell 21, 319–331 e318. [DOI] [PMC free article] [PubMed] [Google Scholar]
- Tokuyama M, Gunn BM, Venkataraman A, Kong Y, Kang I, Rakib T, Townsend MJ, Costenbader KH, Alter G, and Iwasaki A (2021). Antibodies against human endogenous retrovirus K102 envelope activate neutrophils in systemic lupus erythematosus. J Exp Med 218. [DOI] [PMC free article] [PubMed] [Google Scholar]
- Tokuyama M, Kong Y, Song E, Jayewickreme T, Kang I, and Iwasaki A (2018). ERVmap analysis reveals genome-wide transcription of human endogenous retroviruses. Proc Natl Acad Sci U S A 115, 12565–12572. [DOI] [PMC free article] [PubMed] [Google Scholar]
- Treger RS, Pope SD, Kong Y, Tokuyama M, Taura M, and Iwasaki A (2019). The Lupus Susceptibility Locus Sgp3 Encodes the Suppressor of Endogenous Retrovirus Expression SNERV. Immunity 50, 334–347 e339. [DOI] [PMC free article] [PubMed] [Google Scholar]
- Zarrei M, Fehlings DL, Mawjee K, Switzer L, Thiruvahindrapuram B, Walker S, Merico D, Casallo G, Uddin M, MacDonald JR, et al. (2018). De novo and rare inherited copy-number variations in the hemiplegic form of cerebral palsy. Genet Med 20, 172–180. [DOI] [PMC free article] [PubMed] [Google Scholar]
- Zhang H, Zeng L, Xie M, Liu J, Zhou B, Wu R, Cao L, Kroemer G, Wang H, Billiar TR, et al. (2020). TMEM173 Drives Lethal Coagulation in Sepsis. Cell Host Microbe 27, 556–570 e556. [DOI] [PMC free article] [PubMed] [Google Scholar]
- Zhou H, Liu J, Zhou C, Gao N, Rao Z, Li H, Hu X, Li C, Yao X, Shen X, et al. (2018). In vivo simultaneous transcriptional activation of multiple genes in the brain using CRISPR-dCas9-activator transgenic mice. Nat Neurosci 21, 440–446. [DOI] [PubMed] [Google Scholar]
Associated Data
This section collects any data citations, data availability statements, or supplementary materials included in this article.
Supplementary Materials
Data Availability Statement
The RNA-seq datasets in this paper have been deposited in the Gene Expression Omnibus (GEO) database with accession numbers GSE175774 for LINE-1 CRISPRa NIH3T3 cells and control cells and GSE175776 for human cerebellum samples, respectively.
The codes originated in this study for the mapping of L1_sgRNA target site in the mouse genome can be found at http://graphics.med.yale.edu/pattern/ and are publicly available.
Any additional information required to reanalyze the data reported in this work paper is available from the Lead Contact upon request.