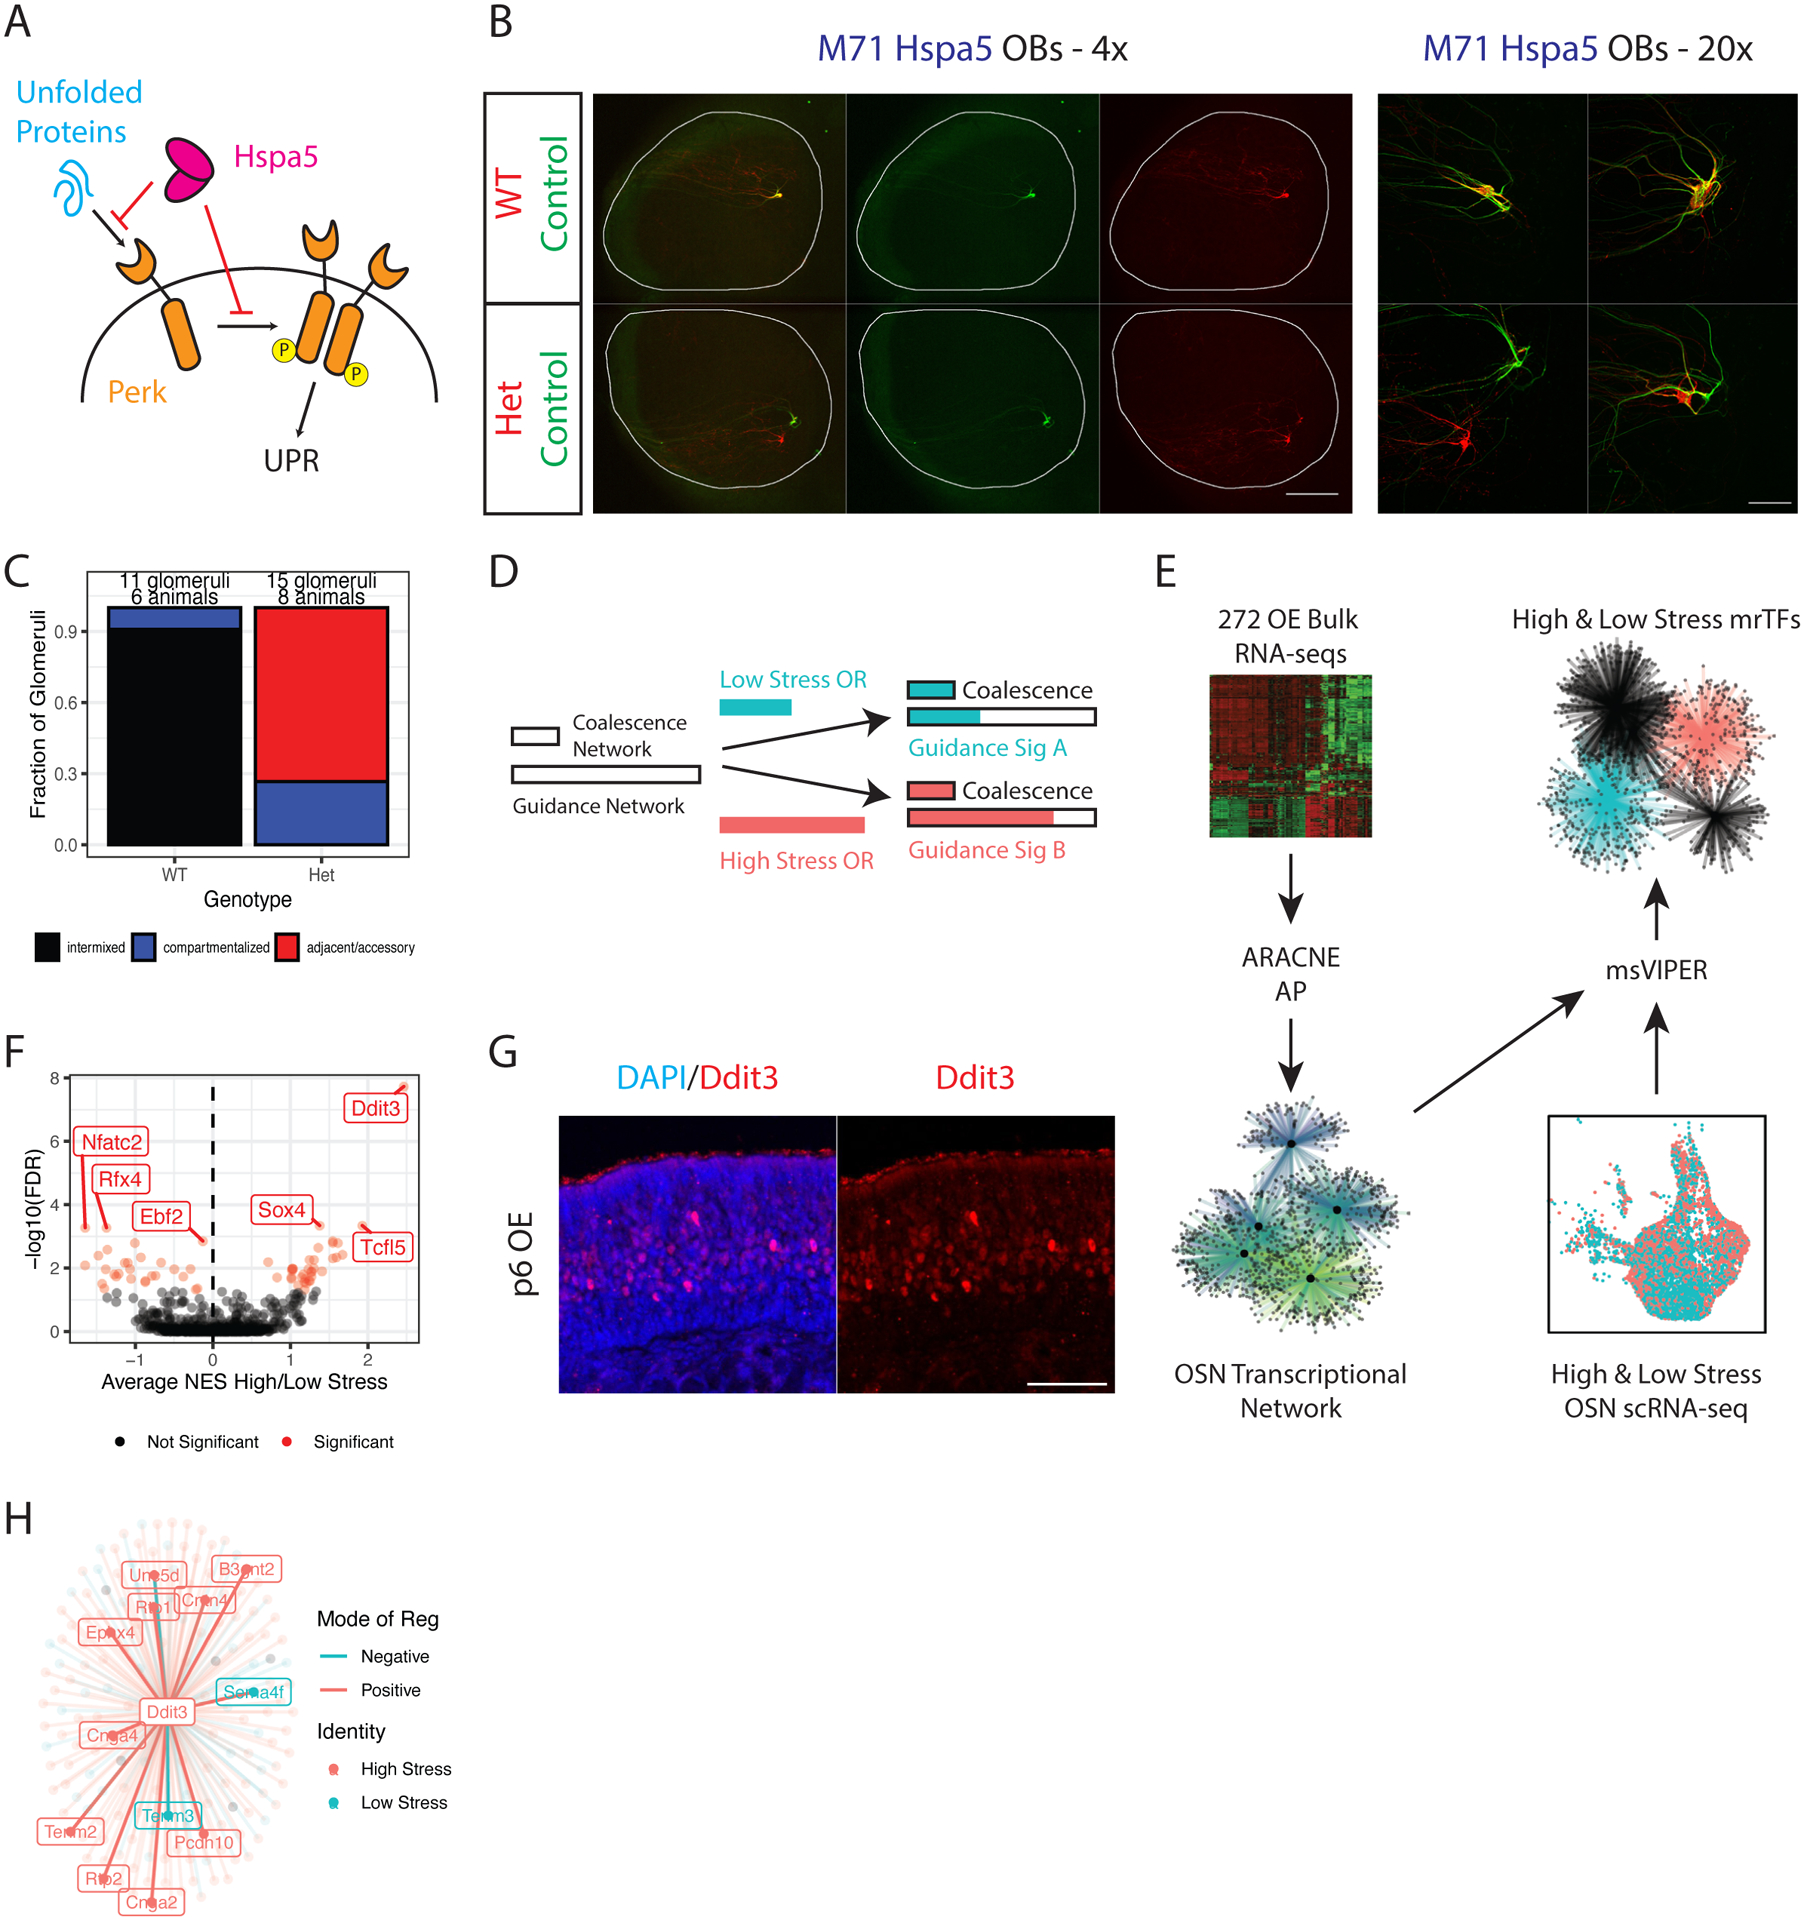
Figure 5. Network reconstruction predicts that Ddit3 controls UPR-responsive axon guidance.

(A) Schematic of PERK activation by unfolded proteins, and the inhibition of the UPR by HSPA5.
(B) Whole mount OB views of M71 Hspa5 mice at p5. Internal control axons in green, experimental axons in red. Magnification as indicated, A = anterior, P = posterior. Scale bars 500μm (4x), 100μm (20x). See also Supplemental Figure S6A.
(C) Blinded quantification of glomerular configurations in the OB of p5 M71 Hspa5 mice, grouped by genotype of the tdtomato+ cells.
(D) Depiction of the role for the UPR in glomerular coalescence and axon guidance. Two UPR responsive networks are proposed with different saturation thresholds (indicated by length of empty bars). A low stress (blue bar) and high stress OR (red bar) both induce enough UPR to saturate the coalescence network, but differentially activate the guidance network.
(E) Schematic of the in silico analysis to identify master regulators of the proposed OSN axon guidance network. 272 RNA-seq libraries from various OSN populations and experimental conditions were input into ARACNE-AP to reconstruct an OSN transcriptional network. The network was input to msVIPER along with scRNA-seq data from high and low stress OSNs to identify UPR-dependent master regulator transcription factors (mrTFs).
(F) msVIPER identifies differentially active mrTFs between high and low stress OSNs. The x axis shows the weighted average of normalized enrichment scores (NES) in high vs low stress OSNs across all zones. The y axis shows the −log10 false discovery rate (FDR) derived from Stouffer integrating msVIPER p values for high/low stress comparisons across all zones and correcting for multiple testing of all TFs. Weights were set as the square root of the number of OSNs in each zone. Significant mrTFs are shown in red, top mrTFs labeled.
(G) Representative IF for DDIT3 in MOE sections of wild type mice at p6. Scale bar 50μm.
(H) Representation of the Ddit3 regulon (genes that the ARACNE-AP algorithm infers are controlled by Ddit3). Points (and labels) for each gene are colored by whether that gene is differentially expressed in high stress OSNs (red) or low stress OSNs (blue) in our scRNA-seq dataset. Connecting line colors denote mode of regulation (blue = negative, red = positive).
