

Abstract
Objective:
Iron accumulation is emerging as a player in aging-related disorders due to its propensity for generating reactive oxygen species (ROS). Studies investigating the role of iron in the pathogenesis of primary osteoarthritis (OA) are limited. We designed a proof-of-principle study to determine the effect of systemic iron deficiency, via an iron deficient diet, on knee OA in an animal model.
Methods:
Twelve-week-old male Hartley guinea pigs received the standard diet (n=6) or a diet devoid of iron (n=6) for 19-weeks. Iron levels were determined in the serum, liver, and articular cartilage. Knees were collected to assess structural changes related to OA (microcomputed tomography, histopathology). Immunohistochemistry was performed to evaluate the presence and distribution of a disintegrin and metalloproteinase with thrombospondin motifs 4 (ADAMTS4) and ROS-driven 4-hydroxynonenal (4-HNE)-induced protein adducts. Transcript expression was also assessed.
Results:
Relative to control animals, an iron deficient diet reduced the concentration of this mineral in serum, liver, and articular cartilage. Iron deficient animals had lower histologic OA scores; decreased subchondral bone mineral density was also noted. This reduction in knee joint pathology was accompanied by a decrease in: ADAMTS4 in synovium; and 4-HNE protein adducts from lipid peroxidation in both the menisci and articular cartilage of iron deficient animals. Expression of iron-related genes in these tissues was also altered in treated animals.
Conclusions:
Results from this study suggest that systemic iron levels may play a role in knee OA pathogenesis, with a short-term deficit in dietary iron reducing the severity of knee cartilage lesions.
Keywords: osteoarthritis, iron, aging, knee, guinea pig
Introduction.
Iron is an element critical to normal organismal function. Iron is used to synthesize hemoglobin for oxygen transport in mammals and has roles in oxidative phosphorylation and production of iron-sulfur clusters within mitochondria. Although essential for life, iron can induce tissue injury when present in excess amounts and/or improperly handled1 through participation in the reactive oxygen species (ROS)-producing Fenton and Haber-Weiss reactions2. Despite this potential for damage, there are no direct iron excretion mechanisms present in mammals other than normal desquamation of skin and gastrointestinal (GI) epithelium3. As such, progressive iron accumulation in tissues over time seems to be an inevitable process associated with aging. In fact, many chronic aging-related diseases have been linked to iron accrual4. Examples of such disorders include type II diabetes5, atherosclerosis6, neurodegenerative diseases7, and various cancers8. The potential for excess tissue iron is enhanced by dietary supplementation and regular consumption of foods containing large amounts of bioavailable iron, which are significantly associated with high iron stores in elderly humans9. Similarly, dietary administration of excess iron has been demonstrated to increase iron stores in laboratory animal studies10–11, suggesting that GI iron absorption can continue even after body iron stores are replete.
Surplus iron in joint tissues has long been linked to arthropathies associated with hereditary hemochromatosis12, rheumatoid arthritis (RA)13, and hemophilic arthropathy14. Indeed, studies have shown increased iron levels in cartilage, synovium, and synovial fluid in these conditions13,15–16. In vitro exposure of chondrocytes to iron increased the activity of matrix-degrading enzymes and release of sulfated glycosaminoglycans17. Additionally, iron can directly cause chondrocyte apoptosis by inducing hydroxyl radical formation14,18. Although iron has been studied in the arthropathies described above, its role in idiopathic, aging-associated osteoarthritis (OA) has not been well-explored.
Idiopathic/primary OA is a widespread, painful condition affecting millions across the globe19. While the mechanisms underlying primary OA development are poorly understood, advancing age has been identified as a significant risk factor. Because iron has been implicated in many other aging-related disorders, we postulate its accumulation in joint tissues may be contributing to the development of this type of OA. There are currently a select number of studies published on iron and OA in humans without genetic iron disorders. Indeed, enhanced iron deposition has been noted in the synovium of patients with OA20. A separate study documented that the synovial fluid from patients with knee OA had significantly higher concentrations of iron than both unaffected individuals and participants with RA21. Finally, a study by Nugzar et al. found that the abundance of serum ferritin, the major storage molecule for iron, correlated to the degree of cartilage degeneration in OA-affected knees independent of age, sex, and BMI22.
To investigate this intriguing link between iron and OA, we performed two proof-of-principle studies. First, we demonstrated that induction of systemic iron overload, via administration of iron dextran, resulted in early onset and worsened severity of OA in Strain 13 guinea pigs, which have decreased propensity for this disorder23. Here, we assessed the ability of systemic iron depletion, using an iron deficient diet, to prevent or delay the onset and/or progression of OA. For this, we hypothesized that consumption of an iron deficient diet would mitigate OA in disease-prone Dunkin-Hartley guinea pigs.
Materials and Methods.
Animals.
Procedures were approved by the institutional animal advisory committee and were performed in accordance with the NIH Guide for the Care and Use of Laboratory Animals. Sample size for this proof-of-principle work was determined from a pilot study focused on histologic assessment of OA as the primary outcome; secondary outcomes were not prioritized at this stage. Using a within group error of 0.50 with a detectable difference between means of 1.00, power associated with an alpha of 0.05 (two-sided) was calculated as 0.90 with a sample size of 6 animals per group. Twelve male Dunkin-Hartley guinea pigs were purchased from Charles River Laboratories (Wilmington, MA) at 8-weeks-of-age, allowed to acclimate for 2 weeks, and maintained in accredited housing facilities. Animals were kept individually in solid bottom cages and monitored daily by a veterinarian. Food, as described, and water were provided ad libitum.
Iron deficient and control diets.
Six animals each were randomly placed on either an iron deficient diet or sufficient (control) diet; randomization was done by alternating cage card numbers to assign animals to groups. Due to their fastidious nature, guinea pigs were transitioned from regular chow (Teklad Global Guinea Pig Diet #2040, Madison, WI) to the iron deficient or sufficient diet over 2 weeks through progressive mixing. Animals were fully switched to experimental diets at 12-weeks-of-age. Study diets were specially formulated from Harlan Teklad and were identical in composition apart from the iron content (Supplemental Figure S1). The iron sufficient diet contained 0.735 g/kg of ferric citrate. Conversely, the iron deficient diet was formulated without the addition of ferric citrate, with background levels of iron limited to ≤ 25 parts per million (ppm). Animals were fed these diets for 19 weeks; body weights were recorded weekly. Fleece material was used to prevent consumption of bedding, a common behavior of coprophagic guinea pigs, as all available bedding options contained high levels of iron (data not shown).
Specimen collection.
The study was terminated when animals were 31-weeks-of-age. Animals were placed under isoflurane anesthesia and whole blood was collected via direct cardiac puncture. Following fluid collection, anesthetized animals were immediately transferred to a carbon dioxide chamber for euthanasia. Complete blood count (CBC) was determined using the Advia 120 hematology analyzer (Siemens, Munich, Germany) (Supplemental Figure S2). Serum was separated from whole blood for biochemistry profiles, iron quantification using the Roche Cobas 6000 (Basel, Switzerland), and enzyme-linked immunosorbent assays (ELISAs) for monocyte chemoattractant protein 1 (MCP-1) and prostaglandin E2 (PGE2) (Kendall Scientific, Lincolnshire, IL). For the latter, technical triplicates from each sample were utilized and the kit performed according to manufacturer’s instructions. The liver from each animal was collected into 10% neutral buffered formalin (NBF) for 48 hours prior to iron quantification.
Hind limbs were removed at the coxofemoral joint; femur length was measured using digital calipers. Articular cartilage from the patella was isolated from the right knee, fixed in 10% NBF, and submitted for iron quantification. The left limb was placed into 10% NBF for 48 hours and then transferred to phosphate buffered saline (PBS) for microcomputed tomography (microCT). After microCT, the left knees were transferred to a 12.50% solution of ethylenediaminetetraacetic acid (pH 7.00) for decalcification and subsequent histologic evaluation.
Tissue iron quantification by atomic absorption spectroscopy (AAS).
Iron quantification (ppm dry weight) was performed on sections of liver and articular cartilage, as previously described23, using a Model 240 AA flame atomic absorption spectrometer and SpectrAA software (Agilent Technologies, Santa Clara, CA).
Microcomputed tomography of knee joints.
Knees were scanned in PBS using the Scanco microCT system (Scanco uCT80, Scanco Medical AG, Bruttisellen, Switzerland) with an isotropic voxel size of 18μm. Built-in software (Scanco Medical AG IPL v4.05, Bruttisellen, Switzerland) was used to evaluate bone volume fraction (BV/TV), trabecular number, trabecular thickness, trabecular spacing, and mean tissue mineral density (TMD) of bone. These parameters were measured in subchondral trabecular bone for the following regions of interest (ROI) in each animal: medial tibia, lateral tibia, medial femur, and lateral tibia. ROIs were drawn with the cylinder tool and avoided the physis and epiphyseal trabecular bone. Fifty image slices were used to create the femoral and tibial ROIs. Clinical features of OA were assessed by a veterinary radiologist (AJM) using a published scoring scheme24 with all tissue planes assessed via serial 2D stacks.
Histologic grading of osteoarthritis.
After decalcification, sagittal slices were made through the central plane of each knee to divide the joint into medial and lateral compartments. Samples were paraffin embedded and 5-micron sections were stained with toluidine blue for evaluation using the Osteoarthritis Research Society International (OARSI) recommended guidelines25. This semiquantitative histopathologic grading scheme is based on articular cartilage structure, proteoglycan content, cellularity, tidemark integrity, and osteophyte presence. Scores were performed in a blinded fashion by two independent pathologists (LBR and KSS) to evaluate OA changes in four sites: medial and lateral tibias; medial and lateral femurs. One slide from the medial and lateral compartment of each knee was considered, for a total of 2 slides assessed per animal. If present, discrepant scores were resolved prior to statistical analysis; scores from each of the 4 anatomic locations were assessed separately and summed to obtain a whole knee joint OA score for each guinea pig. A representative example of the histologic appearance of knee joints of male Hartley guinea pigs at 12-weeks-of-age is provided for comparison with animals at harvest (Supplemental Figure S3).
Immunohistochemistry of knee joints for ADAMTS4 and 4-hydroxynonenal adducts.
Immunohistochemistry (IHC) was performed on knee joints using rabbit polyclonal antibodies to a disintegrin and metalloproteinase with thrombospondin motifs 4 (ADAMTS4) (ab219548) and 4-hydroxynonenal (4-HNE) (ab46545, Abcam, Waltham, MA) at dilutions of 1.40 μg/mL and 2.70 μg/mL, respectively. Briefly, tissue sections were incubated in citrate buffer overnight at 55°C as recommended for skeletal tissues26. Slides were then exposed to the primary antibody overnight at 4°C, followed by incubation with a biotinylated goat anti-rabbit secondary antibody. Use of secondary antibody, alone, or immunoglobulin control did not result in positive immunostaining (data not shown). Sections were counterstained with hematoxylin, coverslipped, and viewed by light microscopy.
Immunostaining was graded using a previously published semiquantitative scoring scheme27. Briefly, the percentage of cells positively stained for either ADAMTS4 or 4-HNE adducts were determined and assigned a corresponding score between 0–5, with 0 being less than 5% of cells and/or extracellular matrix (ECM) with visible immunostaining and a score of 5 representing 75% or more of the cells and/or ECM with positive immunostaining27. Additional grading was based on intensity of staining and assigned a score ranging from 0–3, with 0 being minimal staining intensity and 3 being marked staining intensity27. As such, the maximum score obtainable for each structure was 8, or 16 when the medial femur and tibia were combined for a single articular cartilage score. The percentage of positive versus negative cells was also presented as a quantitative assessment of immunostaining.
Transcript expression analysis using NanoString technology.
As the nCounter Analysis System (Nanostring Technologies, Seattle, WA) can be used with formalin-fixed paraffin-embedded (FFPE) tissues, gene expression analysis was conducted on medial and lateral meniscus and articular cartilage in the FFPE knee joints remaining after histologic and IHC evaluation. Total RNA was isolated using the High Pure FFPET RNA Isolation Kit (Roche, Basel, Switzerland) with minor modifications to the standard protocol. 100.00 mg sections of tissue were deparaffinized and rehydrated per the kit instructions. Proteins were degraded with Proteinase K under incubation for 30 minutes at 85°C, with a subsequent incubation for 30 minutes at 30°C. RNA binding buffer was added, the suspension transferred to the purification column, and DNase treatment was performed. The resulting RNA was collected in elution buffer. Purified RNA was sent to University of Arizona Genetics Core (University of Arizona, Tucson, AZ) for analysis.
A custom set of guinea pig-specific probes was designed and manufactured by NanoString Technologies (Seattle, WA) and included the following target sequences (Supplemental Table S4): aggrecan (ACAN), ferritin heavy chain (FTH), transferrin receptor 1 (TFR1), ferroportin (SLC40A1; FPN), type II collagen (COL2A1), and matrix metalloproteinase-2 (MMP-2). Per initial RNA quantification (Invitrogen Qubit 2.0 Fluorometer and RNA High Sensitivity Assay Kit, Thermo Fisher Scientific, Waltham, MA) and Fragment Analyzer quality control subsets (Fragment Analyzer Automated CE System and High Sensitivity RNA Assay Kit, Agilent Technologies), the optimal amount of total RNA (800.00 ng) was hybridized with the custom code-set in an overnight incubation set to 65°C, followed by processing on the NanoString nCounter FLEX Analysis system. Results were reported as absolute transcript counts normalized to positive controls and two housekeeping genes, b-actin and eukaryotic translation elongation factor 1 alpha 1. Any potential sample input variance was corrected by use of the housekeeping genes and application of a sample-specific correction factor to all target probes. Data analysis was conducted using nSolver software (NanoString Technologies). FTH, TFR1, and FPN are presented in the manuscript proper; COL2A1, ACAN, and MMP-2 are provided in Supplemental Table S5.
Statistical analyses.
Rationale for excluding individual values from data sets were determined prior to analysis and included whether an appropriate sample was unable to be collected, did not pass quality control parameters, or if integrity was compromised. One animal in the control group did not have an appropriate tissue section available for histologic assessment of OA in the lateral compartment. As such, this animal was excluded from histologic assessment of OA in the lateral compartment and the whole joint OA score but included with medial compartment analyses. Additionally, one blood sample from the iron deficient diet group clotted and was unable to be used for CBC analysis. Exclusion of this sample resulted in n=5 animals from the iron deficient diet evaluated for hemogram parameters.
Statistical analyses were performed with GraphPad Prism 8.4.2 (La Jolla, California) with significance set at p≤0.05. Data underwent normality and variance testing with the Shapiro-Wilk and F-test, respectively. Normally distributed data with similar variance were compared using parametric t tests†. Data with normal distribution and significant differences in variance were compared via parametric t tests with Welch’s correction◊. Data sets that did not pass normality testing were compared using non-parametric Mann Whitney U tests×. Relationships between key outcomes were performed using Pearson’s correlations.
Results.
General description of animals.
Body weights of animals were similar throughout the study (Supplemental Figure S6). At the time of termination, mean total body weight was 1058.00 g for the control diet and 1054.00 g for the iron deficient diet (95% confidence interval [CI] −95.43, 87.77; p=0.9275). Femur lengths were also comparable, with a mean of 42.89 mm in controls and 42.72 mm in the iron deficient diet group (95% CI −1.49, 1.16; p=0.7849). CBC analysis suggested animals receiving the iron deficient diet had a relative decrease in hematocrit; however, reported values were not below published reference intervals (RIs) (Supplemental Figure S2). Red blood cells were, however, characterized as microcytic and hypochromic (Supplemental Figure S2). Animals receiving the iron deficient diet also had a statistical increase in platelets, although these values were still within designated RIs (Supplemental Figure S2). Collectively, these parameters fit with a classic hemogram appearance consistent with early/developing iron deficiency. Additional WBC and ELISA data and associated interpretations are presented in Supplemental Figure S2 and Supplemental Table S7, respectively.
Tissue iron quantification.
Relative to the control group, animals receiving the iron deficient diet had significantly lower circulating and systemic organ iron levels, as measured within serum (p<0.0001; Figure 1A) and liver (p=0.0022; Figure 1B), respectively. Reduced levels of iron were also observed within the knee environment, with treated animals having significantly lower articular cartilage iron concentration than controls (p=0.0260; Figure 1C).
Figure 1.
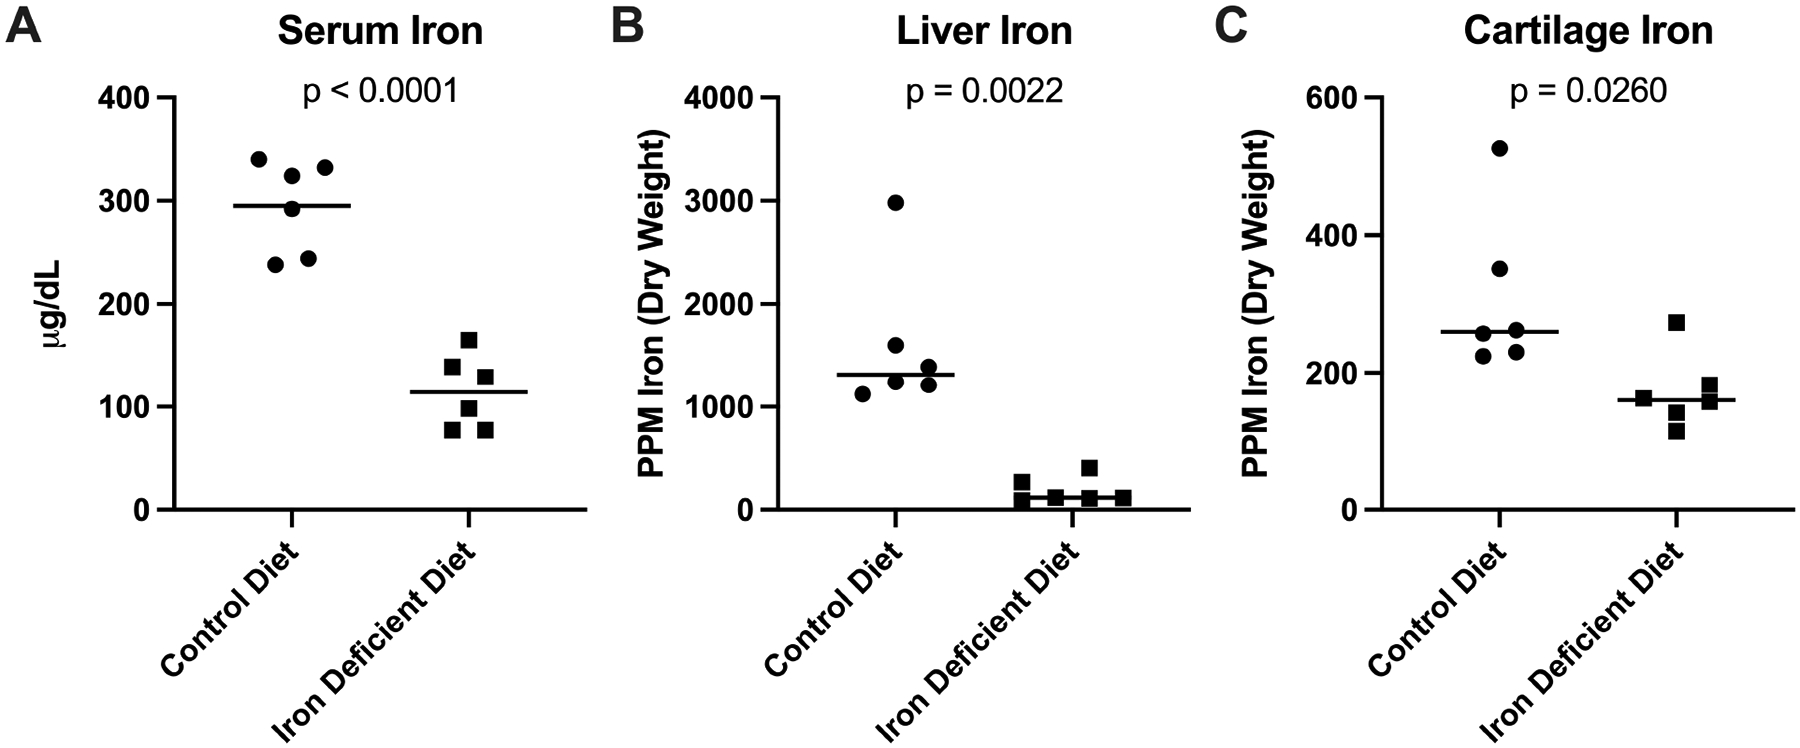
Tissue iron quantification. [A] Mean serum iron concentration† was 295.00 ug/mL in control animals (n=6) and 114.20 ug/mL in animals receiving the iron deficient diet (n=6; 180.80 ug/mL difference between means). [B] Median liver iron concentration× was 1315.00 ppm dry weight (n=6) in the control group and 117.00 ppm dry weight in the iron deficient diet group (n=6; −1198.00 ppm difference between medians). [C] Median iron concentration of knee articular cartilage× was 259.50 ppm in the control group (n=6) and 159.50 ppm in the iron deficient diet group (n=6; difference between medians of −100.00 ppm).
Quantitative microCT measurements.
Values for each of the quantitative microCT measurements are listed in Table 1. Significant differences between groups were noted for: trabecular number in the lateral tibia, trabecular thickness in the medial femur, and subchondral bone TMD in all regions evaluated. Specifically, animals receiving the iron deficient diet exhibited increased trabecular number in the lateral tibia and slightly decreased trabecular thickness in the medial femur. Interestingly, subchondral bone TMD was uniformly decreased in the iron deficient diet group for all tissue ROI (medial tibia, lateral tibia, medial femur, lateral femur) compared to controls. No differences were found for BV/TV or trabecular spacing.
Table 1.
Quantitative microCT data. Mean values (+/− 95% confidence intervals) from regions of interest in the subchondral trabecular bone of tibiae and femurs.
| Control Diet | Deficient Diet | Difference Between Means (Treated-Control) | P-value | ||
|---|---|---|---|---|---|
| Bone Volume/Total Volume | MT | 0.4525 (0.3867,0.5183) |
0.4606 (0.4094,0.5118) |
0.0081 (−0.0642,0.0804) |
0. 8075 |
| LT | 0.4269 (0.3811,0.4726) |
0.4563 (0.4195,0.4930) |
0.0294 (−0.0215,0.0803) |
0.2266 | |
| MF | 0.4962 (0.4439,0.5485) |
0.4560 (0.3982,0.5138) |
−0.0402 (−0.1078,0.0274) |
0.2147 | |
| LF | 0.4513 (0.4112,0.4914) |
0.4269 (0.3976,0.4561) |
−0.0244 (−0.0674,0.0186) |
0.2343 | |
| Trabecular Number (1/mm) | MT | 3.516 (3.190,3.843) |
3.671 (3.421,3.922) |
0.1548 (−0.2018,0.5114) |
0.3563 |
| LT | 3.498 (3,192,3.805) |
3.834 (3.622,4.046) |
0.3358 (0.0304,0.6412) |
0.0346 | |
| MF | 3.641 (3.300,3.982) |
3.417 (3.008,3.825) |
−0.2238 (−0.6849,0.2373) |
0. 3049 | |
| LF | 3.514 (2.353,3.675) |
3.406 (3.176,3.636) |
−0.1079 (−0.3512,0.1355) |
0. 3467 | |
| Trabecular Thickness (mm) | MT | 0.1351 (0.1205,0.1497) |
0.1346 (0.1261,0.1431) |
−0.0005 (−0.0151,0.0141 |
0. 9407 |
| LT | 0.1255 (0.1141,0.1368) |
0.1265 (0.1211,0.1319) |
0.0010 (−0.0098,0.0049) |
0. 8291 | |
| MF | 0.1432 (0.1324,0.1539) |
0.1331 (0.1289,0.1372) |
−0.0101 (−0.0190,−0.0012) |
0.0299 | |
| LF | 0.1359 (0.1179,0.1538) |
0.1312 (0.1171,0.1454) |
−0.0046 (−0.0244,0.0152) |
0.6143 | |
| Trabecular Spacing (mm) | MT | 0.2624 (0.2289,0.2958) |
0.2464 (0.2068,0.2860) |
−0.0159 (−0.0609,0.0290) |
0.4478 |
| LT | 0.2617 (0.2339,0.2896) |
0.2409 (0.2296,0.2521) |
−0.0208 (−0.0469,0.0052) |
0.1042 | |
| MF | 0.2248 (0.1881,0.2615) |
0.2491 (0.2131,0.2851) |
0.0243 (−0.0202,0.0688) |
0.2516 | |
| LF | 0.2425 (0.2269,0.2582) |
0.2509 (0.2256,0.2763) |
0.0084 (−0.01743,0.0343) |
0.4847 | |
| Bone Tissue Mineral Density (g/cm3) | MT | 921.0 (904.4,937.7) |
899.4 (883.5,915.3) |
−21.62 (−41.36,−1.88) |
0.0351 |
| LT | 918.6 (907.5,929.8) |
897.5 (878.9,916.0) |
−21.20 (−39.94,−2.45) |
0.0304 | |
| MF | 936.7 (912.1,961.2) |
911.4 (898.2,924.6) |
−25.31 (−49.48,−1.15) |
0.0418 | |
| LF | 949.5 (934.2,964.8) |
922.3 (897.7,946.9) |
−27.19 (−52.33,−2.06) |
0.0367 |
MT, medial tibia; LT, lateral tibia; MF, medial femur; LF, lateral femur; T, tibia; F, femur.
Histologic evaluation of knee joints.
Histologic grading25 demonstrated significantly lower whole joint OA scores for the iron deficient diet group compared to controls (p=0.0039; Figure 2A). This same pattern was present when medial and lateral compartments were considered separately (p=0.0315 and p<0.0001, respectively; Figure 3A–B). Representative photomicrographs demonstrating typical lesions seen in the medial compartment articular cartilage are shown in Figure 2. The representative image from a control animal demonstrates an area of severe proteoglycan loss extending to the deep zone of the tibial cartilage with regions of chondrocyte hypocellularity distributed throughout the ECM (Figure 2B). Conversely, the image from an iron deficient guinea pig shows a relatively normal tibial surface with mild proteoglycan loss in the superficial layer of tibial cartilage and chondrocytes distributed normally throughout the matrix (Figure 2C).
Figure 2.

Histologic evaluation of knee joints. [A] Mean whole joint OA score† was 24.00 in control animals (n=5) and 10.67 in iron deficient diet animals (n=6; −13.33 difference between means). One animal in the control group did not have an appropriate tissue section available for histologic assessment of the lateral compartment and was excluded from the whole joint OA score. [B] Representative histologic image of a control animal knee joint stained with toluidine blue (100X magnification; scale bar represents 50 μM). The representative control image shows an area of severe proteoglycan loss extending to the deep zone of the tibial cartilage and chondrocyte hypocellularity in areas throughout the ECM. [C] Representative histologic image of a knee joint from the iron deficient diet group stained with toluidine blue (100X magnification; scale bar represents 50 μM). The representative image from the treatment group depicts a relatively smooth tibial surface with mild proteoglycan loss in the superficial layer of tibial cartilage and chondrocytes distributed throughout the matrix.
Figure 3.
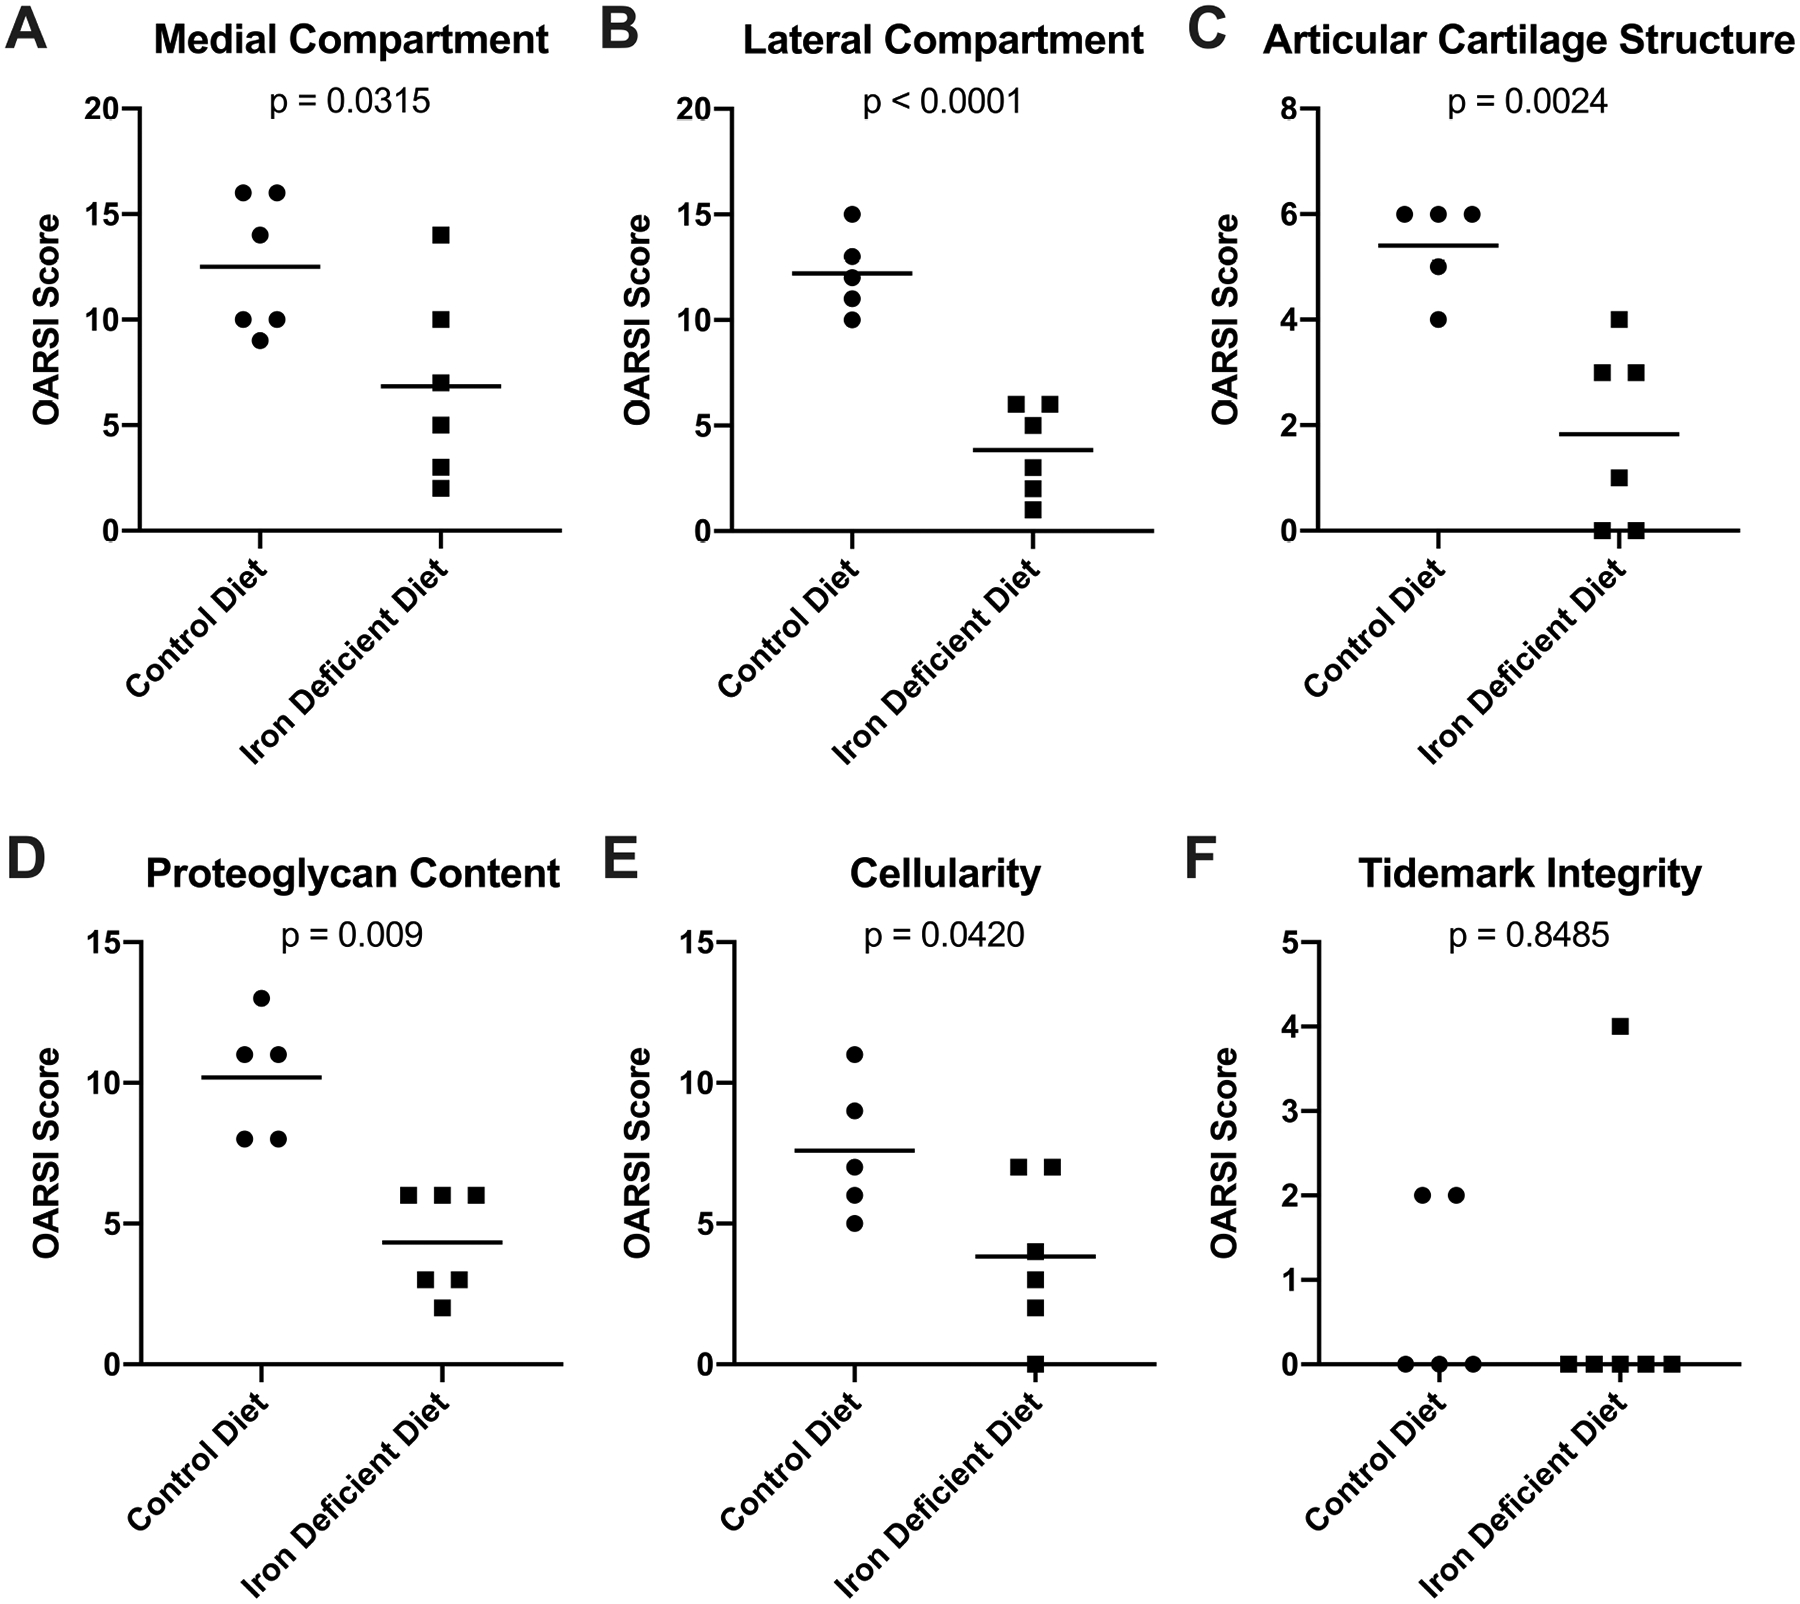
Contributions to the whole joint OA score. [A] Mean OARSI score in the medial compartment† of knee joints was 12.50 in the control group (n=6) and 6.83 in the iron deficient diet group (n=6; −5.67 difference between means). [B] Mean OARSI score in the lateral compartment† of knee joints was 12.20 in the control group (n=5) and 3.83 in the iron deficient diet group (n=6; −8.37 difference between means). [C] Mean whole joint OARSI score for the structure of knee articular cartilage† was 5.40 in the control group (n=5) and 1.83 in the iron deficient diet group (n=6; −3.57 difference between means). [D] Mean whole joint OARSI score for the proteoglycan content† of knee articular cartilage was 10.20 in the control group (n=5) and 4.33 in the iron deficient diet group (n=6; −5.87 difference between means). [E] Mean whole joint OARSI score for chondrocyte cellularity† in knee articular cartilage was 7.60 in the control group (n=5) and 3.83 in the iron deficient diet group (n=6; −3.77 difference between means). [F] Median whole joint OARSI score for tidemark integrity× was 0.00 in the control group (n=5) and 0.00 in the iron deficient diet group (n=6; 0.00 difference between medians). One animal in the control group did not have an appropriate tissue section available for histologic assessment of the lateral compartment and was excluded from the lateral compartment OA score and all components used to determine the whole joint OA score (Figure 3B–F).
Evaluation of the individual components of the OARSI scoring system revealed that animals receiving the iron deficient diet had significantly lower scores for articular cartilage structure (p=0.0024; Figure 3C), proteoglycan content of the ECM (p=0.0009; Figure 3D), and chondrocyte cellularity (p=0.0420; Figure 3E). There was no statistical difference between groups for tidemark integrity (p=0.8485; Figure 3F).
Immunohistochemistry for ADAMTS4.
While several members of this aggrecan-degrading family have a demonstrated association with OA28, ADAMTS4 was recently shown to be a key member that is significantly upregulated in OA synovium versus control tissue29 Immunostaining for ADAMTS4 was not present in either articular cartilage or menisci from any animal (data not shown). This enzyme was, however, distributed throughout the synovium. Specifically, animals receiving an iron deficient diet had significantly lower IHC scores in this tissue (p=0.0037; Figure 4A). Similarly, the percentage of cells positive for ADAMTS4 was also decreased (p=0.0152; Figure 4B). Representative images of ADAMTS4 staining in the proximal aspect of the synovium are provided (Figures 4C–D).
Figure 4.

Immunohistochemistry of ADAMTS4 protein adducts in the synovium. [A] The mean IHC score † for ADAMTS4 in synovial tissue was 7.08 in the control group (n=6) and 5.00 in the iron deficient diet group (n=6; −2.80 difference between means). The possible range of IHC scores for the synovium was 0.00–8.00. [B] The median percentage of cells positive × for ADAMTS4 in the synovium was 100.00% in the control group (n=6) and 53.92% in the iron deficient diet group (n=6; −46.08% difference between medians). [C] Representative image depicting the immunostaining of ADAMTS4 in the synovium from a control animal (200X magnification; scale bar represents 20 μM). [D] Representative image depicting the immunostaining of ADAMTS4 in the synovium from an iron deficient diet animal (200X magnification; scale bar represents 20 μM).
Immunohistochemistry of 4-hydroxynonenal-induced protein adducts.
4-HNE is a major product of ROS-induced lipid peroxidation that subsequently reacts with surrounding cellular structures such as proteins, creating adducts30. As lipid peroxidation is a major consequence of iron-mediated ROS30, we evaluated if altering systemic iron levels affected formation of 4-HNE-induced protein adducts within knee tissue. Animals receiving an iron deficient diet had significantly lower IHC scores, and therefore decreased immunostaining of 4-HNE adducts, in the meniscus (p<0.0001; Figure 5A) and articular cartilage (p=0.0271; Figure 6A). Congruently, the percentage of cells positive for 4-HNE adducts was decreased in the meniscus (p=0.0001; Figure 5B) and articular cartilage (p=0.0193; Figure 6B). Notably, the percentage of cells positive for 4-HNE adducts in the cartilage was significantly correlated with both the concentration of iron in knee articular cartilage (r=0.69, p=0.012) and the OARSI whole joint cellularity score (r=0.61, p=0.049). Representative images of 4-HNE adduct staining are provided (meniscus, Figures 5C–D; articular cartilage, Figures 6C–D).
Figure 5.

Immunohistochemistry of 4-hydroxynonenal-induced protein adducts in the meniscus. [A] The mean IHC score† for 4-HNE adducts in meniscal tissue was 6.50 in the control group (n=6) and 2.17 in the iron deficient diet group (n=6; −4.33 difference between means). The possible range in IHC scores for the meniscus was 0.00–8.00. [B] The mean percent of cells positive for 4-HNE adducts† in meniscal tissue was 65.94% in the control group (n=6) and 9.90% in the iron deficient diet group (n=6; −56.05% difference between means). [C] Representative image depicting the immunostaining of 4-HNE adducts in the meniscus from the medial compartment of a control animal (200X magnification; scale bar represents 20 μM). [D] Representative image depicting the immunostaining of 4-HNE adducts in the meniscus from the medial compartment of an animal receiving the iron deficient diet (200X magnification; scale bar represents 20 μM).
Figure 6.
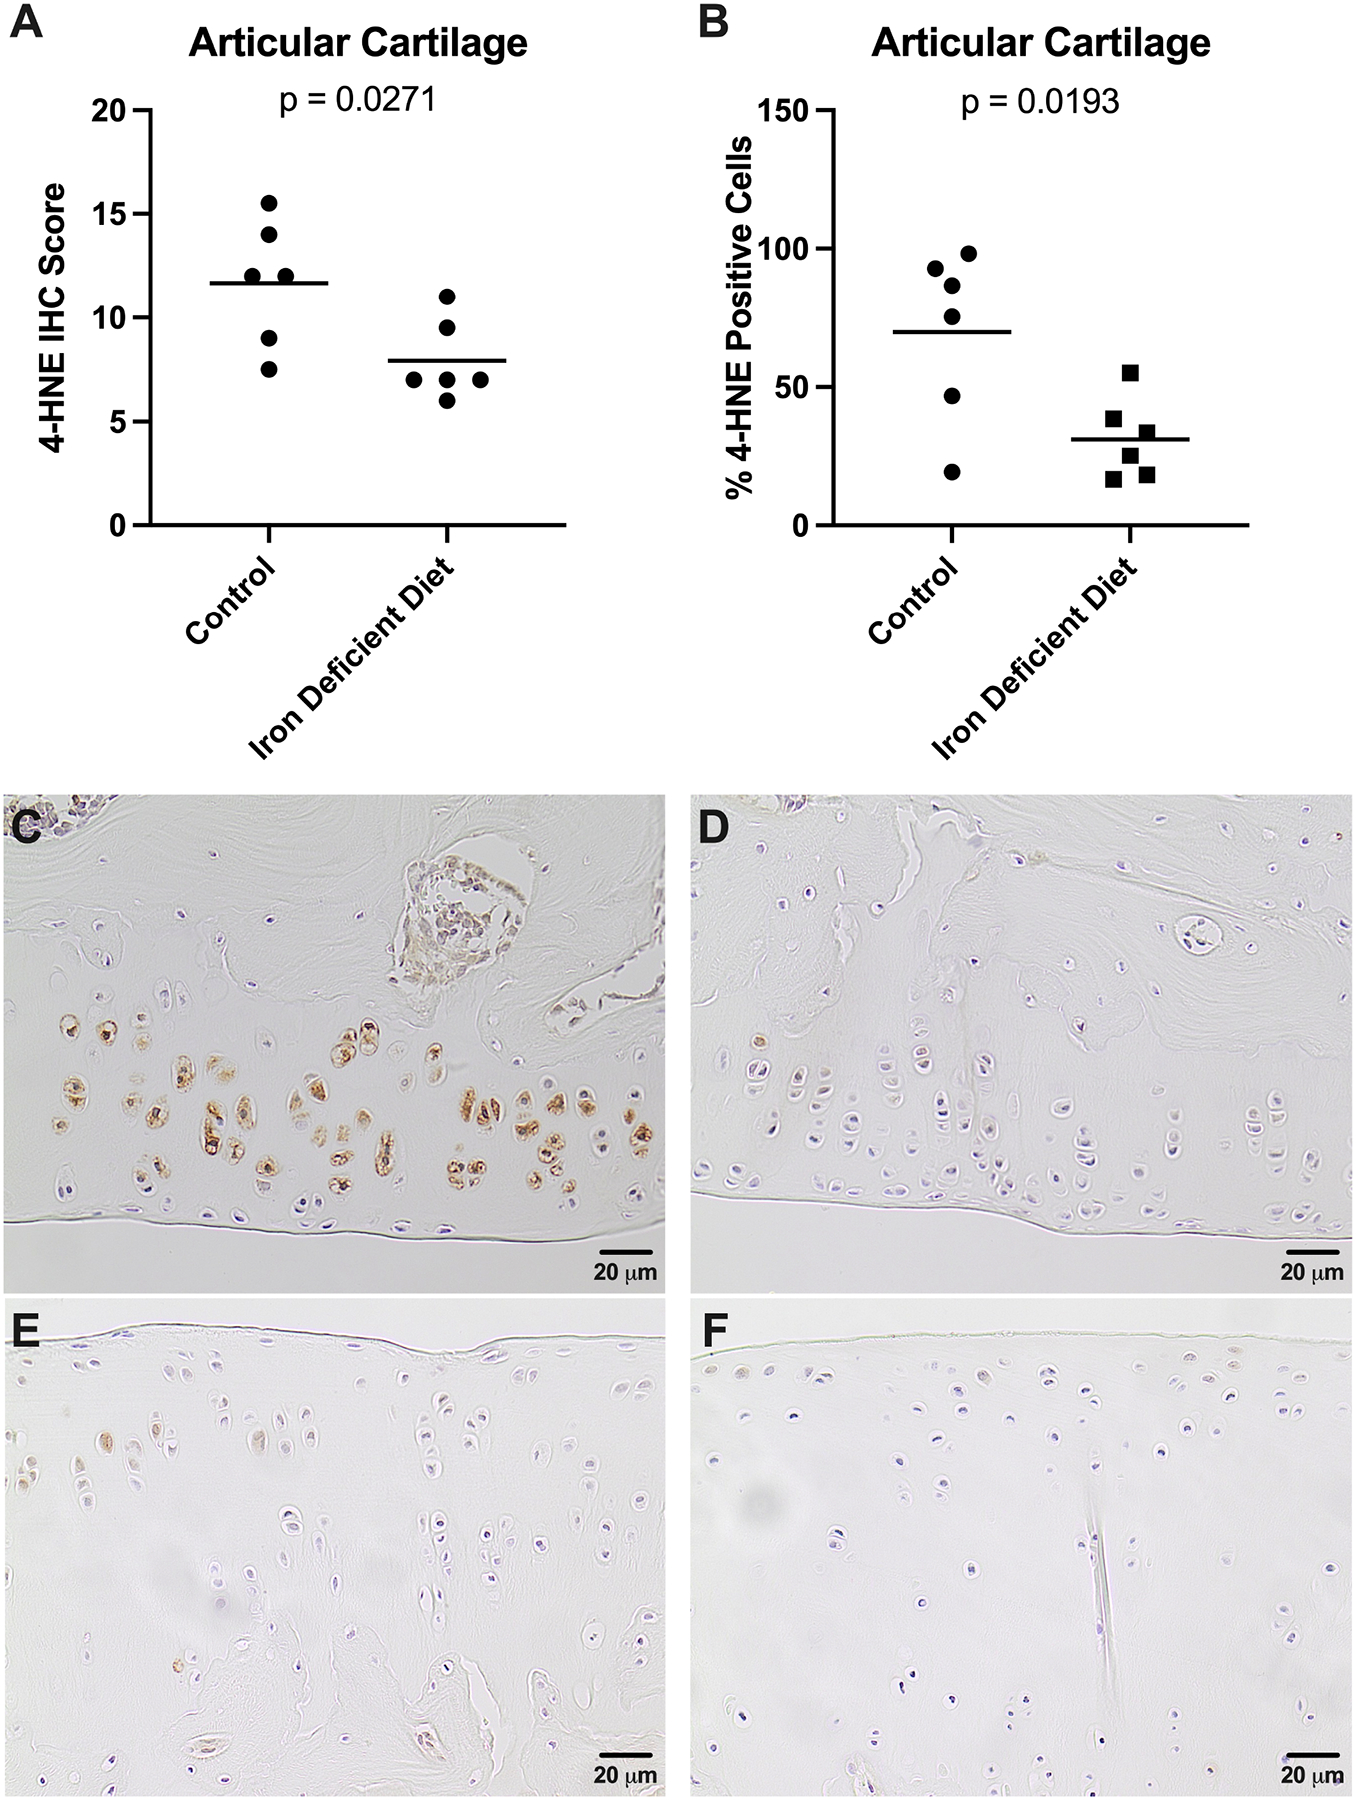
Immunohistochemistry of 4-hydroxynonenal-induced protein adducts in knee articular cartilage. [A] IHC score† for 4-HNE adducts in knee articular cartilage was 11.67 in the control group (n=6) and 7.92 in the iron deficient diet group (n=6; −3.75 difference between means). The possible range of IHC scores was 0.00–16.00 as the tibia and femur assessments were combined to yield an overall score for the knee articular cartilage. [B] The mean percent of cells positive for 4-HNE adducts† in knee articular cartilage was 39.85% in the control group (n=6) and 31.17% in the iron deficient diet group (n=6; −38.68% difference between means). [C] Representative image depicting the immunostaining of 4-HNE adducts in the medial femoral articular cartilage from a control animal (200X magnification; scale bar represents 20 μM). [D] Representative image depicting the immunostaining of 4-HNE adducts in the medial femoral articular cartilage from an animal receiving the iron deficient diet (200X magnification; scale bar represents 20 μM). [E] Representative image depicting the immunostaining of 4-HNE adducts in the medial tibial plateau from a control animal (200X magnification; scale bar represents 20 μM). [F] Representative image depicting the immunostaining of 4-HNE adducts in the medial tibial plateau from an animal receiving the iron deficient diet (200X magnification; scale bar represents 20 μM).
Immunostaining for 4-HNE was detected in synovial tissue for all animals. In contrast to findings presented for ADAMTS4, no significant differences in IHC scores or percentage of positive cells were observed between groups for this tissue type (data not shown).
Transcript expression of iron trafficking and storage genes.
Given these findings, we aimed to determine whether genes related to cellular iron metabolism were altered in the meniscus and articular cartilage of animals receiving the iron deficient diet. Relative to the control group, iron deficient guinea pigs had significantly higher transcript expression of the cellular iron importer TFR1 within these tissues (p = 0.0260; Figure 7A). Similarly, treated animals had significantly higher transcript counts of the cellular iron exporter FPN (p = 0.0087; Figure 7B). The mRNA expression of FTH, a major constituent of the iron storage protein ferritin, (p > 0.9999; Figure 7C) did not significantly change between groups.
Figure 7.

Normalized mRNA counts of genes related to iron metabolism in the meniscus and knee articular cartilage. [A] Median transcript counts of TFR1× were 13.20 in the control group (n=6) and 34.86 in the iron deficient diet group (n=6; 21.66 difference between medians). [B] Median transcript counts of FPN× were 36.86 in the control group (n=6) and 76.42 in the iron deficient diet group (n=6; 39.56 difference between medians). [C] Median transcript counts of FTH× were 2294.00 in the control group (n=6) and 2179.00 in the iron deficient diet group (n=6; −114.50 difference between medians).
Discussion.
Here, we demonstrated that histologic OA lesions were lessened in disease-prone Hartley guinea pigs fed a short-term iron deficient diet for 19 weeks. To our knowledge, this is the first study examining the effects of an iron deficient diet in a rodent model of primary OA. In conjunction with our manuscripts demonstrating both the aggravating effect of iron overload on OA-resistant Strain 13 guinea pigs23 and the benefits of iron chelation in OA-prone Hartleys31, this work further supports the theory that systemic iron status may directly influence knee joint health.
As expected, administration of an iron deficient diet significantly reduced iron levels in the serum, liver, and cartilage of study animals. CBC analysis revealed that guinea pigs receiving the iron deficient diet exhibited hematologic changes characteristic of early iron deficiency, such as microcytosis and hypochromia. However, the extent of iron deficiency did not progress to a clinical anemia, as evidenced by the hematocrit values within RIs.
While an iron deficient diet is not recommended for long-term wellbeing, this study offers proof-of-principle data that tempering ingestion of iron-rich foods and/or supplements may be beneficial in reducing aging-related knee joint OA. The altered expression of two major iron trafficking genes within knee articular cartilage and meniscus support that systemic iron levels can impact local iron homeostasis mechanisms within the joint. Indeed, the increased expression of both the cellular iron importer TFR1 and exporter FPN suggest that early systemic iron deficiency may have triggered cellular iron demand and mobilization, respectively, within the knee environment.
The most striking finding of the current work was a significantly decreased histologic OA score in the iron deficient diet group. More specifically, evaluation of individual OARSI score parameters revealed that there were differences in ECM structure, proteoglycan content of articular cartilage, and chondrocyte density between treatment groups, with the control group exhibiting more cell loss than animals receiving an iron deficient diet. As body weights were similar across treatment groups, this finding may be attributed to the difference in iron content between the two diets.
The serum concentration of two inflammatory biomarkers, PGE2 and MCP1, were not significantly different between treatments. These results, coupled with similar white blood cell counts between groups, suggest that an iron deficient diet did not affect systemic inflammation at the time of study termination. There are, however, at least two mechanisms explored in this study that may account for these changes. First, animals receiving an iron deficient diet had reduced protein expression of the aggrecanase ADAMTS4 in the synovium relative to those in the control group. Indeed, ADAMTS4 has been documented to be more highly expressed by the synovium than the cartilage32 and is upregulated in individuals with OA29. The secretion of ADAMTS4 into synovial fluid can contribute to joint pathology by degrading proteoglycans within the cartilage29. As the most significant histologic finding was relatively increased proteoglycan content of iron deficient animals, reducing iron systemically may have helped maintain the cartilage by decreasing the enzymatic degradation of the ECM.
Second, it is well-established that iron can directly induce chondrocyte apoptosis, although this is most widely documented in the presence of heme iron, as seen with traumatic joint injury and hemophilic arthropathy14,18. Apart from heme, ROS – including those produced from iron-mediated reactions – can also prompt chondrocyte loss and directly damage ECM components33. More specifically, elevated production of 4-HNE, a product of iron-mediated lipid peroxidation, is thought to play a role in OA pathogenesis34–35. Higher levels of 4-HNE have been demonstrated to induce chondrocyte apoptosis36, and 4-HNE-modified proteins have been detected in chondrocytes35 and synovial fluid34 from human OA patients. In the present study, 4-HNE-induced protein adducts were reduced in the meniscus and knee articular cartilage of iron deficient animals, and the percentage of chondrocytes with 4-HNE adducts was significantly correlated with both the cellularity and iron concentration of the cartilage. The lower concentration of iron within knee joints of treated animals may have decreased the production of ROS and, subsequently, 4-HNE from lipid peroxidation. As such, decreasing systemic iron levels may have beneficially modulated iron levels within the knee, resulting in less tissue damage and cell loss.
Qualitative assessment of microCT images by a veterinary radiologist (AJM) revealed that 5 animals in the control group exhibited subchondral bone sclerosis; this was only noted in 3 animals receiving the iron deficient diet (data not shown). Indeed, damage to articular cartilage in OA is often accompanied by sclerosis in the subchondral bone37. This increase in subchondral bone thickness decreases the tissue elasticity and causes a reduced ability to respond to biomechanical forces on the joint, further promoting joint degeneration38. In support of this, quantitative microCT measurements demonstrated a statistically significant decrease in TMD of the subchondral trabecular bone occurring with iron deficiency in all anatomic regions examined. While epidemiologic studies have consistently cited a positive association between systemic bone mineral density (BMD) and OA39–40, the effect of local subchondral TMD on OA pathogenesis remains controversial, particularly in relation to cartilage degeneration. Some studies report that the TMD of subchondral bone is positively associated with cartilage degeneration41 and/or an increased risk of knee replacement surgery42 in those affected by OA. Conversely, separate studies have reported that subchondral TMD is unable to predict cartilage loss43 in patients affected by knee OA. One potential source of these discrepancies may be the lack congruency between studies, such as diverging locations evaluated and/or the utilization of different imaging methods. Further, subchondral bone has been documented to undergo asynchronous periods of tissue breakdown and subsequent replacement during OA pathogenesis38. As such, the relative density of subchondral bone may vary based on the stage of disease progression and timing of microarchitecture measurements.
Overall, the statistical differences in microCT measurements noted between the groups suggests an influence of systemic iron levels on bone. Human population studies have found a positive association between BMD and serum ferritin levels44–45 as well as with dietary iron intake in postmenopausal women46. Similarly, an epidemiologic study reported that human patients with iron deficiency anemia were more likely to have osteoporosis than age- and-gender matched individuals with sufficient systemic iron levels47; comparable results were documented for the BMD of male Wistar rats fed an iron deficient diet48. Together, these studies offer evidence that systemic iron levels have a positive relationship with BMD. However, the positive relationship between iron levels and BMD has limitations, as genetic iron overload conditions, such as hereditary hemochromatosis and thalassemia, are commonly associated with lower bone density49 and osteoporosis50; this is attributed to increased osteoclast activity in conditions of clinical iron excess49. Collectively, these studies highlight the narrow range of iron levels required for appropriate bone homeostasis. Future studies should continue to explore the relationship between systemic iron levels and bone density, particularly within the context of idiopathic OA.
The results from this proof-of-principle study suggest that systemic iron reduction, achieved through an iron deficient diet, delayed the onset or progression of cartilage lesions in an OA-prone Hartley guinea pigs. Based on our findings, we hypothesize that this reduction in cartilage degeneration was attributed to decreased levels of ADAMTS4 and oxidant damage locally within knee joints. However, there are notable confines to this work. First, the consumption of an iron deficient diet is not ideal for overall long-term health. Future studies should examine the effects of longer-term and/or intermittent dietary iron reduction (versus deficiency) on the development of OA-associated cartilage lesions; this approach may also be viable for hereditary hemochromatosis. Second, we do not anticipate that this therapy will translate to heme-related arthropathies such as acute trauma or hemophilic arthropathy, as dietary approaches are not likely to be timely or impactful enough to combat the influx of iron-rich blood associated with these conditions. Next, the current work was completed in males, only, with a sample size powered for histopathology; continued research will include female animals and a higher sample size to assess for potential sex differences and secondary outcomes such as transcript expression, respectively. Finally, additional work is also planned to elucidate the effects of systemic iron levels on additional cellular iron trafficking molecules within the joint and investigate OA-related gene expression in non-FFPE tissue. Such studies will improve our understanding of how iron contributes to development of idiopathic OA and may open the door to exploring novel treatments for this widespread and debilitating disease.
Supplementary Material
Supplemental Figure S1. Dietary composition of the control diet (“Iron Sufficient GP Diet”) and iron deficient diet (“Iron Deficient GP Diet”).
Supplemental Figure S2. Select hemogram values with clinical reference intervals. [A] Mean values for mean corpuscular volume (MCV) † were 60.00 fl in the control group (n=6) and 82.33 fl in the iron deficient diet group (n=5; 22.33 fl difference between means). All animals in the iron deficient diet group had MCV values below the lower limit of the reference interval range (78 fl-94 fl in adult guinea pigs51) suggesting microcytosis was occurring as an attempt to compensate for the iron deficiency occurring in this experimental group. [B] Mean values for hematocrit (HCT) ◊ were 43.60% in the control group (n=6) and 46.67% in the iron deficient diet group (n=5; 3.07% difference between means). All animals in the iron deficient diet group had HCT values within the reference interval range (38%–53% in adult guinea pigs51) suggesting that these animals had sufficient red blood cells despite iron deficiency. [C] Median values for cellular hemoglobin concentration mean (CHCM) × were 29.00 g/dL in the control group (n=6) and 32.00 g/dL in the iron deficient diet group (n=5; 3.00 g/dL difference between medians). All animals in the iron deficient diet group had CHCM values at or below the lower limit of the reference interval range (30.00 g/dL-35.00 g/dL in adult guinea pigs51) suggesting hypochromia was occurring due to iron deficiency in this experimental group. [D] Mean platelet counts† were 585.20 × 10³/μL in the control group (n=6) and 360.50 × 10³/μL in the iron deficient diet group (n=5; −224.70 × 10³/μL difference between means). All animals in the iron deficient diet group had platelet counts within the reference interval range (112 × 103/μL −943 × 103/μL51) suggesting the absence of a clinical thrombocytosis in this experimental group. [E] Mean total nucleated cell counts † were 4.67 × 10³/μL in the control group (n=6) and 5.28 × 10³/μL in the iron deficient diet group (n=5; 0.61 × 10³/μL difference between means). All animals in the iron deficient diet group had nucleated cell counts within the reference interval range (1.90 × 10³/μL - 11.70 × 10³/μL51). [F] Mean neutrophil cell counts † were 2.35 × 10³/μL in the control group (n=6) and 2.52 × 10³/μL in the iron deficient diet group (n=5; 0.17 × 10³/μL difference between means). All animals in the iron deficient diet group had neutrophil cell counts within the reference interval range (0.437 × 10³/μL - 6.804 × 10³/μL51). [G] Mean lymphocyte cell counts † were 1.98 × 10³/μL in the control group (n=6) and 2.22 × 10³/μL in the iron deficient diet group (n=5; 0.24 × 10³/μL difference between means). All animals in the iron deficient diet group had lymphocyte cell counts within the reference interval range (0.476 × 10³/μL - 4.816 × 10³/μL51). [H] Mean monocyte cell counts † were 0.13 × 10³/μL in the control group (n=6) and 0.22 × 10³/μL in the iron deficient diet group (n=5; 0.09 × 10³/μL difference between means). All animals within the iron deficient diet group had monocyte cell counts within the reference interval range (0.00 × 10³/μL −1.020 × 10³/μL51). One blood sample from the iron deficient diet group clotted and was unable to be used for CBC analysis. Exclusion of this sample resulted in n=5 animals from the iron deficient diet evaluated for hemogram parameters.
Supplemental Figure S3. Knee tissue from 12-week-old male Dunkin-Hartley guinea pig. Representative image of a knee joint from a male, 12-week-old Dunkin-Hartley guinea pig stained with toluidine blue for comparison to animals in the present study at termination (100X magnification; scale bar represents 50 μM). The representative image demonstrates a smooth articular surface, with adequate numbers of chondrocytes and proteoglycan distributed throughout the extracellular matrix.
Supplemental Figure S6. Body weights of animals throughout the duration of the study. The experimental diet did not have a significant effect on the body weight of animals at any point during the study (p=0.7928). Data was analyzed using a two-way analysis of variance (ANOVA) with Geisser-Greenhouse correction for unequal variability of differences and Sidak’s post-hoc analysis for multiple comparisons.
Acknowledgements.
We would like to thank Crystal Richt and the staff at the University of Arizona Genetics Core; Kevin Daniels and Zaria Torres-Poche at Colorado State University Veterinary Diagnostic Laboratories for their assistance in generating experimental data. We would also like to thank the Laboratory Animals Resources staff at Colorado State University for their commitment to excellent care of the animals used in this study.
Role of the Funding Source.
NIH R21 AG056807 provided funding to support the acquisition, analysis, and interpretation of data. LBR was supported by T32 OD-010437.
Footnotes
Publisher's Disclaimer: This is a PDF file of an unedited manuscript that has been accepted for publication. As a service to our customers we are providing this early version of the manuscript. The manuscript will undergo copyediting, typesetting, and review of the resulting proof before it is published in its final form. Please note that during the production process errors may be discovered which could affect the content, and all legal disclaimers that apply to the journal pertain.
Competing Interest Statement.
No authors have any conflicts of interest to disclose for this work.
References.
- 1.Kohgo Y, Ikuta K, Ohtake T, Torimoto Y, Kato J. Body iron metabolism and pathophysiology of iron overload. Int J Hematol. 2008;88(1):7–15. doi: 10.1007/s12185-008-0120-5. [DOI] [PMC free article] [PubMed] [Google Scholar]
- 2.Walling C. Fenton’s reagent revisited. Acc Chem Res. 1975;8(4):125–131. doi: 10.1021/ar50088a003. [DOI] [Google Scholar]
- 3.Green R, Charlton R, Seftel H, Bothwell T, Mayet F, Adams B, et al. Body iron excretion in man. Am J Med. 1968;45(3):336–353. doi: 10.1016/0002-9343(68)90069-7. [DOI] [PubMed] [Google Scholar]
- 4.Xu J, Marzetti E, Seo AY, Kim J-S, Prolla TA, Leeuwenburgh C. The emerging role of iron dyshomeostasis in the mitochondrial decay of aging. Mech Ageing Dev. 2010;131(7–8):487–493. doi: 10.1016/j.mad.2010.04.007. [DOI] [PMC free article] [PubMed] [Google Scholar]
- 5.Liu J, Li Q, Yang Y, Ma L. Iron metabolism and type 2 diabetes mellitus: A meta-analysis and systematic review. J Diabetes Investig. 2020;11(4): 946–55. doi: 10.1111/jdi.13216. [DOI] [PMC free article] [PubMed] [Google Scholar]
- 6.Kiechl S, Aichner F, Gerstenbrand F, Egger G, Mair A, Rungger G, et al. Body iron stores and presence of carotid atherosclerosis. Results from the Bruneck Study. Arterioscler Thromb. 1994;14(10):1625–30. doi: 10.1161/01.atv.14.10.1625. [DOI] [PubMed] [Google Scholar]
- 7.Ward RJ, Zucca FB, Duyn JH, Crichton RR, Zecca L. The role of iron in brain ageing and neurodegenerative disorders. Lancet Neurol. 2014;13(10):1045–60. doi: 10.1016/S1474-4422(14)70117-6. [DOI] [PMC free article] [PubMed] [Google Scholar]
- 8.Jung M, Mertens C, Tomat E, Brune B. Iron as a central player and promising target in cancer progression. Int J Mol Sci. 2019;20(2):273. doi: 10.3390/ijms20020273. [DOI] [PMC free article] [PubMed] [Google Scholar]
- 9.Flemming DJ, Tucker KL, Jacques PF, Dallal GE, Wilson PWF, Wood RJ. Dietary factors associated with the risk of high iron stores in the elderly Framingham Heart Study cohort. Am J Clin Nutr. 2002;76(6):1375–84. doi: 10.1093/ajcn/76.6.1375. [DOI] [PubMed] [Google Scholar]
- 10.Dongiovanni P, Ruscica M, Rametta R, Recalcati S, Steffani L, Gatti S, et al. Dietary iron overload induces visceral adipose tissue insulin resistance. Am J Pathol. 2013;182(6):2254–63. doi: 10.1016/j.ajpath.2013.02.019. [DOI] [PubMed] [Google Scholar]
- 11.Liu D, He H, Yin D, Que A, Tang L, Liao Z, et al. Mechanism of chronic dietary iron overload-induced liver damage in mice. Mol Med Rep. 2013; 7(4):1173–9. doi: 10.3892/mmr.2013.1316. [DOI] [PubMed] [Google Scholar]
- 12.Richette P, Ottaviani S, Vicaut E, Bardin T. Musculoskeletal complications of hereditary hemochromatosis: a case-control study. J Rheumatol. 2010;37(10):2145–50. doi: 10.3899/jrheum.100234. [DOI] [PubMed] [Google Scholar]
- 13.Biemond P, Swaak AJ, van Eijk HG, Koster JF. Intraarticular ferritin-bound iron in rheumatoid arthritis. A factor that increases oxygen free radical-induced tissue destruction. Arthritis Rheum. 1986;29(10):1187–1193. 10.1002/art.1780291002. [DOI] [PubMed] [Google Scholar]
- 14.Roosendaal G, Lafeber FP. Pathogenesis of haemophilic arthropathy. Haemophilia. 2016;12 Suppl 3: 117–21. doi: 10.1111/j.1365-2516.2006.01268.x. [DOI] [PubMed] [Google Scholar]
- 15.Roosendaal G, Vianen ME, Wenting MJ, van Rinsum AC, van den Berg HM, Lafeber FP, et al. Iron deposits and catabolic properties of synovial tissue from patients with haemophilia. J Bone Joint Surg Br. 1998;90(3):540–5. doi: 10.1302/0301-620x.80b3.7807. [DOI] [PubMed] [Google Scholar]
- 16.Schumacher HR. Articular cartilage in the degenerative arthropathy of hemochromatosis. Arthritis Rheum. 1982;25(12):1460–8. doi: 10.1002/art.1780251212. [DOI] [PubMed] [Google Scholar]
- 17.Ferreria AV, Duarte TL, Marques S, Costa P, Neves SC, dos Santos T, et al. Iron triggers the early stages of cartilage degeneration in vitro: The role of articular chondrocytes. Osteoarthritis Cartilage Open. 2021;3(2):100145. 10.1016/j.ocarto.2021.100145. [DOI] [PMC free article] [PubMed] [Google Scholar]
- 18.Hooiveld M, Roosendaal G, Wenting M, van den Berg M, Bijlsma J, Lafeber F. Short-term exposure of cartilage to blood results in chondrocyte apoptosis. Am J Pathol. 2003;162(3):943–51. doi: 10.1016/S0002-9440(10)63889-8. [DOI] [PMC free article] [PubMed] [Google Scholar]
- 19.Cross M, Smith E, Hoy D, Nolte S, Ackerman I, Fransen M, et al. The global burden of hip and knee osteoarthritis: estimates from the global burden of disease 2010 study. Ann Rheum Dis. 2014;73(7):1323–1330. doi: 10.1136/annrheumdis-2013-204763. [DOI] [PubMed] [Google Scholar]
- 20.Ogilvie-Harris DJ, Fornasier VL. Synovial iron deposition in osteoarthritis and rheumatoid arthritis. J Rheumatol. 1980; 7(1): 30–6. [PubMed] [Google Scholar]
- 21.Yazer M, Sarban S, Kocyigit A, Isikan UE. Synovial fluid and plasma selenium, copper, zinc, and iron concentrations in patients with rheumatoid arthritis and osteoarthritis. Biol Trace Elem Res. 2005;106(2): 123–32. doi: 10.1385/BTER:106:2:123. [DOI] [PubMed] [Google Scholar]
- 22.Nugzar O, Zandman-Goddard G, Oz H, Lakstein D, Feldbrin Z, Shargorodsky M. The role of ferritin and adiponectin as predictors of cartilage damage assessed by arthroscopy in patients with symptomatic knee osteoarthritis. Best Pract Rest Clin Rheumatol. 2018; 32(5): 662–8. doi: 10.1016/j.berh.2019.04.004. [DOI] [PubMed] [Google Scholar]
- 23.Burton LH, Radakovich LB, Marolf AJ, Santangelo KS. Systemic iron overload exacerbates osteoarthritis in the strain 13 guinea pig. Osteoarthritis Cartilage. 2020;28(9):1265–75. doi: 10.1016/j.joca.2020.06.005. [DOI] [PMC free article] [PubMed] [Google Scholar]
- 24.Radakovich LB, Marolf AJ, Shannon JP, Pannone SC, Sherk VD, Santangelo KS. Development of a microcomputed tomography scoring system to characterize disease progression in the Hartley guinea pig model of spontaneous osteoarthritis. Connect Tissue Res. 2018;59(6):523–33. doi: 10.1080/03008207.2017.1409218. [DOI] [PMC free article] [PubMed] [Google Scholar]
- 25.Kraus VB, Huebner JL, DeGroot J, Bendele A. The OARSI histopathology initiative - recommendations for histological assessments of osteoarthritis in the guinea pig. Osteoarthritis Cartilage. 2010;18 Suppl 3(Suppl 3):S35–52. doi: 10.1016/j.joca.2010.04.015. [DOI] [PMC free article] [PubMed] [Google Scholar]
- 26.Idleburg C, DeLassus EN, Novack DV. Immunohistochemistry of Skeletal Tissues. Methods Mol Bio. 2015;1226:87–95. doi: 10.1007/978-1-4939-1619-1_8. [DOI] [PubMed] [Google Scholar]
- 27.Santangelo KS, Pieczarka EM, Nuovo GJ, Weisbrode SE, Bertone AL. Temporal expression and tissue distribution of interleukin-1ß in two strains of guinea pigs with varying propensity for spontaneous knee osteoarthritis. Osteoarthritis Cartilage. 2011;19(4):439–48. doi: 10.1016/j.joca.2011.01.004. [DOI] [PMC free article] [PubMed] [Google Scholar]
- 28.Yang CY, Chanalaris A, Troeberg L. ADAMTS and ADAM metalloproteinases in osteoarthritis – looking beyond the ‘usual suspects’. Osteoarthritis Cartilage. 2017;25(7):1000–1009. doi: 10.1016/j.joca.2017.02.791. [DOI] [PMC free article] [PubMed] [Google Scholar]
- 29.Zeynel Cilek M, de Vega S, Shiozawa J, Yoshinaga C, Miyamae Y, Chijiiwa M et al. Synergistic upregulation of ADAMTS4 (aggrecanase-1) by cytokines and its suppression in knee osteoarthritis synovial fibroblasts. Lab Invest. 2022;102(1):102–111. doi: 10.1038/s41374-021-00685-4. [DOI] [PubMed] [Google Scholar]
- 30.Bresgen N, Jaksch H, Lacher H, Ohlenschlager I, Uchida K, Eckl PM. Iron-mediated oxidative stress plays an essential role in ferritin-induced cell death. Free Radic Biol Med. 2010;48(10):1347–57. doi: 10.1016/j.freeradbiomed.2010.02.019. [DOI] [PubMed] [Google Scholar]
- 31.Burton LH, Afzali MF, Radakovich LB, Campbell MA, Culver LA, Olver CS et al. Systemic administration of a pharmacologic iron chelator reduces cartilage lesion development in the Dunkin-Hartley model of primary osteoarthritis. Free Radic Biol Med. 2021;179:47–58. doi: 10.1016/j.freeradbiomed.2021.12.257. [DOI] [PMC free article] [PubMed] [Google Scholar]
- 32.Chou CH, Jain V, Gibson J, Attarin DE, Haraden CA, Yohn CB et al. Synovial cell cross-talk with cartilage plays a major role in the pathogenesis of osteoarthritis. Sci Rep. 2020;10(1):10868. doi: 10.1038/s41598-020-67730-y. [DOI] [PMC free article] [PubMed] [Google Scholar]
- 33.Henrotin Y, Bruckner P, Pujol J-P. The role of reactive oxygen species in homeostasis and degradation of cartilage. Osteoarthritis Cartilage. 2003;11(10):747–755. doi: 10.1016/S1063-4584(03)00150-X. [DOI] [PubMed] [Google Scholar]
- 34.Morquette B, Shi Q, Lavigne P, Ranger P, Fernandes JC, Benderdour M. Production of lipid peroxidation products in osteoarthritic tissues: new evidence linking 4-hydroxynonenal to cartilage degeneration. Arthritis Rheum. 2006;54(1):271–81. doi: 10.1002/art.21559. [DOI] [PubMed] [Google Scholar]
- 35.Geib T, Iacob C, Jribi R, Fernandes J, Benderdour M, Sleno L. Identification of 4-hydroxynonenal-modified proteins in human osteoarthritic chondrocytes. J Proteomics. 2021;232:104024. doi: 10.1016/j.jprot.2020.104024. [DOI] [PubMed] [Google Scholar]
- 36.Vaillancourt F, Fahmi H, Shi Q, Lavigne P, Ranger P, Fernandes JC. 4-hydroxynonenal induces apoptosis in human osteoarthritic chondrocytes: the protective role of glutathione-S-transferase. Arthritis Res Ther. 2008;10(5):R107. doi: 10.1186/ar2503. [DOI] [PMC free article] [PubMed] [Google Scholar]
- 37.Lajeunesse D, Reboul P. Subchondral bone in osteoarthritis: a biologic link with articular cartilage leading to abnormal remodeling. Curr Opin Rheumatol. 2003;15(5):628–33. doi: 10.1097/00002281-200309000-00018. [DOI] [PubMed] [Google Scholar]
- 38.Stewart HL, Kawcak CE. The importance of subchondral bone in the pathophysiology of osteoarthritis. Front Vet Sci. 2018;5:178. doi: 10.3389/fvets.2018.00178. [DOI] [PMC free article] [PubMed] [Google Scholar]
- 39.Hardcastle SA, Dieppe P, Gregson CL, Smith GD, Tobias JH. Osteoarthritis and bone mineral density: are strong bones bad for joints? Bonekey Rep. 2015;4:624. doi: 10.1038/bonekey.2014.119. [DOI] [PMC free article] [PubMed] [Google Scholar]
- 40.Hart DJ, Mootoosamy I, Doyle DV, Spector TD. The relationship between osteoarthritis and osteoporosis in the general population: the Chingford study. Ann Rheum Dis. 1994;53(3):158–62. doi: 10.1136/ard.53.3.158. [DOI] [PMC free article] [PubMed] [Google Scholar]
- 41.Omoumi P, Babel H, Jolles BM, Favre J. Relationships between cartilage thickness and subchondral bone mineral density in non-osteoarthritic and severely osteoarthritic knees: In vivo concomitant 3D analysis using CT arthrography. Osteoarthritis Cartilage. 2019;27(4):621–29. doi: 10.1016/j.joca.2018.12.014. [DOI] [PubMed] [Google Scholar]
- 42.Cai G, Otahal P, Cicuttini F, Wu F, Munugoda IP, Jones G, et al. The association of subchondral and systemic bone mineral density with osteoarthritis-related joint replacements in older adults. Osteoarthritis Cartilage. 2020;28(4):438–445. doi: 10.1016/j.joca.2020.02.832. [DOI] [PubMed] [Google Scholar]
- 43.Dore D, Quinn S, Ding C, Winzenberg T, Cicuttini F, Jones G. Subchondral bone and cartilage damage: a prospective study in older adults. Arthritis Rheum. 2010;62(7):1967–73. doi: 10.1002/art.27467. [DOI] [PubMed] [Google Scholar]
- 44.Babaei M, Bijani A, Heidari P, Hosseini SR, Heidari B. Serum ferritin levels and bone mineral density in the elderly. Caspian J Intern Med. 2018;9(3):232–238. doi: 10.22088/cjim.9.3.232. [DOI] [PMC free article] [PubMed] [Google Scholar]
- 45.Lee KS, Jang JS, Lee DR, Kim YH, Nam GE, Han BD, et al. Serum ferritin levels are positively associated with bone mineral density in elderly Korean men: the 2008–2010 Korea National Health and Nutrition Examination Surveys. J Bone Miner Metab. 2014;32(6):683–690. doi: 10.1007/s00774-013-0540-z. [DOI] [PubMed] [Google Scholar]
- 46.Harris MM, Houtkooper LB, Stanford VA, Parkhill C, Weber JL, Flint-Wagner H, et al. Dietary Iron Is Associated with Bone Mineral Density in Healthy Postmenopausal Women. J Nutr. 2003;133(11):3598–3602. doi: 10.1093/jn/133.11.3598. [DOI] [PubMed] [Google Scholar]
- 47.Pan M-L, Chen L-R, Tsao H-M, Chen K-H. Iron Deficiency Anemia as a Risk Factor for Osteoporosis in Taiwan: A Nationwide Population-Based Study. Nutrients. 2017;9(6):616. doi: 10.3390/nu9060616. [DOI] [PMC free article] [PubMed] [Google Scholar]
- 48.Katsumata S, Katsumata-Tsuboi R, Uehara M, Suzuki K. Severe iron deficiency decreases both bone formation and bone resorption in rats. J Nutr. 2009;139(2):238–43. doi: 10.3945/jn.108.093757. [DOI] [PubMed] [Google Scholar]
- 49.Ebrahimpour L, Akhlaghpoor S, Azarkayvan A, Salehi M, Morteza A, Alinaghi R. Correlation between bone mineral densitometry and liver/heart iron overload evaluated by quantitative T2* MRI. Hematology. 2012;17(5):297–301. doi: 10.1179/1607845412Y.0000000013. [DOI] [PubMed] [Google Scholar]
- 50.Valenti L, Varenna M, Fracanzani AL, Rossi V, Fargion S, Sinigaglia L. Association between iron overload and osteoporosis in patients with hereditary hemochromatosis. Osteoporos Int. 2009;20(4):549–55. doi: 10.1007/s00198-008-0701-4. [DOI] [PubMed] [Google Scholar]
- 51.Splitter AP, Afzali MF, Bork SB, Burton LH, Radakovich LB, Seebart CA, et al. Age- and sex-associated differences in hematology and biochemistry parameters of Dunkin Hartley guinea pigs (Cavia porcellus). PLoS One. 2021;16(7):e0253794. doi: 10.1371/journal.pone.0253794. [DOI] [PMC free article] [PubMed] [Google Scholar]
Associated Data
This section collects any data citations, data availability statements, or supplementary materials included in this article.
Supplementary Materials
Supplemental Figure S1. Dietary composition of the control diet (“Iron Sufficient GP Diet”) and iron deficient diet (“Iron Deficient GP Diet”).
Supplemental Figure S2. Select hemogram values with clinical reference intervals. [A] Mean values for mean corpuscular volume (MCV) † were 60.00 fl in the control group (n=6) and 82.33 fl in the iron deficient diet group (n=5; 22.33 fl difference between means). All animals in the iron deficient diet group had MCV values below the lower limit of the reference interval range (78 fl-94 fl in adult guinea pigs51) suggesting microcytosis was occurring as an attempt to compensate for the iron deficiency occurring in this experimental group. [B] Mean values for hematocrit (HCT) ◊ were 43.60% in the control group (n=6) and 46.67% in the iron deficient diet group (n=5; 3.07% difference between means). All animals in the iron deficient diet group had HCT values within the reference interval range (38%–53% in adult guinea pigs51) suggesting that these animals had sufficient red blood cells despite iron deficiency. [C] Median values for cellular hemoglobin concentration mean (CHCM) × were 29.00 g/dL in the control group (n=6) and 32.00 g/dL in the iron deficient diet group (n=5; 3.00 g/dL difference between medians). All animals in the iron deficient diet group had CHCM values at or below the lower limit of the reference interval range (30.00 g/dL-35.00 g/dL in adult guinea pigs51) suggesting hypochromia was occurring due to iron deficiency in this experimental group. [D] Mean platelet counts† were 585.20 × 10³/μL in the control group (n=6) and 360.50 × 10³/μL in the iron deficient diet group (n=5; −224.70 × 10³/μL difference between means). All animals in the iron deficient diet group had platelet counts within the reference interval range (112 × 103/μL −943 × 103/μL51) suggesting the absence of a clinical thrombocytosis in this experimental group. [E] Mean total nucleated cell counts † were 4.67 × 10³/μL in the control group (n=6) and 5.28 × 10³/μL in the iron deficient diet group (n=5; 0.61 × 10³/μL difference between means). All animals in the iron deficient diet group had nucleated cell counts within the reference interval range (1.90 × 10³/μL - 11.70 × 10³/μL51). [F] Mean neutrophil cell counts † were 2.35 × 10³/μL in the control group (n=6) and 2.52 × 10³/μL in the iron deficient diet group (n=5; 0.17 × 10³/μL difference between means). All animals in the iron deficient diet group had neutrophil cell counts within the reference interval range (0.437 × 10³/μL - 6.804 × 10³/μL51). [G] Mean lymphocyte cell counts † were 1.98 × 10³/μL in the control group (n=6) and 2.22 × 10³/μL in the iron deficient diet group (n=5; 0.24 × 10³/μL difference between means). All animals in the iron deficient diet group had lymphocyte cell counts within the reference interval range (0.476 × 10³/μL - 4.816 × 10³/μL51). [H] Mean monocyte cell counts † were 0.13 × 10³/μL in the control group (n=6) and 0.22 × 10³/μL in the iron deficient diet group (n=5; 0.09 × 10³/μL difference between means). All animals within the iron deficient diet group had monocyte cell counts within the reference interval range (0.00 × 10³/μL −1.020 × 10³/μL51). One blood sample from the iron deficient diet group clotted and was unable to be used for CBC analysis. Exclusion of this sample resulted in n=5 animals from the iron deficient diet evaluated for hemogram parameters.
Supplemental Figure S3. Knee tissue from 12-week-old male Dunkin-Hartley guinea pig. Representative image of a knee joint from a male, 12-week-old Dunkin-Hartley guinea pig stained with toluidine blue for comparison to animals in the present study at termination (100X magnification; scale bar represents 50 μM). The representative image demonstrates a smooth articular surface, with adequate numbers of chondrocytes and proteoglycan distributed throughout the extracellular matrix.
Supplemental Figure S6. Body weights of animals throughout the duration of the study. The experimental diet did not have a significant effect on the body weight of animals at any point during the study (p=0.7928). Data was analyzed using a two-way analysis of variance (ANOVA) with Geisser-Greenhouse correction for unequal variability of differences and Sidak’s post-hoc analysis for multiple comparisons.