

Abstract
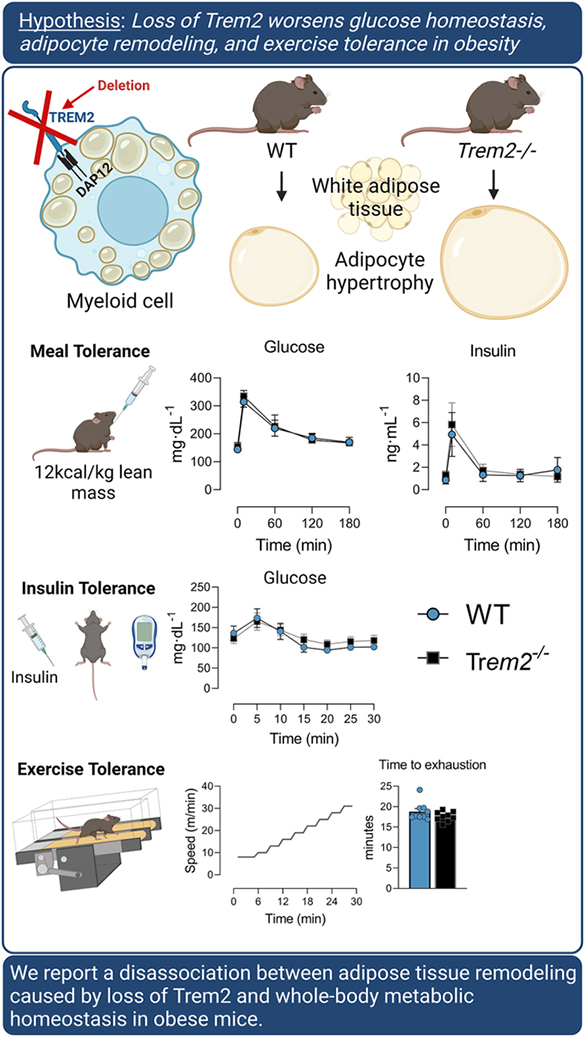
Triggering receptor expressed on myeloid cells 2 (Trem2) is highly expressed on myeloid cells and is involved in cellular lipid homeostasis and inflammatory processes. Trem2 deletion in mice (Trem2−/−) evokes adipose tissue dysfunction, but its role in worsening obesity-induced metabolic dysfunction is not resolved. Here we aimed to determine the causal role of Trem2 in regulating glucose homeostasis and insulin sensitivity in mice. Nine-week-old male and female littermate WT and Trem2−/− mice were fed low fat or high fat diet for 18 weeks and phenotyped for metabolic function. Diet-induced weight gain was similar between genotypes, irrespective of sex. Consistent with prior reports, we find that loss of Trem2 causes massive adipocyte hypertrophy and an attenuation in the lipid associated macrophage transcriptional response to obesity. In contrast to published data, we find that loss of Trem2 does not worsen metabolic function in obese mice. No differences in intraperitoneal glucose tolerance (ipGTT), oral GTT, or mixed meal substrate control, including postprandial glucose, non-esterified fatty acids, insulin, or triglycerides were found between WT and Trem2−/− animals. Similarly, no phenotypic differences existed when animals were challenged with stressors on metabolic demand (i.e., acute exercise or environmental temperature modulation). Collectively, we report a disassociation between adipose tissue remodeling caused by loss of Trem2 and whole-body metabolic homeostasis in obese mice. The complementary nature of experiments conducted gives credence to the conclusion that loss of Trem2 is unlikely to worsen glucose homeostasis in mice.
Graphical Abstract
INTRODUCTION
Triggering receptor expressed on myeloid cells 2 (Trem2) is a transmembrane receptor of the immunoglobulin superfamily that binds an array of ligands, including bacteria and polyanionic molecules (Daws et al., 2003), DNA (Kawabori et al., 2015), lipoproteins (Bailey et al., 2015) and phospholipids (Cannon et al., 2012). Trem2 is highly conserved between species and is primarily expressed on cells of the myeloid lineage. Trem2 is implicated in Alzheimer’s disease where its activation in microglia dampens the microglial inflammatory response [reviewed in (Shi and Holtzman, 2018)]. This has sparked interest in Trem2 as a therapeutic target in neurodegenerative diseases. Outside of the central nervous system, the role of Trem2 is less clear, but is being rapidly explored in a number of disease states including cancer and metabolic disease.
Recent reports indicate that a macrophage population enriched in obese adipose tissue – termed lipid associated macrophages (LAMs) – is defined by high expression of Trem2/TREM2 in both mice (Cottam et al., 2022; Jaitin et al., 2019) and humans (Jaitin et al., 2019). Mice devoid of Trem2 were reported to manifest with worsened glucose homeostasis and enhanced AT inflammation in the setting of diet-induced obesity (Jaitin et al., 2019; Sharif et al., 2021). This suggests that LAMs are lipid scavenging phagocytes that act as a buffer during adipose tissue expansion. Interestingly, overexpression of Trem2 also worsened glucose metabolism and adipose tissue dysfunction in mice (Park et al., 2015), possibly due to ectopic expression of Trem2 in non-canonical cell types. Thus, the role by which Trem2 modulates glucose metabolism in vivo is unresolved. Given that anti-Trem2 therapies are being explored in early clinical trials, it is of the utmost importance to resolve whether Trem2 is an implicit regulator of macrophage function and by extension, glucose regulation. Moreover, Trem2 knockdown has been shown to decrease anti-inflammatory effects of exercise in rat microglia (Zhang et al., 2022a). Yet, whether Trem2 is an important responder and/or regulator of physical activity-induced metabolic demand outside the central nervous system is unknown.
In the present study, we aimed to i) provide clarity as to whether Trem2 is a molecular trigger influencing whole body glucose metabolism in lean and obese states, and ii) determine whether Trem2 is necessary for peak aerobic capacity and/or endurance performance. To this end, male and female mice were fed either low fat (LFD) or high fat (HFD) diet to induce obesity followed by extensive metabolic phenotyping. In contrast to prior reports, we find that Trem2 deficiency does not worsen metabolic function or exercise capacity, however, in concert with prior studies Trem2 is necessary for adipose tissue remodeling in obesity and to regulate the macrophage lipid transcriptional profile.
METHODS
Ethics Statement
All procedures were approved in advance and carried out in compliance with the Vanderbilt University Institutional Animal Care and Use Committee. Vanderbilt University is accredited by the Association for Assessment and Accreditation of Laboratory Animal Care International. All raw data are available upon request.
Animals
C57BL/6J (#000664, JAX) and Trem2 knockout (#027197, JAX; donating investigator: Mike Sanser) mice were purchased from Jackson Laboratories and heterozygous mice bred in our facility to generate male and female WT and Trem2−/− mice as littermate controls. Trem2−/− animals contain a 175 base pair deletion within exon 2 resulting in an early stop after amino acid 17. Genomic DNA was isolated from mouse kidney using a Qiagen DNAeasy Blood and Tissue kit. The deletion was confirmed using forward primer: TCAGGGAGTCAGTCATTAACCA and reverse primer: CAATAAGACCTGGCACAAGGA according to the protocol detailed by Jackson Laboratories (https://www.jax.org/Protocol?stockNumber=027197&protocolID=19636). A separate cohort of Trem2−/− mice and C57Bl/6J control mice (n=9/genotype) was purchased directly for several experiments. Data from littermates or non-littermates are indicated in figure legends. Mice were fed either LFD (10% fat, Research Diets #D12450B, 3.82 kcal/g) or HFD (60% fat, Research Diets #D12492, 5.21 kcal/g) food during interventions (Fig. 1A). Environmental housing temperature was either room temperature (RT, 22°C) or thermoneutral temperature (TN, 28°C) for all studies. The temperature at which mice were housed is recorded in each figure legend. All in vivo procedures were performed at the temperature with which mice were acclimated – RT or TN, respectively.
Figure 1 – Trem2 deficiency enhances adipocyte hypertrophy and decreases transcriptional lipid signature in macrophages.
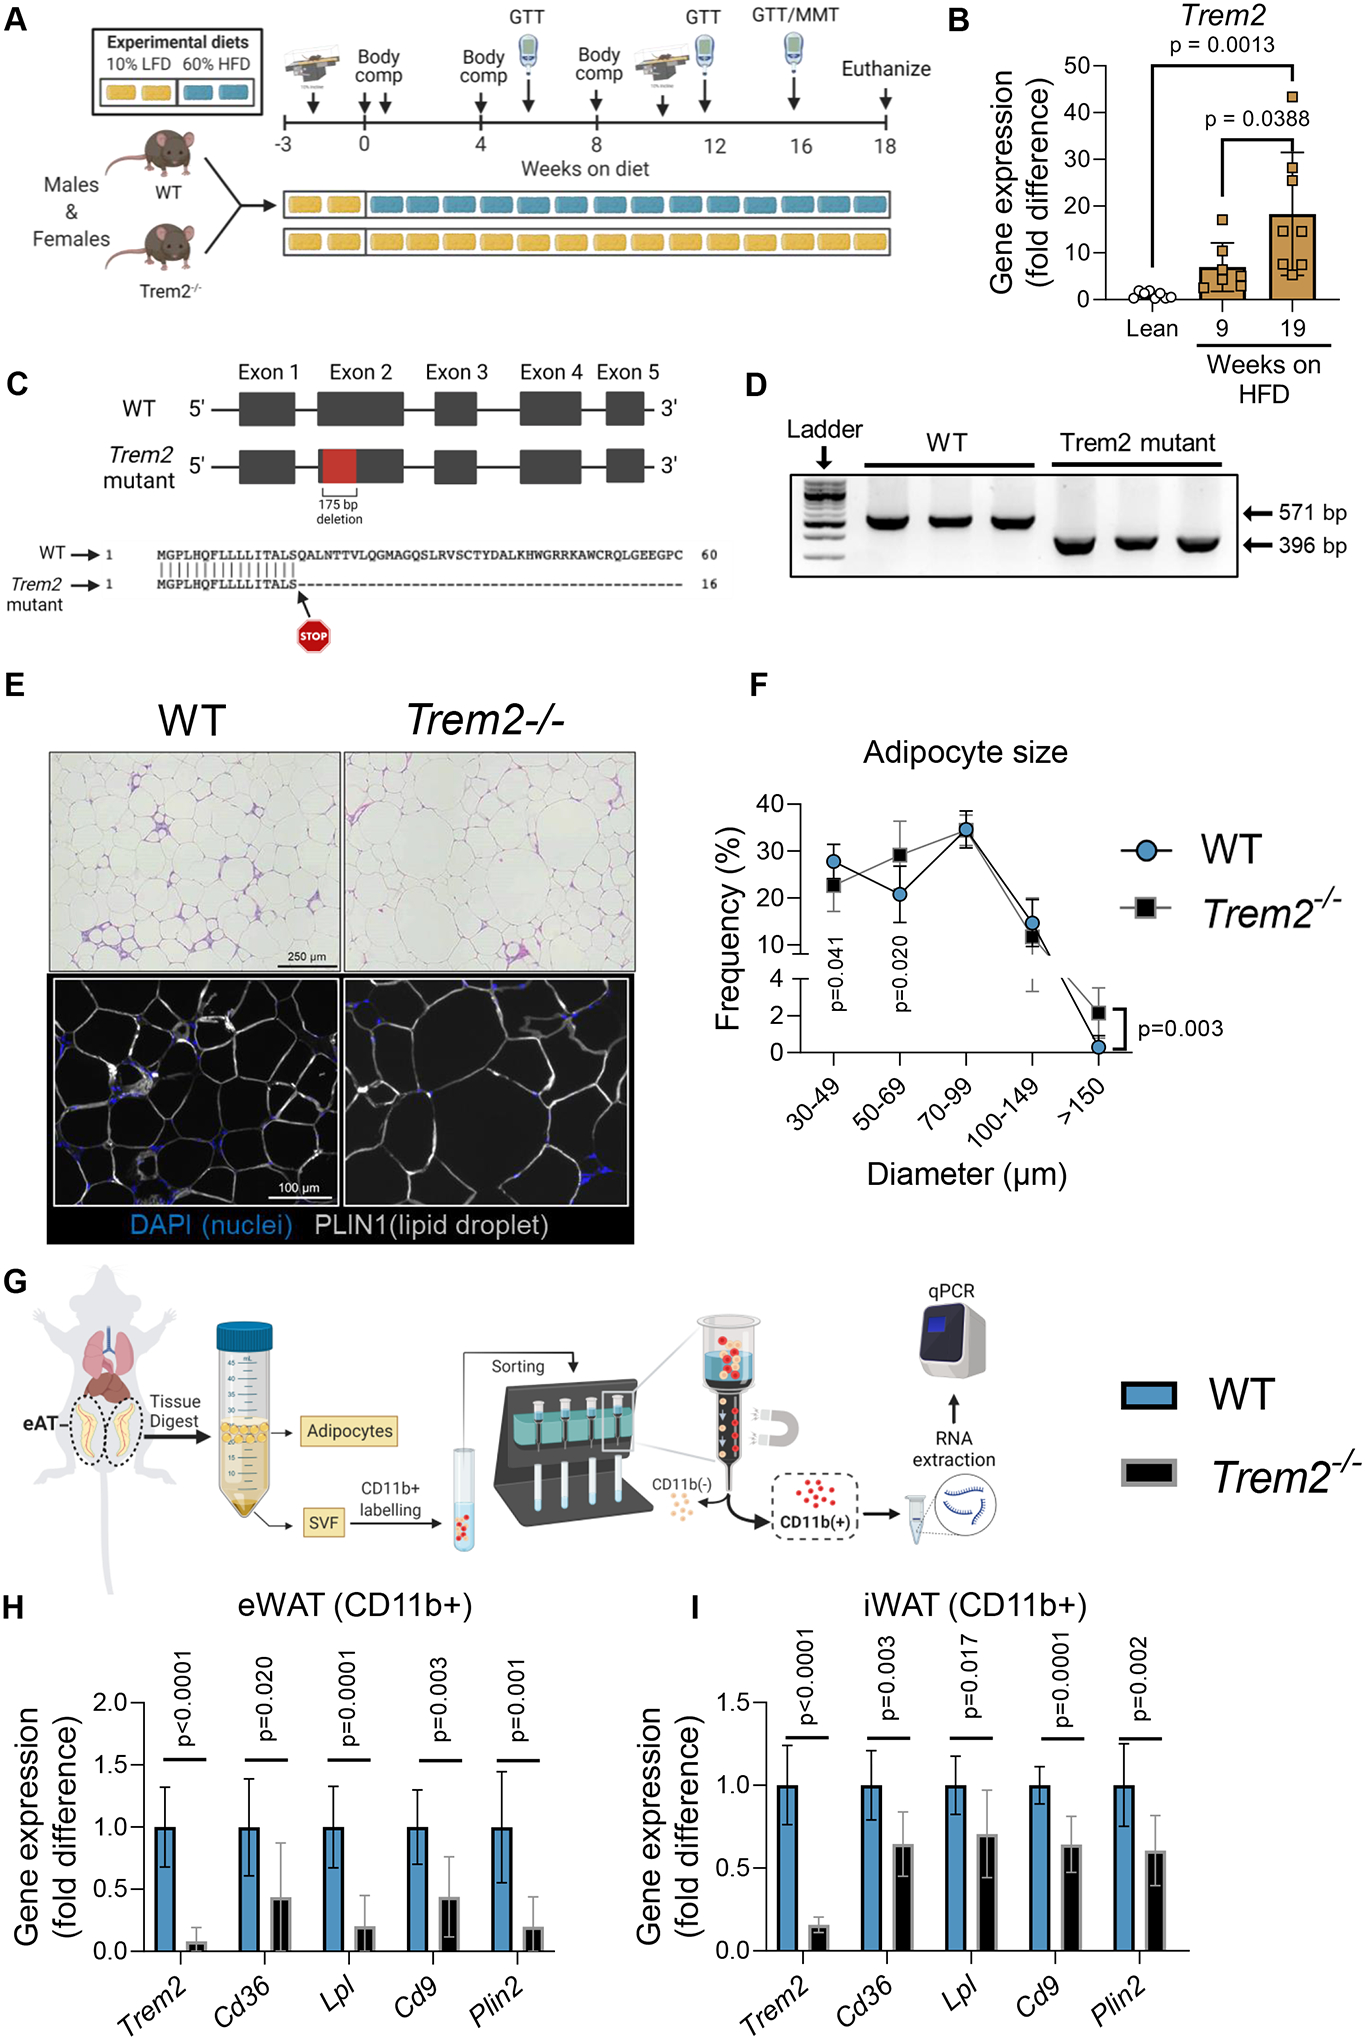
A) Primary study design. Male and female WT and Trem2−/− littermate mice were fed LFD or HFD for up to 18 weeks with frequent metabolic phenotyping. B) Trem2 qPCR of gonadal WAT after 9 weeks or 18 weeks of HFD feeding compared with lean controls. C) Representation of WT and Trem2−/− genomic DNA sequences. Trem2−/− animals (JAX#027197) are characterized by a 175 bp deletion within exon 2 resulting in an early stop within the cDNA after amino acid 17. D) PCR of WT and Trem2−/− gDNA confirming 175 bp deletion. E) Adipose tissue sections were generated and stained with H&E or DAPI/PLIN1 fluorescent antibodies to determine adipocyte size and morphological characteristics in 18 week HFD-fed mice. F) Adipocyte size distribution was computed using ImageJ, with sized adipocytes presented as diameter (μm). The frequency of a given bin size (e.g., diameter) was plotted on the y-axis. G) Epididymal and inguinal adipose tissue were isolated, digested, and separated by positive selection for CD11b+ macrophages in 18 week HFD-fed mice. H) qPCR was performed on CD11b+ fraction from epididymal adipose tissue and I) inguinal adipose tissue. One-way ANOVA was used to assess group differences for panel B with Tukey adjusted pairwise comparisons, (n=7–8/group). Independent t-tests were used to assess statistical differences between groups for panels F, H, and I, (n=7–9/group). Data are presented as mean ± SD. Graphics were generated using BioRender.com. Animal housing and experiments were conducted at room temperature (21–23°C). GTT, glucose tolerance test; MMT, mixed meal tolerance test; LFD, low fat diet, HFD, high fat diet; eWAT, epididymal adipose tissue; iWAT, inguinal adipose tissue. *p<0.05, **p<0.01
Body composition
Mouse body fat mass and fat free mass (FFM) were measured by a nuclear magnetic resonance whole body composition analyzer (Bruker Minispec).
Glucose tolerance testing
After a 5 h or 15 h fast basal blood glucose levels were measured (-10 min) followed by intraperitoneal (i.p.) glucose bolus (2.0 g dextrose/kg FFM) or oral gavage (3.0 g/kg FFM or 3.5 g/kg FFM). Blood glucose was sampled via tail cut at 15, 30, 45, 60, 90,120, and 150 minutes after injection using a hand-held glucometer (Bayer Contour Next EZ meter). Glucose area under curve from baseline was calculated using the trapezoidal rule. Another group of WT versus Trem2−/− littermates mice were housed at RT or TN temperatures for 4 weeks while fed LFD. At week 4 mice were challenged with an oral glucose load (3.5g/kg FFM) and glucose concentrations were determined.
Meal tolerance testing & arterial catheterization
After 15 weeks of HFD feeding, a subgroup of male and female mice underwent carotid artery catheterization. The Vanderbilt Mouse Metabolic Phenotyping Center (VMMPC) performed surgeries. Detailed procedures are available at the following website (www.vmmpc.org). One week after surgery, mice were challenged with a mixed meal test (EnsurePlus®, 1.48 kcal/mL; dose = 12 kcal/kg body weight). After a 5 h fast, a baseline blood sample was obtained, after which animals were administered the liquid meal via oral gavage. Blood was collected at −10, 10, 60, 120, and 180 min. Plasma glucose, insulin, NEFA, and triglycerides were determined.
Insulin tolerance testing
A subset of animals underwent an insulin tolerance test after 8 weeks on HFD. Following a 4 h fast, baseline blood glucose was measured. An insulin bolus (Novolin® R, 0.75 U/kg body weight) was injected i.p. and glucose was measured at 5, 10, 15, 20, 25, and 30 min post injection. The AUC from baseline was computed.
Blood chemistry
Blood glucose was measured via hand-held glucometer (CONTOUR®NEXT EZ). Plasma non-esterified fatty acids (NEFA) (Wako HR series NEFA-HR, FUJIFILM Wako Diagnostics USA), triglycerides (L-Type Triglyceride M Assay, FUJIFILM Wako Diagnostics USA), and glycerol (SIGMA-ALDRICH #MAK117–1KT, St. Louis, MO, USA) were determined via colorimetric assay according to manufacturer’s instruction. Plasma insulin was determined via radioimmunoassay (Millipore Cat. # PI-13K, Hormone Assay and Analytical Services Core, Vanderbilt University Medical Center, Nashville, TN).
Exercise testing
Prior to exercise testing animals were acclimated (10–15 min in duration) on 2–3 occasions to a belt treadmill (Columbus Instruments, Columbus, OH). Mice were placed on the treadmill for 10 min without belt movement (0 m/min). Thereafter, the belt was turned on and mice ran ‘sub-maximally’ at 10 m/min (5% grade) for 10 min. The 2nd acclimation session consisted of 15 min of exercise at 10 m/min (15% grade). If a 3rd acclimation session was performed it was a replication of the 2nd session. The exercise session was at least 48 h after the last acclimation bout.
Exercise tolerance:
The speed of the treadmill was set at 10 m/min with 10 degrees incline. Treadmill speed was increase by 4 m/min every 3 minutes until exhaustion. An electrical grid is located at the end of the end of the treadmill. The electrical stimulus was set at 163 volts with a stimulus rate of 4 pulses/sec. The amperage was set at 1.0 milliamps. Animals were determined to be exhausted, if they refused to continue running and remained on the grid for more than 5 seconds, upon which they were immediately removed.
Exercise endurance:
The speed of the treadmill was set to 50–55% of a mouse’s maximal running speed (obtained from exercise tolerance test). Following a brief warm-up, mice ran at a constant speed for 90 min. If mice exceeded 90 min running time, the speed was increased 10–20% until mice were fatigued. In another group of mice, a fixed speed of 15 m/min (10% grade) until exhaustion (approximately 90 min) was performed in lean WT mice to establish whether Trem2 expression is responsive to an acute bout of exercise in epididymal and inguinal adipose tissue (Fig. S1A).
Voluntary physical activity:
A voluntary wheel running test was conducted over a 48h period. Mice were single housed during the observation period and recombined with cage-mates after the test. Mice were transferred to a cage containing a running wheel that was physically locked for a 24-h habituation period. The following day the wheels were unlocked and animals were allowed to run voluntarily. Wheel distance and average speed was recorded using a computer odometer (Artyea KINGMAS LCD Bicycle Bike Computer Odometer Speedometer Sd-548b).
Immunohistochemistry and Fluorescence Microscopy
Epididymal adipose tissue sections were fixed in 4% PFA for three h and transferred to 70% ethanol at 4°C. Paraffin embedded sections were stained with H&E or immunolabeled with PLIN1 (Cell Signaling Technology, #3470, 1:1000 dilution), goat anti-rabbit IgG secondary (Abcam, Alexa Fluor® 647, #ab150079, 1:1000 dilution) and DAPI (Thermofischer, #62247, 1:4000 dilution). Slides were imaged using either a 10X objective on a Leica DMI8 widefield microscope and captured with a Leica DFC9000GT camera. Adipocyte sizing was performed as previously described (Cottam et al., 2022).
Adipose tissue macrophage isolation
Mice were euthanized by isoflurane overdose and cervical dislocation followed by perfusion with 20 ml PBS through the left ventricle. Epididymal and inguinal adipose tissue depots were excised, minced, and digested in 6 ml of 2-mg/mL type II collagenase (Worthington # LS004177) for 30 min at 37°C. Digested adipose tissue was then vortexed, filtered through 100 μm filters, and lysed with ACK buffer, and filtered through 35 μm filters as previously described (Winn et al., 2021). The stromal vascular fraction was incubated with anti-CD11b microbeads (Miltenyi) and positive selection was performed using gravity operated magnetic columns. The positive fraction (CD11b+ cells) was collected, washed 3 x with 1X PBS 1% FBS, and reconstituted in RLT lysis buffer (Qiagen #1015750) supplemented with 1% betamercaptoethanol. Samples were flash frozen and stored at −80°C until analysis.
RNA isolation, cDNA synthesis, and real-time RT-PCR
Tissues or cells were homogenized and lysed in RLT buffer (Qiagen #1015750) with 1% betamercaptoethanol. Equal parts isopropanol and RNA-containing sample were transferred to a clean 1.5 mL tube. Purified RNA was reverse transcribed by iScript RT (Bio-Rad, Hercules, CA) into cDNA. Differences in relative gene expression were quantified using FAM-conjugated TaqMan Gene Expression Assay (Life Technologies). PCR reactions were performed in duplicate under thermal conditions as follows: 95°C for 10 min, followed by 40 cycles of 95°C for 15 s, and 60°C for 45 s. Data were normalized to Gapdh. mRNA expression values were calculated by the −ΔΔ cT method.
Statistical Analyses
Student’s t-tests were run for between group comparisons. In experiments that contained more than two groups, one-way analysis of variance (ANOVA), two-way ANOVA, or three-way ANOVA models were conducted with pairwise comparisons using Tukey or Sidak correction. Brown-Forsythe correction was applied to groups with unequal variance. Data are presented as mean ± standard deviation (SD). An adjusted p value of <0.05 was used to determine significance.
RESULTS
Trem2 deficiency enhances adipocyte hypertrophy and decreases transcriptional lipid signature in macrophages
Lipid associated macrophages are highly abundant in states of adipose tissue expansion and are defined by expression of Trem2 in humans and rodents (Cottam et al., 2022; Jaitin et al., 2019; Sharif et al., 2021). Indeed, a linear increase in Trem2 expression manifests in response to diet induced obesity in adipose tissue (Fig. 1A–B). The 175 bp deletion in Trem2−/− mice was confirmed by PCR on genomic DNA isolated from the kidney of both WT and Trem2−/− mice. (Fig. 1C–D). Adipose tissue microscopy demonstrated that Trem2 null mice did not have greater mean adipocyte size (WT, 70±1.5 μm versus Trem2−/−, 72±2 μm, p=0.4) but the proportion of extremely large (>150μm diameter) adipocytes was significantly greater relative to body weight matched controls (Fig. 1E–F), which was consistent across multiple animals (Fig. S1). This is similar to what was previously observed in other Trem2−/− models (6, 8). Gene expression from sorted myeloid cells (CD11b+) in epididymal and inguinal adipose tissue using positive selection (Fig. 1G) showed an 8-fold knockdown of Trem2 compared with WT animals. Similarly, genes associated with LAMs (Cd36, Lpl, Cd9, and Plin2) were decreased in Trem2 knockout cells providing additional support for loss of Trem2 function (Fig. 1H–I). Together, these data confirm the predicted phenotype from loss of Trem2 in adipose tissue macrophages.
Loss of Trem2 does not impair glucose homeostasis or insulin tolerance
To determine the metabolic consequences of Trem2 ablation, male and female WT and Trem2−/− mice were fed LFD or HFD diet for 18 weeks. No differences in body weight gain, feeding efficiency, or body fat mass were found between genotypes regardless of diet (Fig. 2A–F). Glucose tolerance was assessed at 12 and 16 weeks on diet. Blood glucose clearance was delayed in HFD versus LFD animals in both males and females, but Trem2 deletion did not worsen glucose tolerance after 12 weeks or 16 weeks of diet feeding, respectively (Fig. 2G–J). Given the discrepancy in glucose tolerance between the present study and previous reports (Jaitin et al., 2019; Sharif et al., 2021), we examined more closely the assessment of glucose tolerance in previous publications. Each prior study fasted mice overnight (12–16 hours). Overnight fasting induces a catabolic state and enhances insulin action and glucose clearance in mice (Andrikopoulos et al., 2008; Ayala et al., 2006; Ayala et al., 2010; McGuinness et al., 2009). Thus, to determine whether this catabolic state was necessary to unmask loss of Trem2-induced glucose intolerance, we overnight fasted a group of non-littermate WT and Trem2−/− male mice fed HFD for 16 weeks and performed an ipGTT. First, glucose tolerance was determined at 6 weeks and 12 weeks of HFD feeding in the same cohort of mice to establish the change in glycemic control over time in Trem2−/− after short-term fasting (5h). No differences between genotypes were noted (Fig. 3A). ipGTT was conducted at 16 weeks of HFD feeding preceded by a 15h fast. Despite replicating fasting conditions from previous studies, we did not find worsened glucose tolerance in diet-induced obese Trem2−/− mice (Fig. 3A). There was a trend (GTT AUC, p=0.078) for greater glucose clearance in Trem2−/− than non-littermate WT control mice. In the same cohort of animals, fasting insulin and NEFA concentrations were not different between genotypes after 6 weeks, 12 weeks, or 16 weeks of diet feeding (Fig. 3B–C).
Figure 2 – Loss of Trem2 does not impair glucose homeostasis.
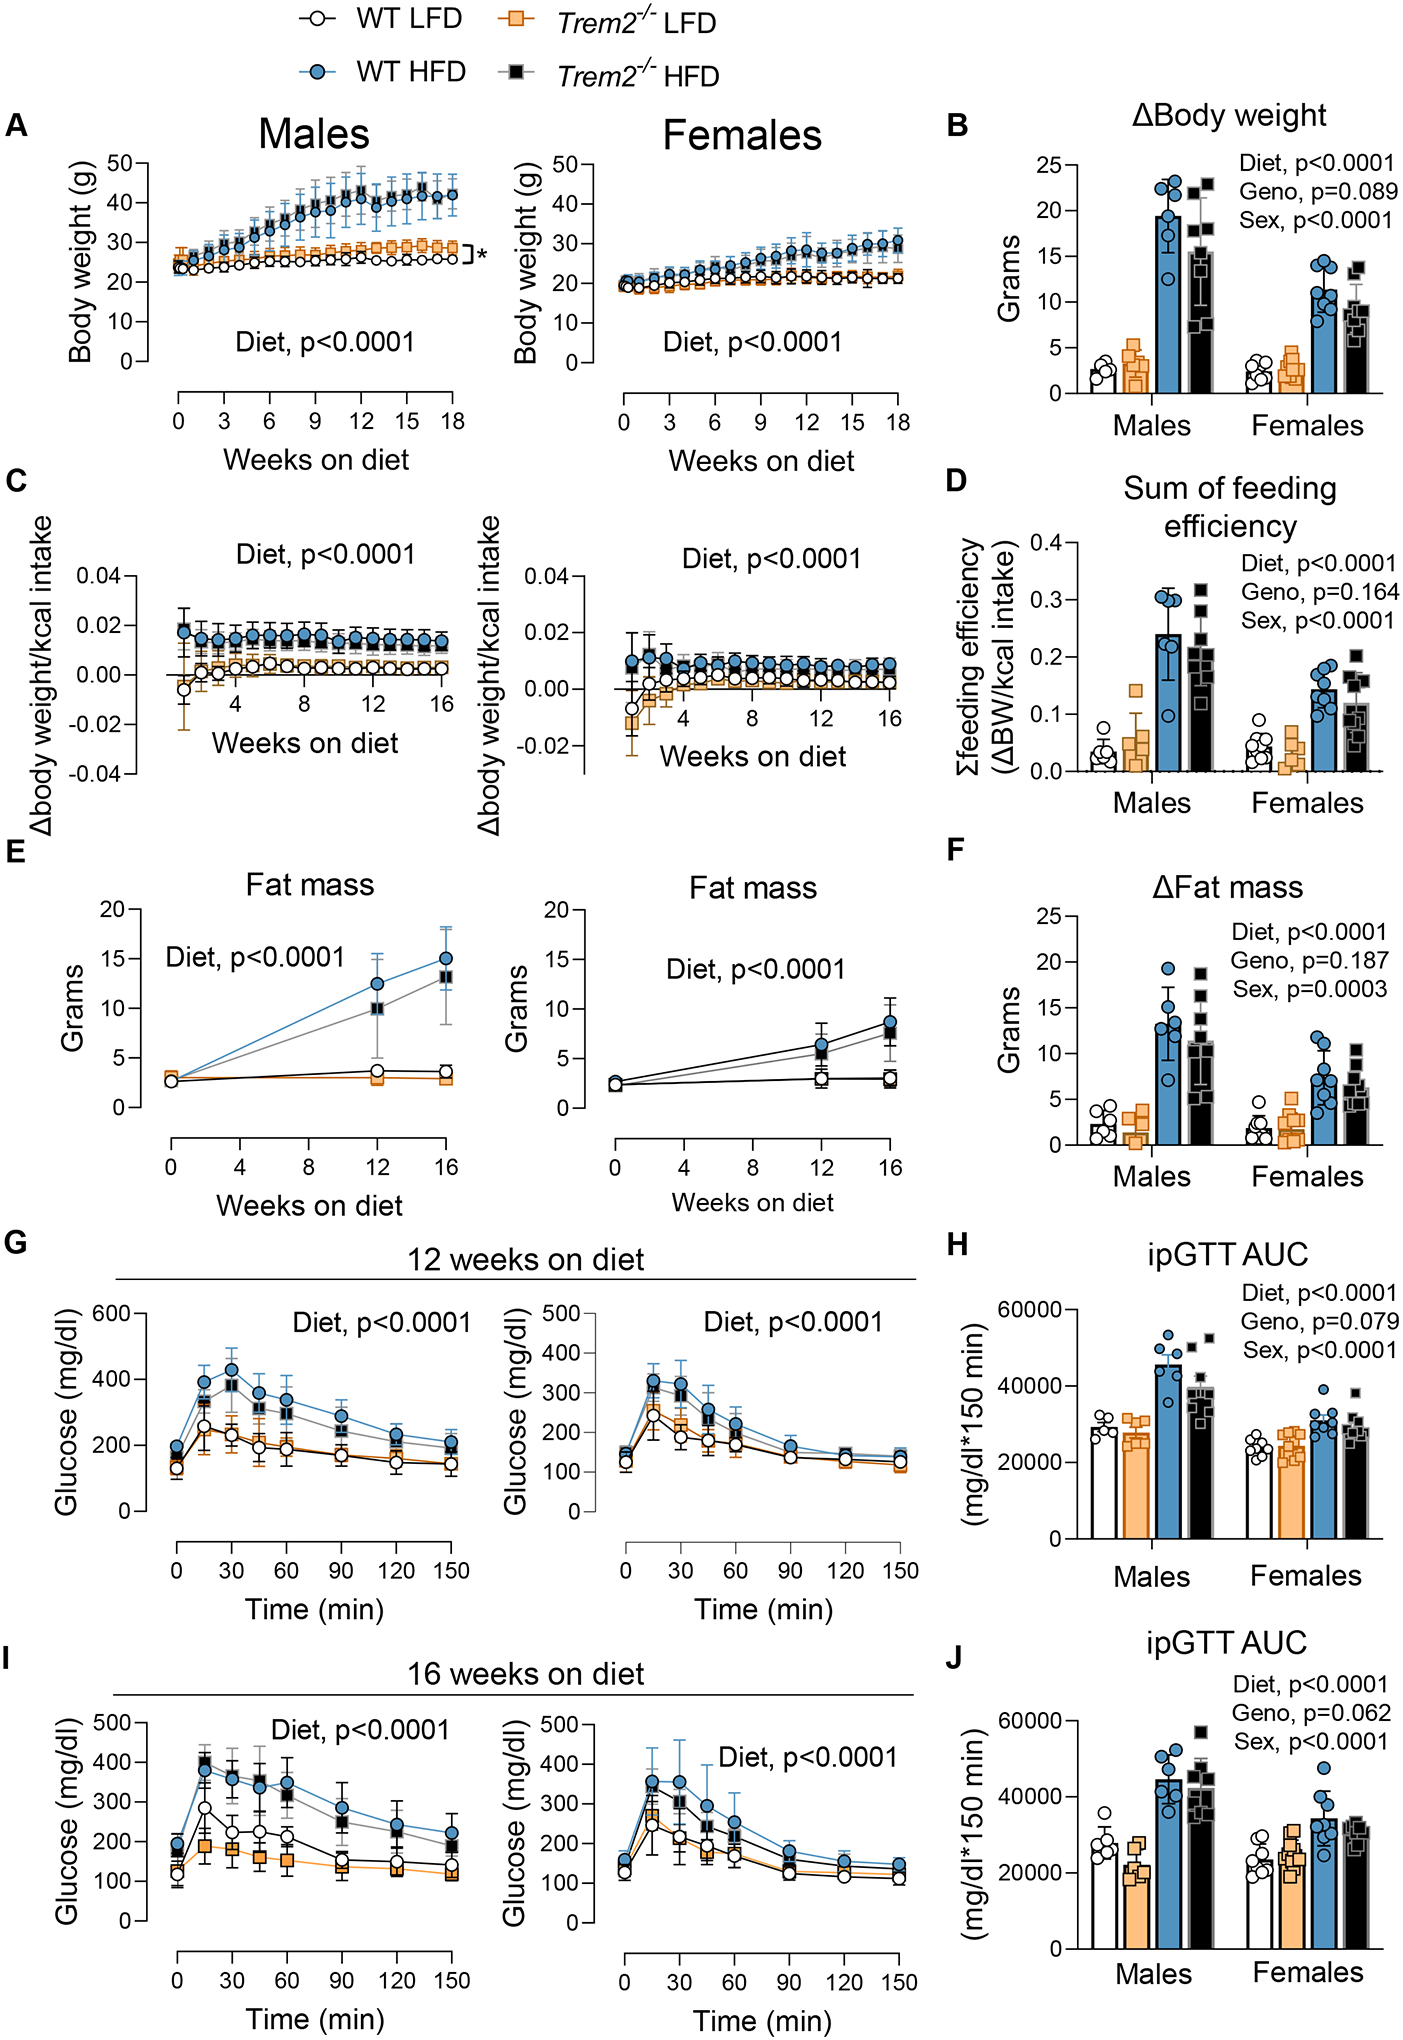
Male and female WT and Trem2−/− mice were fed LFD or HFD diet for up to 18 weeks. A) Weekly body mass was recorded throughout the feeding paradigm and B) the change in body weight from week 0 to week 18 was computed. C) Feeding efficiency was calculated throughout the study (feeding efficiency = change in weekly body weight per energy intake) and D) the sum of weekly feeding effcieincy was computed. E) Fat mass was measured over time via EchoMRI in addition to F) the fat mass delta from baseline. ipGTT was performed following a 5h fast G&H) at 12 weeks and I&J) 16 weeks of diet intervention (n=6–8/group). Two-way repeated measures ANOVA with time and group (diet and genotype) as factors were conducted for panels A, C, E, G and I (n=6–8/condition). Multiple comparisons were assessed using Tukey post hoc testing. Three-way ANOVA was used to assess group differences for panel B, D, F, H, and J with Tukey adjusted pairwise comparisons (n=6–8/group). Blood was collected from the tail for these experiments. Graphics were generated using BioRender.com. All mice used in these experiments were littermates. Animal housing and experiments were conducted at room temperature (21–23°C). Data are presented as mean ± SD. LFD, low fat diet; HFD, high fat diet; ipGTT, intraperitoneal glucose tolerance test; AUC, area under the curve. *p<0.05
Figure 3 – Neither extended fasting nor oral glucose challenge worsens glucose tolerance in Trem2−/− mice.
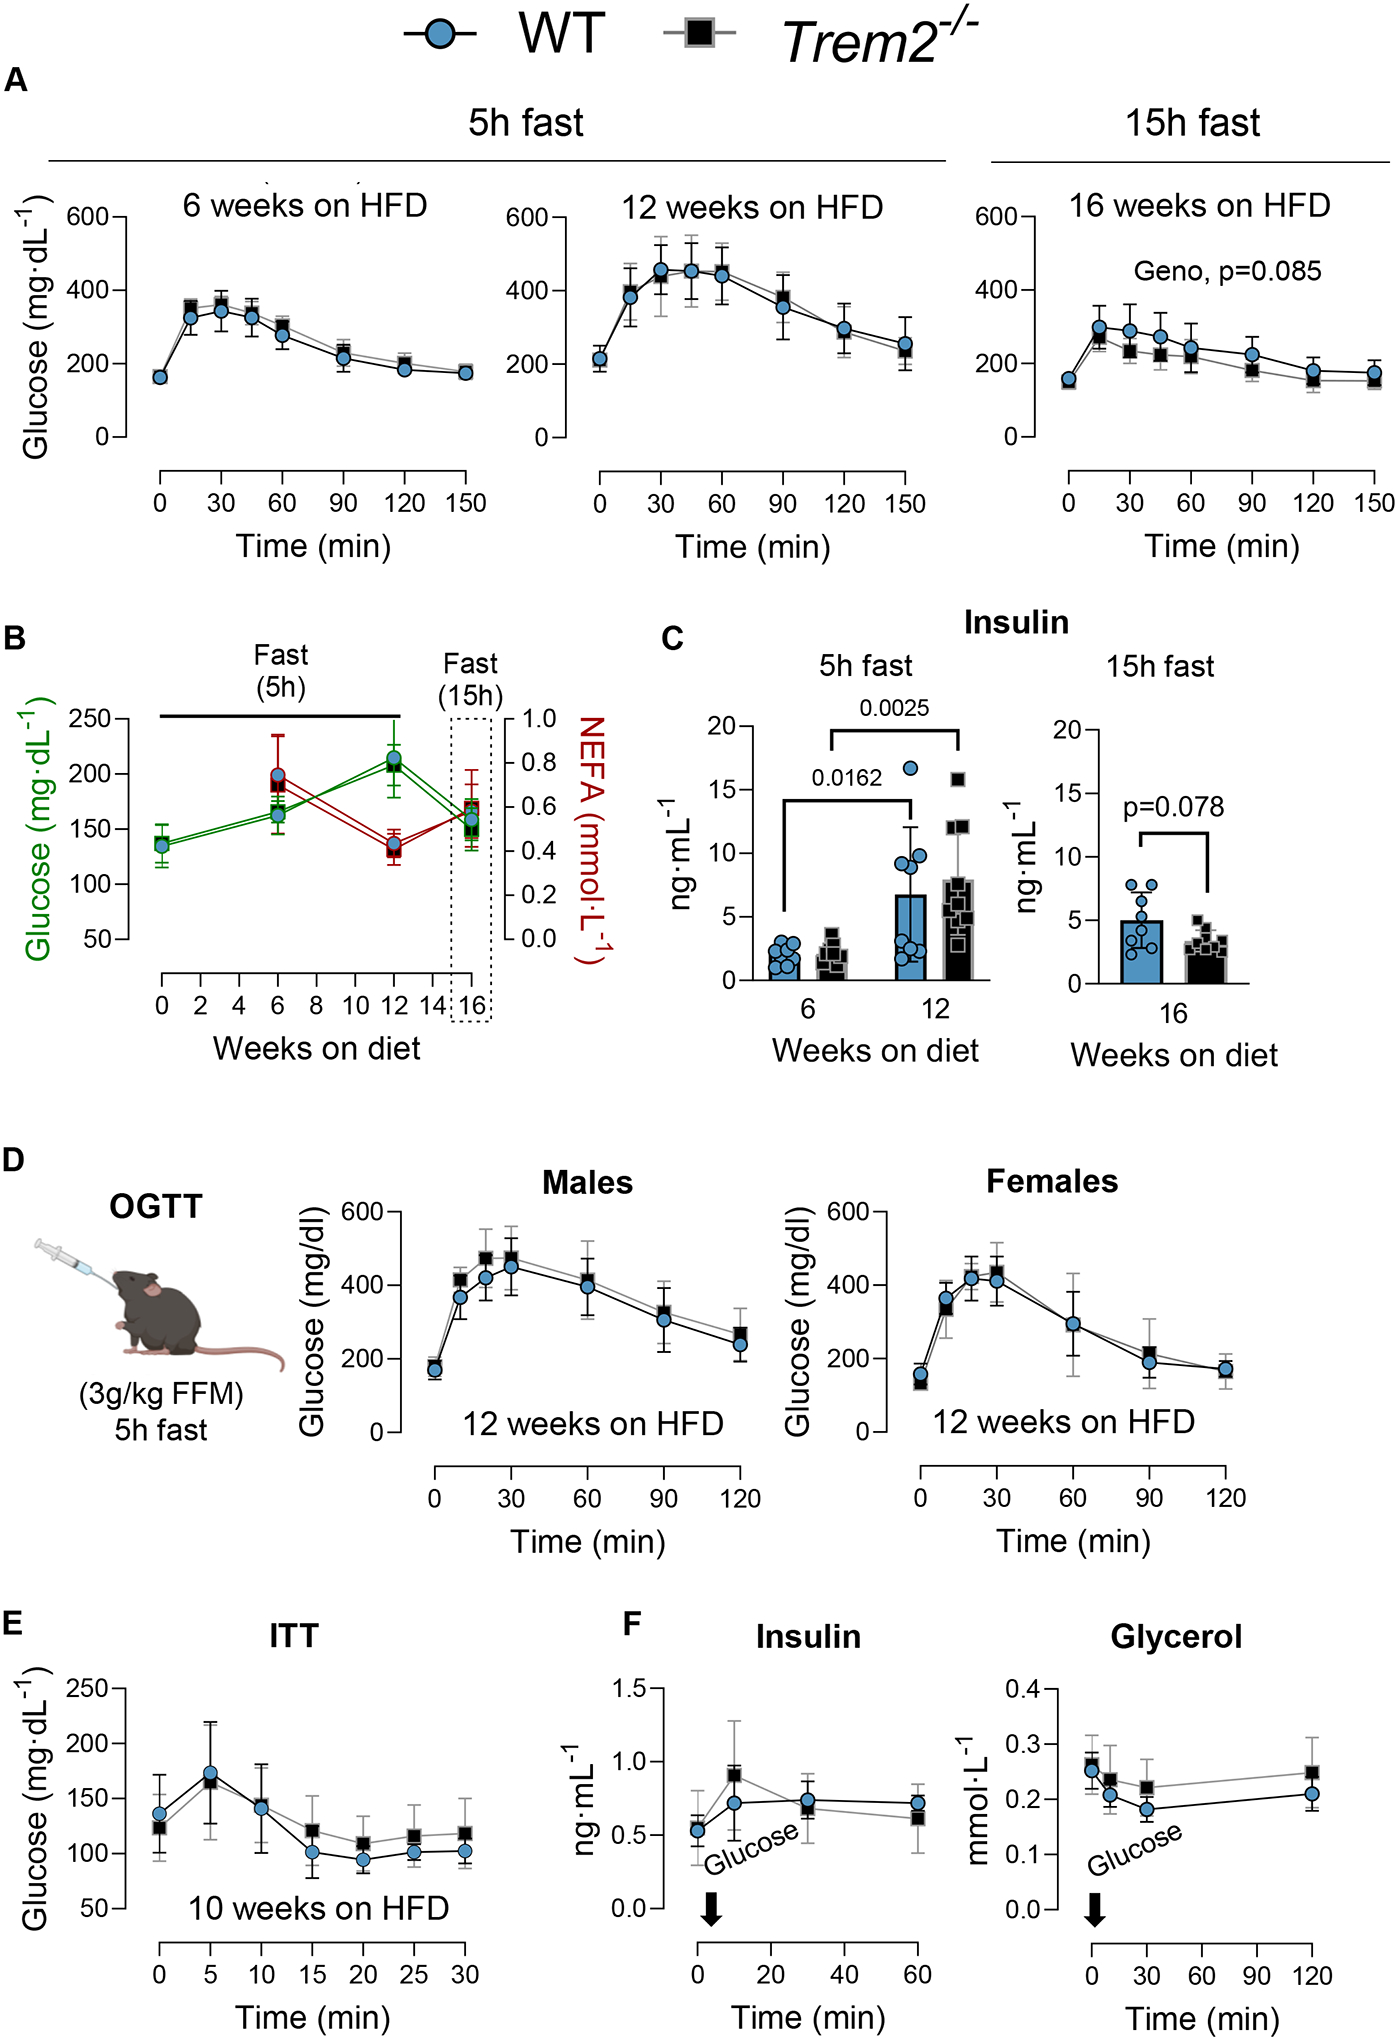
Male Trem2−/− and WT mice were fed HFD diet for 16 weeks. A) ipGTT was performed after 6 and 12 weeks on HFD diet after a 5h fast. Another ipGTT was conducted at 16 weeks on HFD diet after a 15 h fast. B) Fasting glucose, NEFA, and C) plasma insulin concentrations were measured throughout diet feeding after either a 5 h of 15 h fast. D) oral glucose tolerance test (OGTT) was performed in male and female mice after 12 weeks on HFD diet and a 5 h fast. E) Insulin tolerance test (ITT) was performed after 10 weeks of HFD feeding in WT versus Trem2−/− mice. Following a 4 h fast and basleine glucose measurement, insulin was injected i.p. (0.75 U/kg body weight) and glucose readings were collected frequently for 30 minutes. F) Insulin and glycerol response to a glucose challenge. After 8 weeks of HFD, mice were fasted for 5 h and gavaged with glucose (3.5g/kg FFM) to determine physiological suppression of plasma glycerol (a proxy for lipolysis). Blood was sampled from a carotid artery catheter. Two way repeated measures ANOVA with time and genotype as factors were conducted for panels A, B, C, and D (n=6–9/condition). Multiple comparisons were assessed using Tukey post hoc testing. Two-way ANOVA with genotype and sex as factors was conducted for panel E with Tukey adjusted pairwise comparisons (n=6–8/group). In panels A, B, and C Trem2−/− mice were purchased directly from JAX and age-matched C57BL/6J mice were used as controls. Blood was collected from the tail for these experiments. Animal housing and experiments were conducted at room temperature (21–23°C). In panels D-F, mice are littermates. Graphics were generated using BioRender.com. Data are presented as mean ± SD. HFD< high fat diet; OGTT, oral glucose tolerance test; FFM, fat free mass. *p<0.05, **p<0.01
Since the route of glucose administration can affect kinetics of glucose appearance and disappearance from circulation (Small et al., 2022), and given that a previous publication found impaired glucose tolerance in Trem2−/− mice after oral gavage (Sharif et al., 2021), we conducted an oral glucose tolerance test (OGTT) in obese male and female mice after 12 weeks of HFD feeding. Neither obese male nor female Trem2−/− mice had differences in blood glucose responses compared to WT controls (Fig. 3D). After 10 weeks on HFD insulin tolerance was determined and was not different between groups (Fig. 3E). In addition, a physiological glucose stimulated suppression of glycerol as a proxy for whole-body lipolysis was performed. Neither fasting nor insulin-mediated glycerol suppression were different between groups (Fig. 3F), although the percent glycerol suppression approached significance (WT, 26.8±3.1 and Trem2−/−, 15.5±4.5%, p=0.06).
Trem2 ablation augments feeding efficiency at thermoneutrality but does not decrease glucose tolerance
The ambient temperature at which an animal is housed exerts a profound effect on energy metabolism and glucose utilization. Indeed, energy expenditure of mice housed at RT is 50–100% higher than animals housed at TN (Fischer et al., 2018; Winn et al., 2019). Thus, we determined whether glucose tolerance was different between Trem2−/− and WT mice in thermoneutral conditions. Mice of each genotype were housed at RT (22°C) or TN (29°C) while consuming LFD diet for three weeks and glucose tolerance was assessed (Fig. 4A). Body weights were similar between genotypes at the start of temperature exposure and did not differ over the 3-week period (Fig. 4B). Trem2−/− mice had higher feeding efficiency than WT mice at thermoneutrality while consuming LFD diet (Fig. 4C–D), suggesting higher fat balance, whereas no genotypic differences in energy homeostasis were found at standard RT. Oral glucose tolerance was not different between genotypes (Fig. 4F). Postprandial insulin was higher in animals housed under TN conditions, but no differences between Trem2−/− and WT mice were observed (Fig. 4G).
Figure 4 – Trem2 ablation augments feeding efficiency at thermoneutrality but does not decrease glucose tolerance.
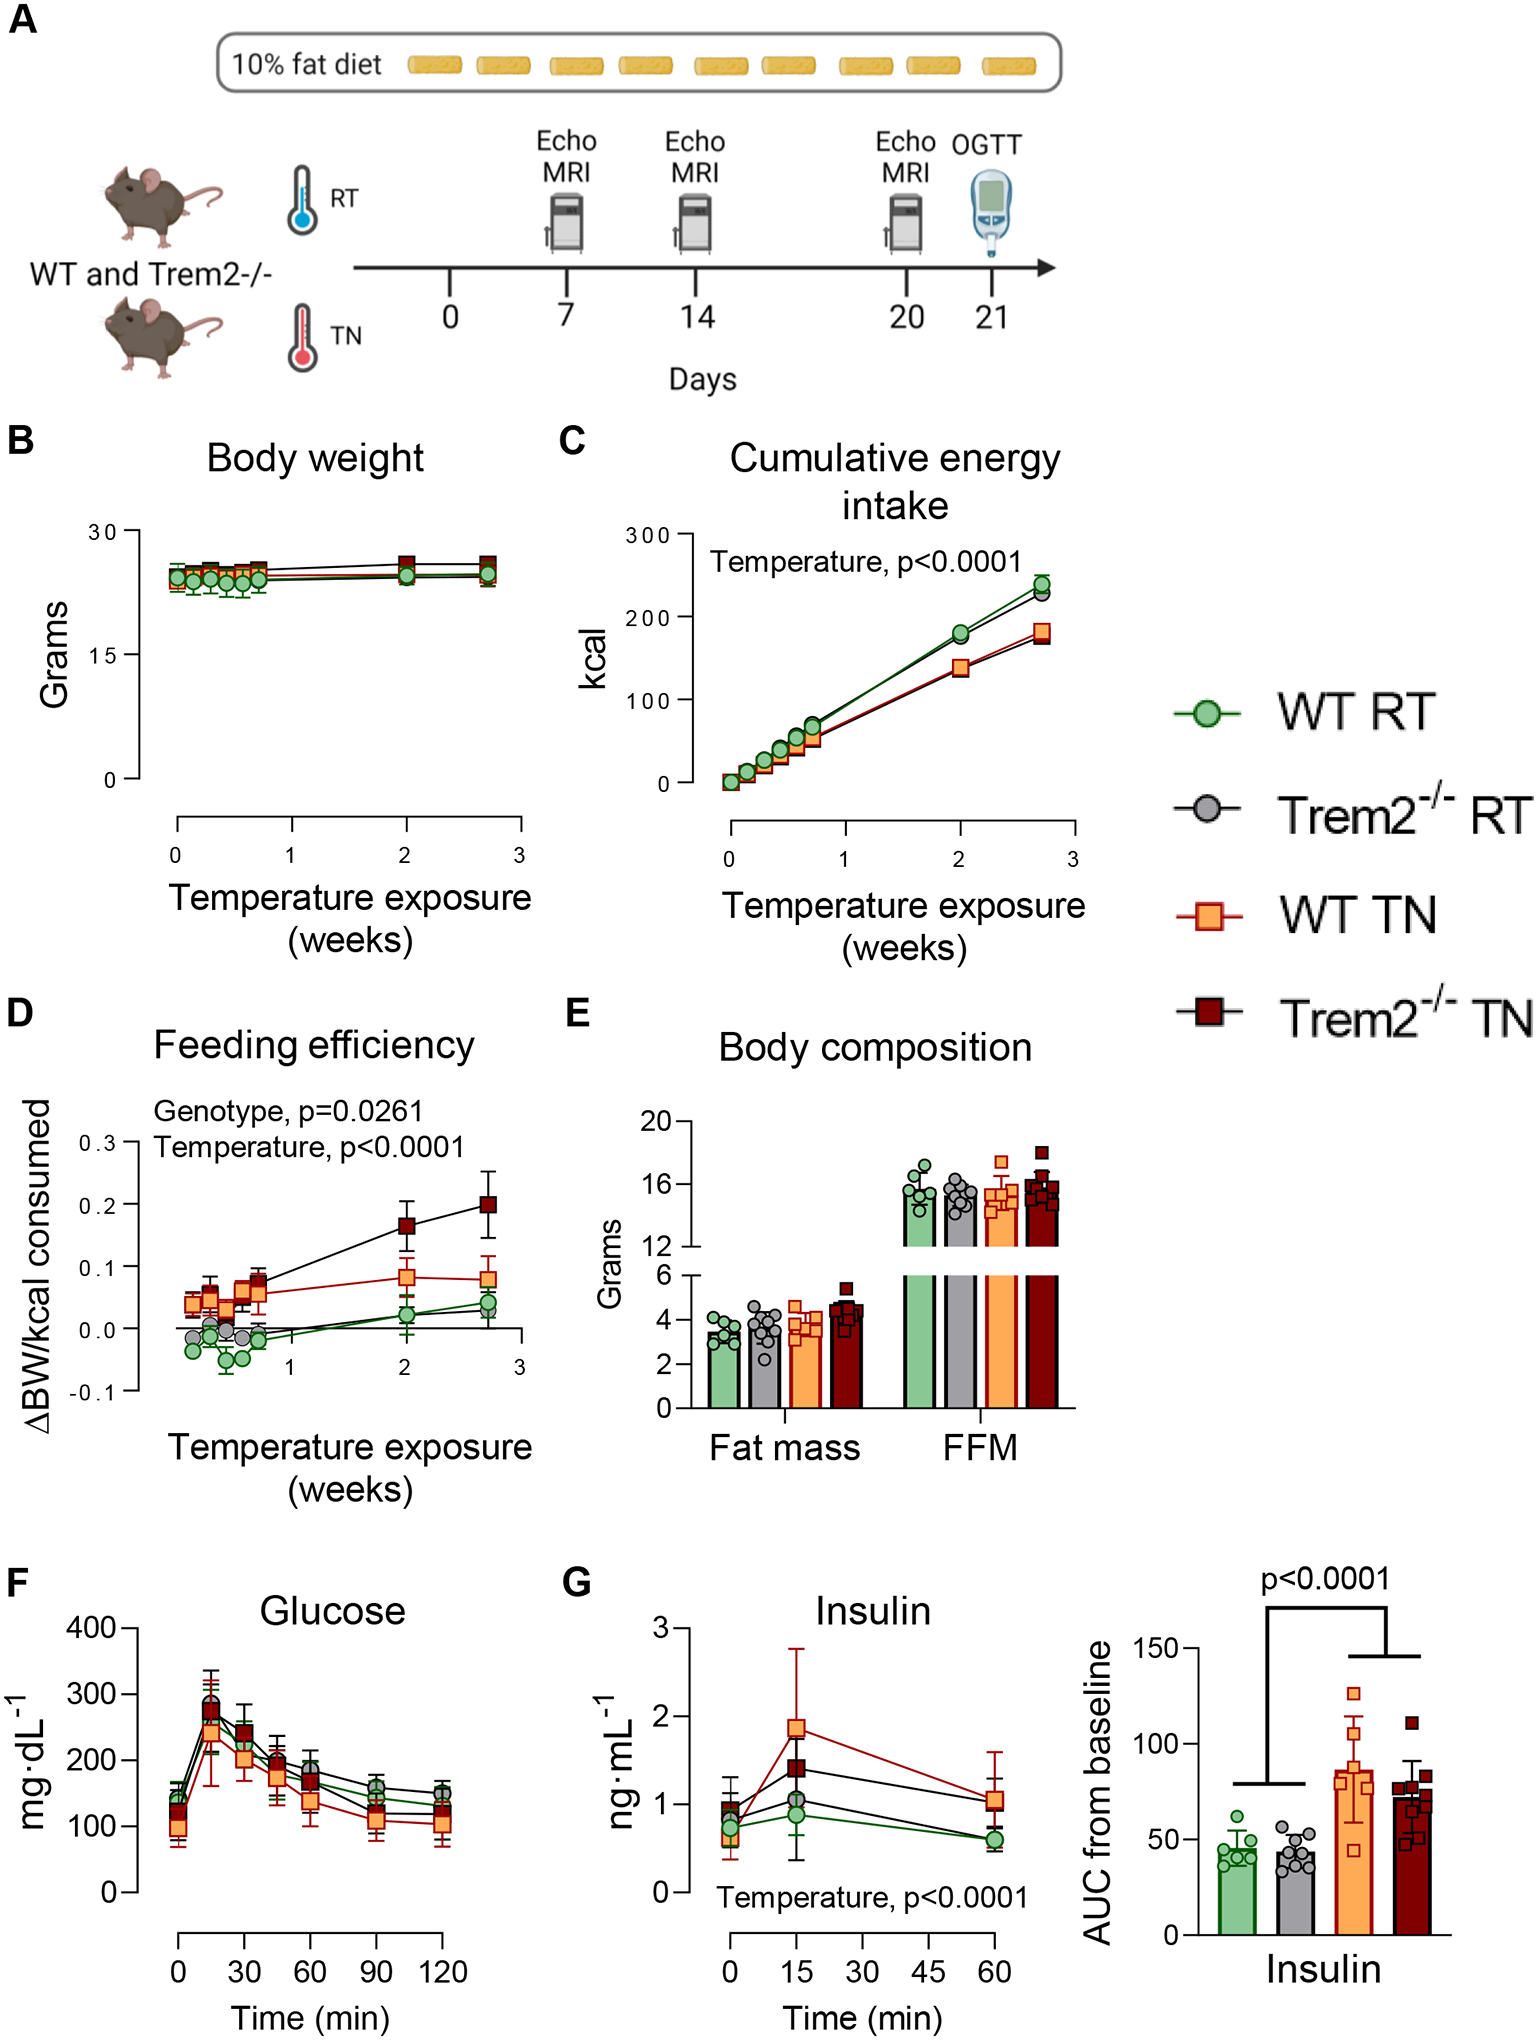
A) Male Trem2−/− and WT mice were fed LFD diet for three weeks at standard room temperature (RT) or thermoneutrality (TN). B) Body weight, C) cumulative energy intake, and D) feeding efficiency were recorded frequently over time. After 21 days of temperature exposure E) body composition and F) OGTT were performed. G) Plasma insulin levels and insulin AUC were assessed. Two-way repeated measures ANOVA with time and group (genotype and housing temperature) as factors were conducted for panels B, C, D, F, and G (n=6–9/condition). Multiple comparisons were assessed using Tukey post hoc testing. Two-way ANOVA with genotype and housing temperature as factors was conducted for panel E and G (insulin AUC), with Tukey adjusted pairwise comparisons (n=6–9/group). All mice used in these experiments were littermates. Blood was collected from the tail for these experiments. Animal housing and experiments were conducted at the temperature with which mice were acclimated (RT, 22°C or TN, 29°C). Graphics were generated using BioRender.com. Data are presented as mean ± SD. RT, room temperature; TN, thermoneutral.
Mixed meal tolerance is not worsened by loss of Trem2
In a subset of obese mice, we next tested whether mixed meal substrate clearance was impaired by Trem2 deficiency. Mice were surgically implanted with carotid artery catheters and gavaged orally with a liquid meal (12 kcal/kg body weight) one week after surgeries (Fig. 5A). Neither fasting glucose nor postprandial glucose were different between genotypes (Fig. 5B). Insulin concentrations in the fasting and fed states did not differ between groups (Fig. 5C). Fasting NEFA and fasting triglycerides were slightly higher in WT animals but this did not reach statistical significance. Postprandial NEFA and triglycerides were similar between WT and Trem2−/− mice (Fig. 5D–E).
Figure 5 – Mixed meal tolerance is not worsened by loss of Trem2.
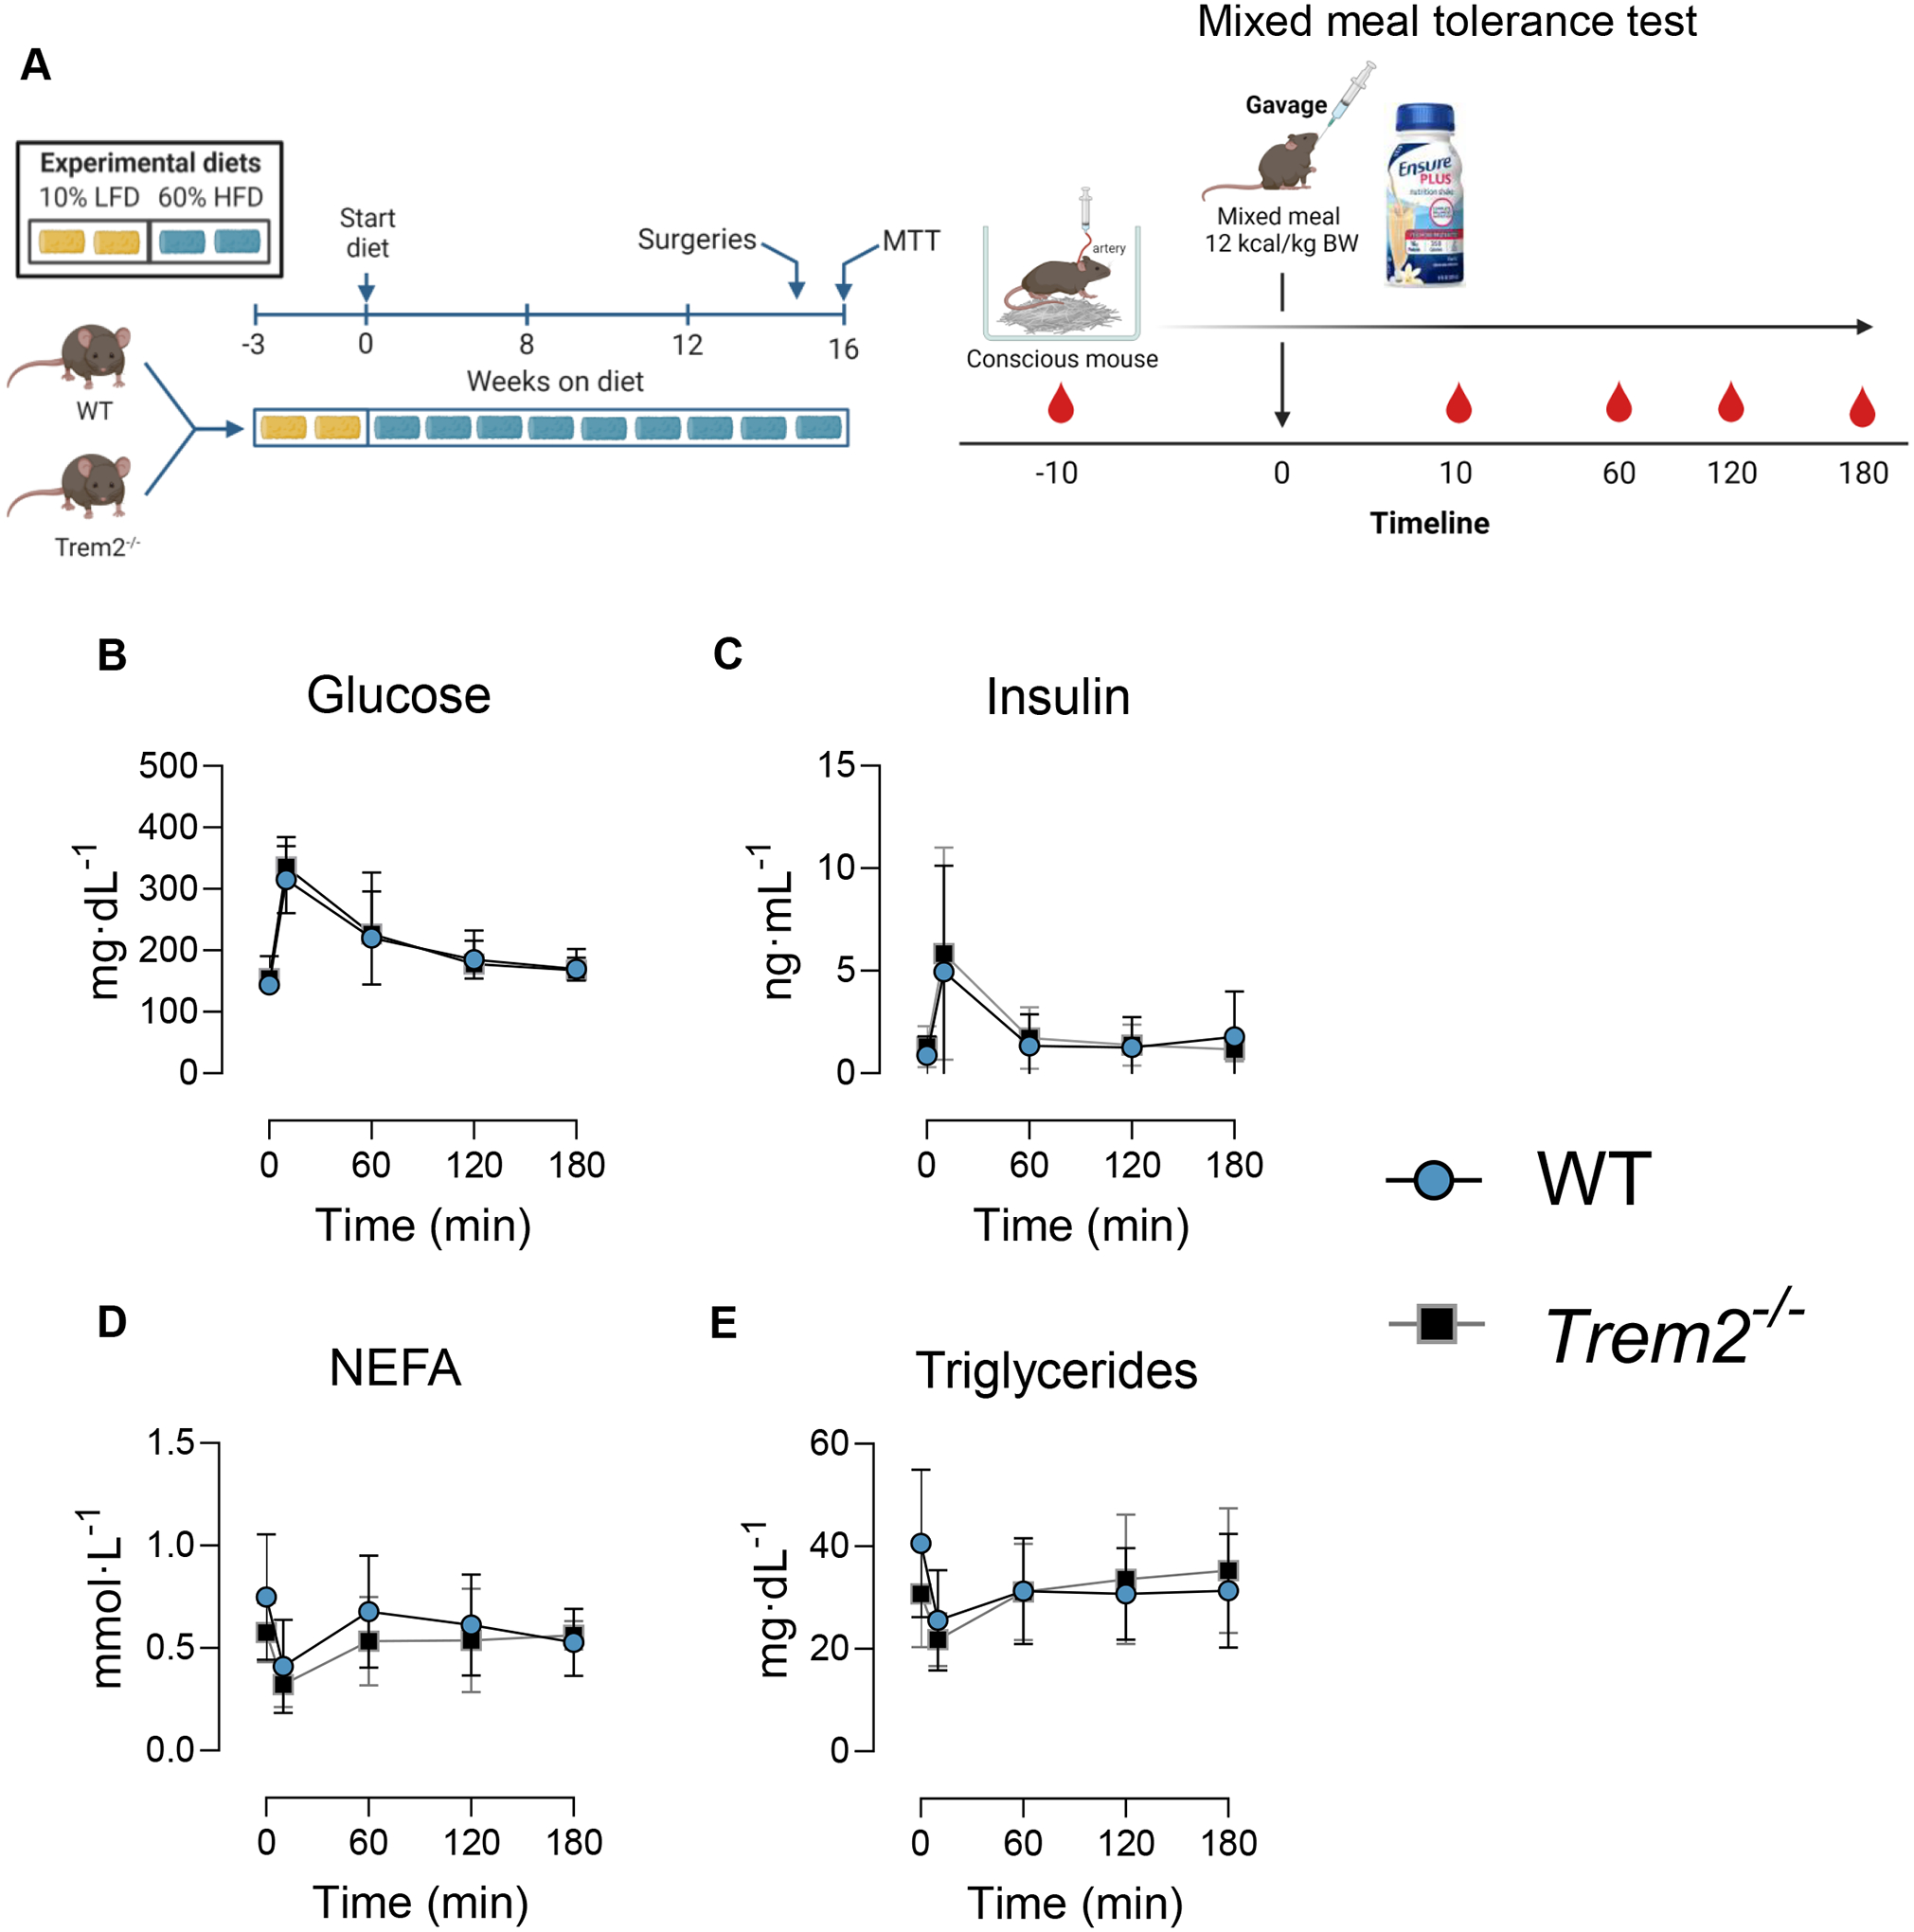
A) After 15 weeks of HFD feeding mice were surgically implanted with carotid artery catheters. Following one week of recovery, 5 h-fasted animals were challenged with an oral mixed meal (Ensure® 12 kcal/kg body weight). B) blood glucose, C) plasma insulin, D) plasma NEFA, and E) plasma triglycerides were determined in fasted and postprandial states. Two-way repeated measures ANOVA with time and genotype as factors were conducted for panels B-E (n=6–8/condition). Multiple comparisons were assessed using Tukey post hoc testing. All mice used in these experiments were littermates. Blood was collected from the carotid artery in an unrestrained and non-anesthetized animal. Animal housing and experiments were conducted at room temperature (21–23°C). Graphics were generated using BioRender.com. Data are presented as mean ± SD. NEFA, non-esterified fatty acids; MTT, mixed meal tolerance test.
Trem2 deletion does not limit acute exercise performance
Exercise is used clinically to uncover symptoms so as to facilitate disease diagnosis. It is possible that an increase in metabolic demand evoked by exercise unmasks a phenotype in Trem2−/− mice. Thus, we determined whether Trem2−/− mice were exercise intolerant relative to WT controls. Following treadmill acclimation sessions, mice underwent an exercise tolerance test [peak exercise test, (Fig. 6A)]. No differences in exercise tolerance were noted between genotypes (Fig. 6B). Since Trem2 expression is increased with obesity (Fig. 1B), we determined whether endurance capacity [low-moderate exercise test, Fig. 6C)] was limited in obese Trem2−/− mice. Nine weeks of HFD feeding decreased exercise endurance – assessed via time to exhaustion – but there were no differences between WT and Trem2−/− mice (Fig. 6D). Next, we determined whether voluntary running behavior was impacted by Trem2 deletion by giving mice access to running wheels (Fig. 6E). Mice were transferred to cages containing a running wheel for a total of 2 days. The first 24 h the running wheel was locked, and served as an acclimation period to the new environment. The next day the wheel was unlocked and mice were allowed to run voluntarily. Run distance, food intake, and body weight were recorded during the 48 h test (Fig. 6F–G). Neither voluntary run distance nor average wheel speed were different between groups (Fig. 6H). Recent data suggest that in rat microglia, Trem2 is involved in anti-inflammatory responses evoked by exercise. Given the absence of differences between genotypes in response to physical activity stressors, we determined whether Trem2 expression in epididymal and inguinal adipose tissue is responsive to acute exercise (Fig. S2A). Trem2 expression was not significantly altered after a single endurance bout of treadmill exercise (mice were euthanized 4 h post exercise) (Fig. S2D). Notably, acute exercise exerted the anticipated response to lower plasma glucose and increase NEFA (Fig. S2E–F); thus, the lack of Trem2 response in adipose tissue is unlikely related to inadequate lipolysis. Collectively, these data suggest that Trem2 is dispensable for acute exercise performance in lean and obese mice and does not influence voluntary physical activity.
Figure 6 – Trem2 deletion does not limit acute exercise performance.
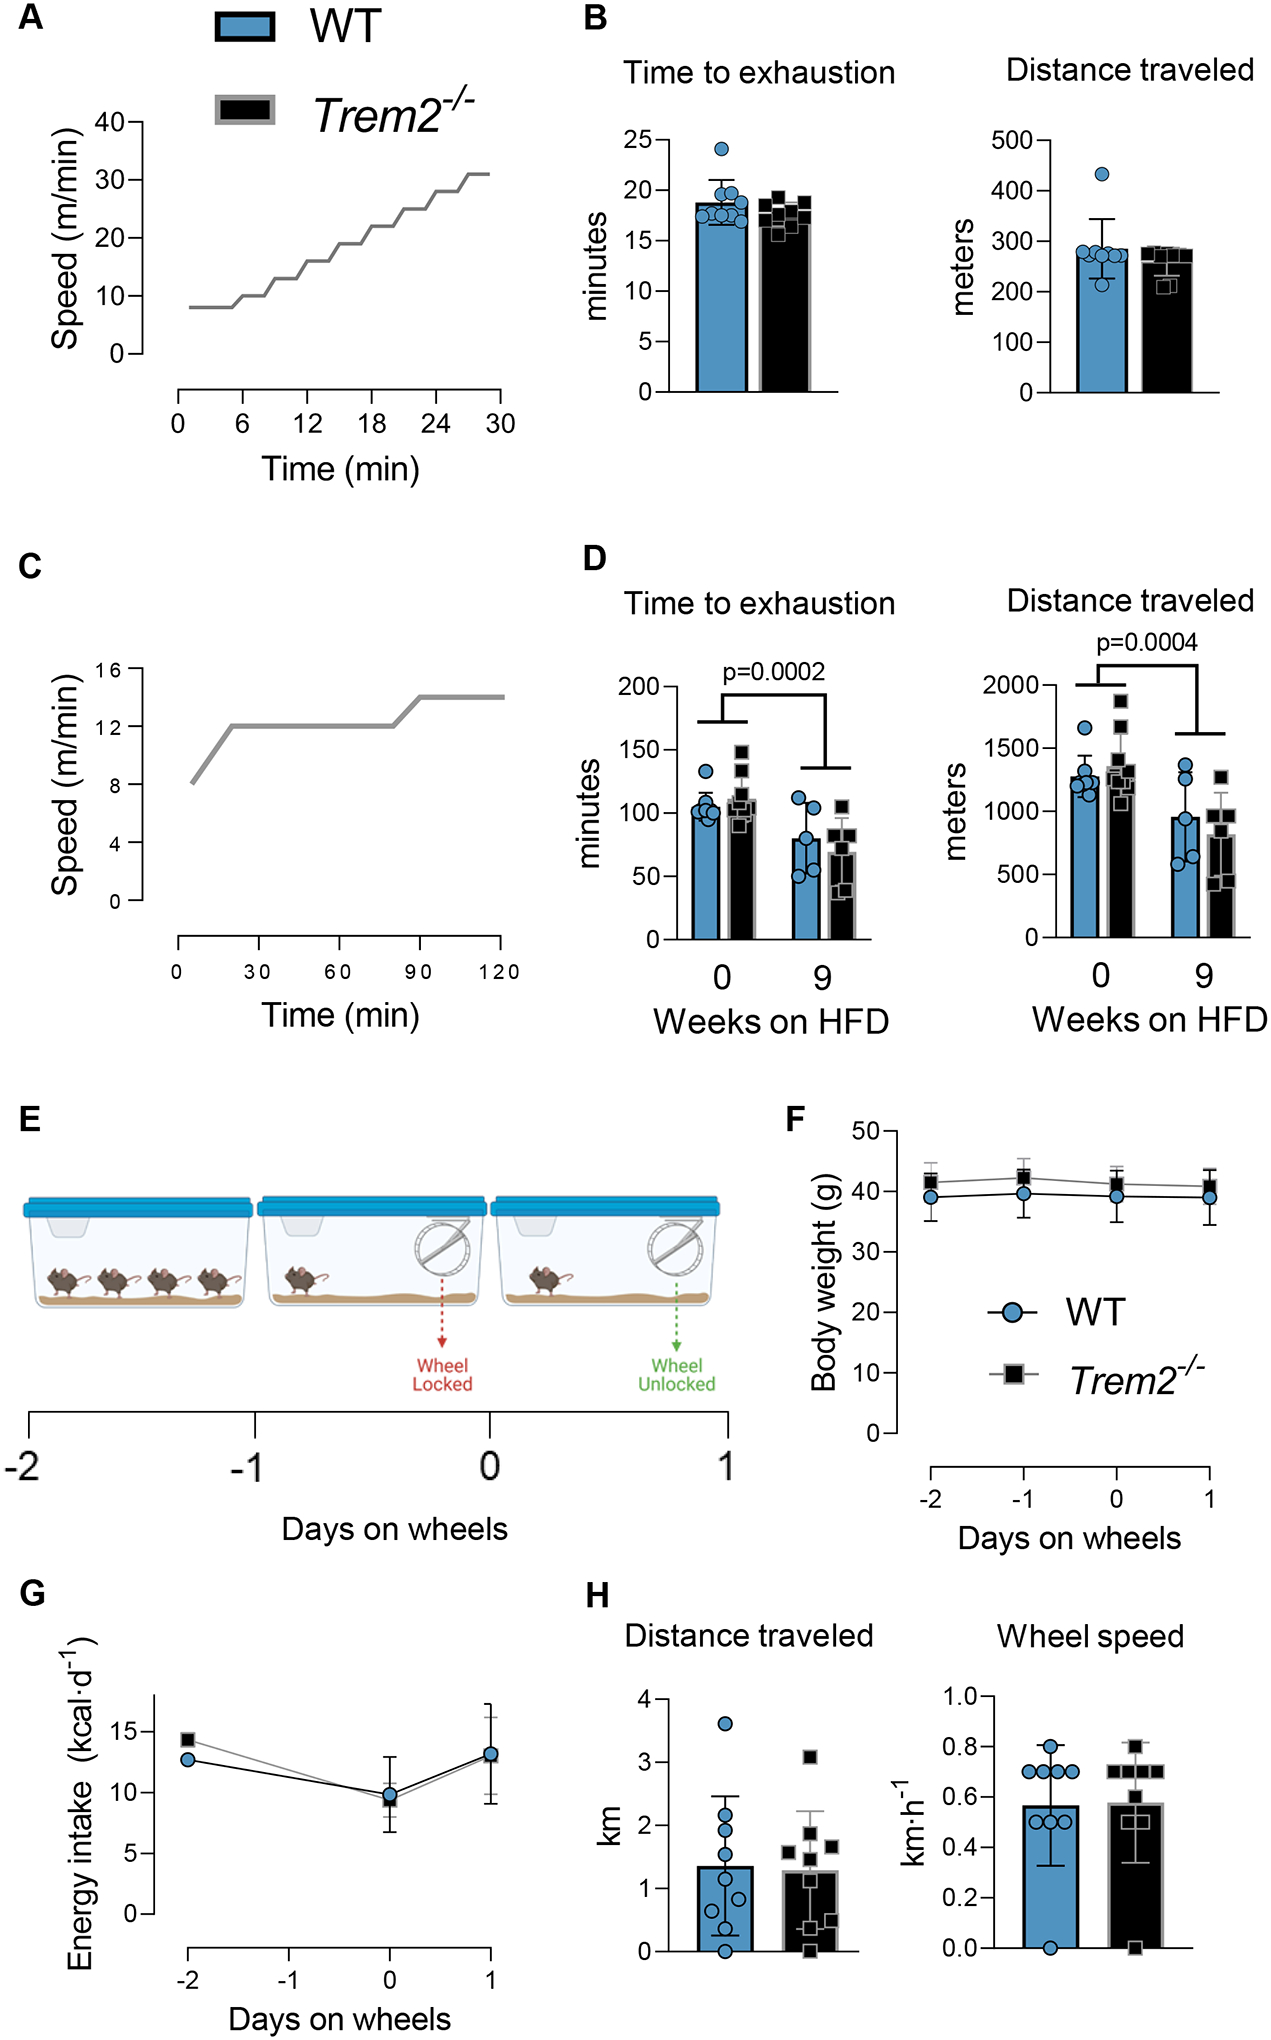
A&B) Peak exercise capacity and C&D) endurance capacity in Trem2−/− and WT mice were performed with time to exhaustion and distance traveled being the primary readout. Endurance tests were conducted in lean and obese states (9 weeks on HFD diet). E) Voluntary wheel running test was conducted over a 48 h period. Mice were single housed during the observation period and recombined with cage-mates after the test. Mice were transferred to a cage containing a running wheel that was physically locked from day −1 to day 0. On day 0 the wheel was unlocked and animals were allowed to run freely. F) Body weight, G) energy intake, H) run distance and run speed were collected. Independent t-tests were used to assess statistical differences between groups for panels B and H. Two-way ANOVA with time and genotype as factors was used to determine group differences for panel D. n=5–9/group. Trem2−/− mice were purchased directly from JAX and age-matched C57BL/6J mice were used as controls. Animal housing and experiments were conducted at room temperature (21–23°C). Graphics were generated using BioRender.com. Data are presented as mean ± SD. HFD, high fat diet.
Discussion
A novel macrophage population with high expression of genes associated with lipid metabolism – termed LAMs – is enriched in adipose tissue of obese humans and rodents. LAMs are thought to be lipid-scavenging phagocytes that act as a lipid buffer during adipose tissue expansion and that subsequently spare ectopic organs from excess lipid. Trem2 is the principal defining feature of LAMs (Cottam et al., 2022; Jaitin et al., 2019; Sharif et al., 2021), and its expression in adipose tissue progressively increases with obesity (Fig. 1B and (Jaitin et al., 2019)). Trem2 deletion in mice reportedly induces AT inflammation and impairs glucose metabolism (Liu et al., 2019). Consequently, the biomedical literature is being flooded with the notion that targeting Trem2 therapeutically may be a strategy to treat metabolic diseases. Yet, convincing evidence supporting that Trem2 is a molecular switch influencing insulin resistance is lacking. Thus, we aimed to determine whether Trem2 was causative in promoting insulin resistance in obesity. In contrast to previous reports, using multiple complementary approaches in male and female mice, we do not find that loss of Trem2 disrupts glucose homeostasis or insulin sensitivity. Similarly, increasing metabolic demand via acute maximal or endurance exercise does not reveal disturbances in aerobic fitness, which is tightly linked with metabolic function. Although loss of Trem2 causes significant adipocyte remodeling and stark adipocyte hypertrophy, our findings cast doubt that loss of Trem2 alone is sufficient to disrupt whole-body metabolic homeostasis in lean or obese settings.
To our knowledge, four studies have determined whether Trem2 deletion or overexpression regulates glucose metabolism in mice – all of which were conducted with male animals (Jaitin et al., 2019; Liu et al., 2019; Park et al., 2015; Sharif et al., 2021). These studies have been contrasted with the present paper in Table 1. The published studies implementing loss of Trem2 function report either worsened glucose tolerance (Jaitin et al., 2019; Sharif et al., 2021) or no effect (Liu et al., 2019). Overexpression of Trem2 also shows impaired glucose tolerance and higher fasting insulin than WT controls (Park et al., 2015). Regardless of Trem2 loss or gain of function, three of the four papers demonstrating worsened glucose or insulin tolerance simultaneously reveal that mutant animals gain more weight than WT controls on obesogenic diets. In mice, small differences in body weight are often sufficient to delay glucose clearance following a glucose bolus. Consequently, many reported differences in glycemic control in Trem2−/− mice can be explained by differences in body weight or fat mass. In this case, pair feeding, which has its own set of caveats, could be used to parse out whether a genetic mutation of interest is a regulator of glucose metabolism or insulin action when body weight is matched.
Table 1.
Metabolic consequences of gain or loss of Trem2 expression in mice
| Metabolic Phenotype | ||||||||||
|---|---|---|---|---|---|---|---|---|---|---|
| Study | Mouse model | Sex | Glucose dose (g) or kcal dose | Delivery | Fast duration | Adiposity | Fasting glucose | Glucose tolerance | Meal tolerance | Insulin tolerance |
| Jaitin et al. (Jaitin et al., 2019) | Turnball et al. (Turnbull et al., 2006) Knockout Cre-Lox, homologous recombination deletion in exon 3 and 4 |
M | 0.02 g (fixed dose) | i.p. | 14 h | Trem2−/− mice, elevated on HFD | Trem2−/− mice, elevated on HFD | Trem2−/− mice, impaired on HFD; no difference on LFD | ND | ND |
| Sharif et al. (Sharif et al., 2021) | Turnball et al. (Turnbull et al., 2006) Knockout Cre-Lox, homologous recombination deletion in exon 3 and 4 |
M | 1 g/kg body weight | oral | overnight | Trem2−/− mice, no difference | Trem2−/− mice, no difference | Trem2−/− mice, impaired on HFD; no difference on LFD | ND | Trem2−/− mice, impaired on HFD |
| Liu et al. (Liu et al., 2019) | Turnball et al. (Turnbull et al., 2006) Knockout Cre-Lox, homologous recombination deletion in exon 3 and 4 |
M | 1.5 g/kg body weight | i.p. | 16 h | Trem2−/− mice, elevated on HFD | Trem2−/− mice, no difference | No difference on LFD or HFD | ND | Trem2−/− mice, impaired on HFD |
| Park et al. (Park et al., 2015) | Park et al. (Park et al., 2015) Overexpression Transgene introduced via microinjection: 732 bp mouse Trem2 insertion behind pCMV prmoter |
M | 1 g/kg body weight | i.p. | overnight | Trem2−/− mice, elevated on HFD | Trem2−/− mice, elevated on HFD | Impaired on HFD; no difference on LFD | ND | Trem2−/− mice, impaired on HFD |
| Present study | JAX, #027197 Knockout CRISPR, 175 bp deletion, stop codon in exon 2 |
M&F | 2g/kg fat free mass | i.p. | 5 h and 15 h | Trem2−/− mice, no difference | Trem2−/− mice, no difference | No difference on LFD or HFD | ND | ND |
| Present study | JAX, #027197 Knockout CRISPR, 175 bp deletion, stop codon in exon 2 |
M&F | 3 g/kg fat free mass | oral | 5 h | Trem2−/− mice, no difference | Trem2−/− mice, no difference | No difference on HFD or LFD | ND | ND |
| Present study | JAX, #027197 Knockout CRISPR, 175 bp deletion, stop codon in exon 2 |
M&F | 3.5 g/kg fat free mass | oral | 5 h | Trem2−/− mice, no difference | Trem2−/− mice, no difference | No difference at standard housing temperature or thermoneutrality | ND | ND |
| Present study | JAX, #027197 Knockout CRISPR, 175 bp deletion, stop codon in exon 2 |
M&F | 12 kcal/kg body weight | oral | 5 h | Trem2−/− mice, no difference | Trem2−/− mice, no difference | NA | No difference on HFD | ND |
| Present study | JAX, #027197 Knockout CRISPR, 175 bp deletion, stop codon in exon 2 |
M | NA | i.p. | 4 h | Trem2−/− mice, no difference | Trem2−/− mice, no difference | NA | ND | No difference on HFD Insulin dose: 0.75 mU/kg body weight |
ND, not determined
NA, not applicable
M, males
F, females
Sharif et al. report that Trem2 ablation impairs glucose tolerance in weight matched obese mice (Sharif et al., 2021). This is the only study, to date, to indicate a possible role of Trem2 in regulating glucose metabolism when body weight or fat mass are not different. It is important to note that these studies were performed after an overnight fast. As reported previously (Andrikopoulos et al., 2008; Ayala et al., 2006; Ayala et al., 2010; McGuinness et al., 2009), overnight fasting improves glucose tolerance as compared to a 5 h fast by enhancing insulin action in mice. It is not known if WT and Trem2−/− mice in the Sharif study lost the same percentage of body weight during the overnight fast. This is important because differences in energy stores, namely liver glycogen, at the start of the glucose tolerance test can influence hepatic glucose fluxes and by consequence the rate of blood glucose clearance. We did not directly measure glycogen stores in the present study but we did find that WT and Trem2−/− had similar reductions in body weight after a 5 h fast (WT, 3.1±0.4% vs Trem2−/− 2.9±0.2%) and 15 h fast (WT, 5.8±0.2% vs Trem2−/− 6.0±0.2%), respectively. No differences in glucose tolerance were found between genotypes in response to short or long-term fast, hence we suggest that baseline glycogen levels are likely similar between genotypes. In mouse studies, blood is routinely sampled from the tail. Sampling directly from an arterial source in an unrestrained/non-anesthetized mouse mitigates stress-induced blood glucose elevation due to elevated catecholamine’s and stress hormones (Ayala et al., 2006). Thus, to avoid stress-induced hyperglycemia we surgically implanted carotid artery catheters and performed a mixed meal tolerance test via oral gavage. Consistent with other measures of metabolic control, no differences in glucose, insulin, NEFA, or triglycerides concentrations were found between genotypes. In addition, herein, mice were tested under thermoneutral conditions which is known to decrease energy expenditure and thought to decrease insulin sensitivity (Ivanova and Blondin, 2021). Postprandial insulin concentrations were higher in TN versus RT housed mice, suggesting decreased insulin sensitivity, but the absence of Trem2 did not evoke an interaction with housing temperature. Finally, we show that the reduction in blood glucose levels following an insulin bolus (ITT) is similar between WT and Trem2−/− mice suggesting that whole-body insulin responsiveness is not different between genotypes. Based on results from multiple exogenous substrates delivered, two methods of substrate administration, and two environmental conditions tested, we conclude that loss of Trem2 does not worsen glucose metabolism or insulin sensitivity in male or female mice.
Acute exercise exerts a major influence on energy metabolism that requires a coordinated response to mobilize and utilized substrates for mechanical work. Given the large adipocyte size in Trem2−/− mice we hypothesized that adipocyte-derived NEFA via lipolysis may be impaired when mice are challenged with exercise. If this hypothesis were correct, mice would be forced to oxidize glucose as the major fuel source and fatigue more quickly than WT animals. However, Trem2 deficient animals did not manifest differences in peak graded exercise performance or endurance exercise (i.e., a metabolic state in which lipolysis is high and sustained) in either lean or obese states. We acknowledge that these exercise tests are limited by ‘time to exhaustion’ being the primary readout. It is plausible that substrate utilization (respiratory quotient) is different between genotypes. Higher reliance on carbohydrate as a fuel source is closely linked to exercise time to exhaustion during an endurance-based test (Bagby et al., 1978; Hermansen et al., 1967); therefore, we postulate that if the respiratory quotient was indeed affected by loss of Trem2 this would have manifested in time to exhaustion. Future experiments would benefit from indirect calorimetry to determine maximal oxygen consumption and respiratory exchange ratio’s (e.g. estimate of whole-body substrate utilization) during exercise tests.
Although Trem2 does not appear necessary for acute regulation of exercise responses, this does not rule out a role in chronic exercise adaptations. In rodent Alzheimer’s disease models, the anti-inflammatory effects of exercise training is associated with Trem2 expression levels (Zhang et al., 2022a; Zhang et al., 2022b). In addition, exercise training blunts the increase in soluble Trem2 caused by neuroinflammation in mice (Zhang et al., 2022b), but not in human patients with Alzheimer’s disease (Jensen et al., 2019). Nonetheless, given that metabolic function (i.e., glucose and lipid metabolism) is not adversely affected by loss of Trem2 in the present study, it seems unlikely that peripheral metabolic adaptations to exercise training would require Trem2. In addition, in the absence of disease (controls used in rodent Alzheimer’s models (Zhang et al., 2022a; Zhang et al., 2022b)), exercise does not further enhance Trem2 expression, suggesting that exercise may prevent the suppression of Trem2 expression following microglia activation, but exercise does not seem to increase Trem2 expression above basal. It may be that exercise motivation or recovery to muscle damage (i.e., mild injury) are influenced by Trem2 expression. Additional research is needed to determine whether the role of Trem2 in tissue remodeling is linked with exercise training-induced adaptations.
In response to energy excess, Trem2 appears essential for the beneficial functions of LAMs, including lowering inflammation and by placing a break on adipocyte hypertrophy (Jaitin et al., 2019). This could also extent to the heightened lipid release state of adipocytes during weight loss, which does not restore Trem2+ LAMs to the lean state in adipose tissue (Cottam et al., 2022). Some studies report enhanced inflammatory gene expression in adipose tissue isolated from Trem2−/− mice (Liu et al., 2019), whereas we did not observe worsened overall adipose tissue inflammation in obese Trem2−/− mice (Fig. S1A). The abundance of crown-like structures, but not total macrophages, in adipose tissue is lower in Trem2−/− versus WT animals, which could result in delayed clearance of dying adipocytes, and by consequence, increased inflammation in some studies. Despite using a different model of Trem2 deletion herein, the adipose tissue phenotype is similar to published literature with Trem2−/− mice having excessive adipocyte hypertrophy and dysregulated expression of LAM transcriptional profile, but no changes to whole-body metabolic function. Indeed, the large differences in adipocyte hypertrophy were not linked with a notable difference in postprandial glycerol suppression (a proxy for whole-body lipolysis) between groups. The lack of a relationship between adipocyte hypertrophy and systemic insulin sensitivity observed herein might suggest ‘healthy’ adipocyte expansion similar to that observed in adipocyte fibrosis-resistant mouse models (Khan et al., 2009; Kim et al., 2007). The metabolic phenotype (defined by glucose tolerance, mixed meal tolerance, and insulin tolerance) was different between exon 2 and exon 3–4 mouse models (summarized in Table 1). Institutional sites have a profound effect on body weight gain trajectories and energy metabolism even in mice purchased from the same vendor and fed the same diets (Corrigan et al., 2020). This might imply that differences in the microbiome contribute to phenotypic differences between institutions, which warrants additional investigation.
In conclusion, we report a disassociation between adipose tissue remodeling caused by loss of Trem2 and whole-body metabolic homeostasis in mice.
Supplementary Material
ACKNOWLEDGEMNTS
We thank Alec Rodriguez (VU), Vitrag Patel (VU), and Amber Crabtree (VU) for mouse husbandry and technical assistance.
FUNDING
This project was funded by a Veterans Affairs Merit Award 5I01BX002195 to AHH. NCW was supported by an American Physiological Society Postdoctoral Fellowship and the Molecular Endocrinology Training Program [METP, (T32 DK007563-31)] during data curation and analysis and is currently supported by the AHA (21POST834990). EMW is supported by Immunological Mechanisms of Disease Training Program (T32AI138932). JNG is supported by the METP (T32 DK007563-31). AHH is supported by a Career Scientist Award from the Veterans Affairs (IK6 BX005649). We acknowledge the following Vanderbilt University (VU) and Vanderbilt University Medical Center (VUMC) core facilities: VUMC Hormone Assay & Analytical Services Core (NIH DK059637 and DK020593), VU Metabolic Mouse Phenotyping Center [VMMPC (NIH DK059637; www.vmmpc.org)], and Translational Pathology Shared Resource (NCI/NIH Cancer Center Support Grant 5P30 CA68485-19).
Biography
Nathan Winn is a physiologist who completed my doctoral training at the University of Missouri. During his doctoral work, he was trained using translational research approaches that used small and large animal models as well as human subjects. Dr. Winn’s objective was to understand the physiological network between physical activity/inactivity and metabolic disease, with emphasis on adipose tissue and glucose regulation. After completing his doctoral work, Dr. Winn transitioned to the Department of Molecular Physiology and Biophysics at Vanderbilt University as a postdoctoral fellow. His postdoctoral research has focused on understanding the physiological and molecular links between immunological regulation of adipose tissue and metabolic disease and has recently incorporated environmental temperature and exercise as modulators of energy metabolism, insulin action, and pancreatic function. Dr. Winn’s primary objective is to pursue an independent career in research within an academic institution.

Footnotes
COI STATEMENT
The authors declare that no conflict exists.
REFERENCES
- Andrikopoulos S, Blair AR, Deluca N, Fam BC, and Proietto J (2008). Evaluating the glucose tolerance test in mice. Am J Physiol Endocrinol Metab 295, E1323–1332. [DOI] [PubMed] [Google Scholar]
- Ayala JE, Bracy DP, McGuinness OP, and Wasserman DH (2006). Considerations in the design of hyperinsulinemic-euglycemic clamps in the conscious mouse. Diabetes 55, 390–397. [DOI] [PubMed] [Google Scholar]
- Ayala JE, Samuel VT, Morton GJ, Obici S, Croniger CM, Shulman GI, Wasserman DH, and McGuinness OP (2010). Standard operating procedures for describing and performing metabolic tests of glucose homeostasis in mice. Disease models & mechanisms 3, 525–534. [DOI] [PMC free article] [PubMed] [Google Scholar]
- Bagby GJ, Green HJ, Katsuta S, and Gollnick PD (1978). Glycogen depletion in exercising rats infused with glucose, lactate, or pyruvate. Journal of applied physiology: respiratory, environmental and exercise physiology 45, 425–429. [DOI] [PubMed] [Google Scholar]
- Bailey CC, DeVaux LB, and Farzan M (2015). The Triggering Receptor Expressed on Myeloid Cells 2 Binds Apolipoprotein E. J Biol Chem 290, 26033–26042. [DOI] [PMC free article] [PubMed] [Google Scholar]
- Cannon JP, O’Driscoll M, and Litman GW (2012). Specific lipid recognition is a general feature of CD300 and TREM molecules. Immunogenetics 64, 39–47. [DOI] [PubMed] [Google Scholar]
- Corrigan JK, Ramachandran D, He Y, Palmer CJ, Jurczak MJ, Chen R, Li B, Friedline RH, Kim JK, Ramsey JJ, et al. (2020). A big-data approach to understanding metabolic rate and response to obesity in laboratory mice. Elife 9. [DOI] [PMC free article] [PubMed] [Google Scholar]
- Cottam MA, Caslin HL, Winn NC, and Hasty AH (2022). Multiomics reveals persistence of obesity-associated immune cell phenotypes in adipose tissue during weight loss and weight regain in mice. Nat Commun 13, 2950. [DOI] [PMC free article] [PubMed] [Google Scholar]
- Daws MR, Sullam PM, Niemi EC, Chen TT, Tchao NK, and Seaman WE (2003). Pattern recognition by TREM-2: binding of anionic ligands. J Immunol 171, 594–599. [DOI] [PubMed] [Google Scholar]
- Fischer AW, Cannon B, and Nedergaard J (2018). Optimal housing temperatures for mice to mimic the thermal environment of humans: An experimental study. Mol Metab 7, 161–170. [DOI] [PMC free article] [PubMed] [Google Scholar]
- Hermansen L, Hultman E, and Saltin B (1967). Muscle glycogen during prolonged severe exercise. Acta Physiol Scand 71, 129–139. [DOI] [PubMed] [Google Scholar]
- Ivanova YM, and Blondin DP (2021). Examining the benefits of cold exposure as a therapeutic strategy for obesity and type 2 diabetes. J Appl Physiol (1985) 130, 1448–1459. [DOI] [PubMed] [Google Scholar]
- Jaitin DA, Adlung L, Thaiss CA, Weiner A, Li B, Descamps H, Lundgren P, Bleriot C, Liu Z, Deczkowska A, et al. (2019). Lipid-Associated Macrophages Control Metabolic Homeostasis in a Trem2-Dependent Manner. Cell 178, 686–698.e614. [DOI] [PMC free article] [PubMed] [Google Scholar]
- Jensen CS, Bahl JM, Østergaard LB, Høgh P, Wermuth L, Heslegrave A, Zetterberg H, Heegaard NHH, Hasselbalch SG, and Simonsen AH (2019). Exercise as a potential modulator of inflammation in patients with Alzheimer’s disease measured in cerebrospinal fluid and plasma. Exp Gerontol 121, 91–98. [DOI] [PubMed] [Google Scholar]
- Kawabori M, Kacimi R, Kauppinen T, Calosing C, Kim JY, Hsieh CL, Nakamura MC, and Yenari MA (2015). Triggering receptor expressed on myeloid cells 2 (TREM2) deficiency attenuates phagocytic activities of microglia and exacerbates ischemic damage in experimental stroke. J Neurosci 35, 3384–3396. [DOI] [PMC free article] [PubMed] [Google Scholar]
- Khan T, Muise ES, Iyengar P, Wang ZV, Chandalia M, Abate N, Zhang BB, Bonaldo P, Chua S, and Scherer PE (2009). Metabolic dysregulation and adipose tissue fibrosis: role of collagen VI. Mol Cell Biol 29, 1575–1591. [DOI] [PMC free article] [PubMed] [Google Scholar]
- Kim JY, van de Wall E, Laplante M, Azzara A, Trujillo ME, Hofmann SM, Schraw T, Durand JL, Li H, Li G, et al. (2007). Obesity-associated improvements in metabolic profile through expansion of adipose tissue. J Clin Invest 117, 2621–2637. [DOI] [PMC free article] [PubMed] [Google Scholar]
- Liu C, Li P, Li H, Wang S, Ding L, Wang H, Ye H, Jin Y, Hou J, Fang X, and Shu Q (2019). TREM2 regulates obesity-induced insulin resistance via adipose tissue remodeling in mice of high-fat feeding. J Transl Med 17, 300. [DOI] [PMC free article] [PubMed] [Google Scholar]
- McGuinness OP, Ayala JE, Laughlin MR, and Wasserman DH (2009). NIH experiment in centralized mouse phenotyping: the Vanderbilt experience and recommendations for evaluating glucose homeostasis in the mouse. Am J Physiol Endocrinol Metab 297, E849–855. [DOI] [PMC free article] [PubMed] [Google Scholar]
- Park M, Yi JW, Kim EM, Yoon IJ, Lee EH, Lee HY, Ji KY, Lee KH, Jang JH, Oh SS, et al. (2015). Triggering receptor expressed on myeloid cells 2 (TREM2) promotes adipogenesis and diet-induced obesity. Diabetes 64, 117–127. [DOI] [PubMed] [Google Scholar]
- Sharif O, Brunner JS, Korosec A, Martins R, Jais A, Snijder B, Vogel A, Caldera M, Hladik A, Lakovits K, et al. (2021). Beneficial Metabolic Effects of TREM2 in Obesity Are Uncoupled From Its Expression on Macrophages. Diabetes 70, 2042–2057. [DOI] [PMC free article] [PubMed] [Google Scholar]
- Shi Y, and Holtzman DM (2018). Interplay between innate immunity and Alzheimer disease: APOE and TREM2 in the spotlight. Nat Rev Immunol 18, 759–772. [DOI] [PMC free article] [PubMed] [Google Scholar]
- Small L, Ehrlich A, Iversen J, Ashcroft SP, Trošt K, Moritz T, Hartmann B, Holst JJ, Treebak JT, Zierath JR, and Barrès R (2022). Comparative analysis of oral and intraperitoneal glucose tolerance tests in mice. Mol Metab 57, 101440. [DOI] [PMC free article] [PubMed] [Google Scholar]
- Turnbull IR, Gilfillan S, Cella M, Aoshi T, Miller M, Piccio L, Hernandez M, and Colonna M (2006). Cutting edge: TREM-2 attenuates macrophage activation. J Immunol 177, 3520–3524. [DOI] [PubMed] [Google Scholar]
- Winn NC, Acin-Perez R, Woodford ML, Hansen SA, Haney MM, Ayedun LA, Rector RS, Vieira-Potter VJ, Shirihai OS, Sacks HS, et al. (2019). A Thermogenic-Like Brown Adipose Tissue Phenotype Is Dispensable for Enhanced Glucose Tolerance in Female Mice. Diabetes 68, 1717–1729. [DOI] [PMC free article] [PubMed] [Google Scholar]
- Winn NC, Wolf EM, Cottam MA, Bhanot M, and Hasty AH (2021). Myeloid-specific deletion of ferroportin impairs macrophage bioenergetics but is disconnected from systemic insulin action in adult mice. Am J Physiol Endocrinol Metab 321, E376–E391. [DOI] [PMC free article] [PubMed] [Google Scholar]
- Zhang L, Liu Y, Wang X, Wang D, Wu H, Chen H, Chen J, and Liu Y (2022a). Treadmill exercise improve recognition memory by TREM2 pathway to inhibit hippocampal microglial activation and neuroinflammation in Alzheimer’s disease model. Physiology & behavior 251, 113820. [DOI] [PubMed] [Google Scholar]
- Zhang SS, Zhu L, Peng Y, Zhang L, Chao FL, Jiang L, Xiao Q, Liang X, Tang J, Yang H, et al. (2022b). Long-term running exercise improves cognitive function and promotes microglial glucose metabolism and morphological plasticity in the hippocampus of APP/PS1 mice. J Neuroinflammation 19, 34. [DOI] [PMC free article] [PubMed] [Google Scholar]
Associated Data
This section collects any data citations, data availability statements, or supplementary materials included in this article.