

Abstract
Immunomodulatory (IM) metabolic reprogramming in macrophages (Mϕ) is fundamental to immune function. However, limited information is available for human Mϕ, particularly in response plasticity, which is critical to understanding the variable efficacy of immunotherapies in cancer patients. We carried out an in-depth analysis by combining multiplex Stable Isotope-Resolved Metabolomics with Reverse Phase Protein Array to map the dynamic changes of IM metabolic network and key protein regulators in four human donors’ Mϕ in response to differential polarization and M1 repolarizer beta-glucan (WGP). These responses were compared with those of WGP-treated ex vivo organotypic tissue cultures (OTC) of human non-small cell lung cancer (NSCLC). We found consistently enhanced tryptophan catabolism with blocked NAD+ and UTP synthesis in M1-Mϕ, which was associated with immune activation evidenced by increased release of IL-1β/CXCL10/IFNγ/TNFα and reduced phagocytosis. In M2a-Mϕ, WGP treatment of M2a-Mϕ robustly increased glucose utilization via glycolysis/oxidative branch of the pentose phosphate pathway while enhancing UDPGlcNAc turnover and glutamine-fueled gluconeogenesis, which was accompanied by the release of pro-inflammatory IL-1β/TNFα to above M1-Mϕ’s levels/anti-inflammatory IL-10 to above M2a-Mϕ’s levels and attenuated phagocytosis. These IM metabolic responses could underlie the opposing effects of WGP, i.e. reverting M2 to M1-type immune functions but also boosting anti-inflammation. Variable reprogrammed Krebs cycle and glutamine-fueled synthesis of UTP in WGP-treated OTC of human NSCLC were observed, reflecting variable M1 repolarization of tumor associated Mϕ. This is supported by correlation with IL-1β/TNFα release and compromised tumor status making patient-derived OTC unique models for studying variable immunotherapeutic efficacy in cancer patients.
Keywords: human macrophages, beta-glucan, immunomodulatory metabolism, multiplex Stable isotope-resolved metabolomics (mSIRM), patient-derived organotypic tissue cultures, tumor microenvironment
Introduction
Macrophages (Mϕ), an essential component of innate immunity, play a central role in inflammation and host defense (1) and are frequently the dominant members of the infiltrating cells in human tumors (2). Mϕ orchestrate immune responses to exert pro-tumoral or anti-tumoral activity by interacting with cancer cells, T lymphocytes (key players in adaptive immunity and central to tumoricidal activity), and other immune cells in the tumor microenvironment (TME) (3, 4). Classically activated (M1) mouse Mϕ are characterized by elevated expression of major histocompatibility complex (MHC) II, interleukin (IL)-12, tumor necrosis factor-alpha (TNFα), excess production of reactive oxygen species (ROS) and NO, as well as enhanced tumoricidal activity. In contrast, alternatively activated (M2) Mϕ are pro-tumorigenic (5). Most tumor associated Mϕ (TAM), including those in non-small cell lung cancer (NSCLC), are M2-like, expressing high levels of vascular endothelial growth factor (VEGF), arginase 1 (Arg1), cyclooxygenase (COX) 2-derived prostaglandin (PG) E2, and anti-inflammatory IL-10 (6, 7). Mouse TAM are known to promote tumor progression by suppressing cytotoxic lymphocyte (CTL) activation (8), upregulating checkpoint proteins such as programmed death ligand 1 (PD-L1) (9) and B7-H4 (10), as well as by reducing their own capacity for antigen-presentation (e.g. reduced MHC II expression) (11). Moreover, T cell exclusion from tumor islets by TAM action correlates with poor NSCLC patient survival and may well contribute to the lack of response to anti-PD-L1 therapies (12).
Evidence is mounting for the importance of Mϕ metabolism in modulating tumor immunity (5, 13–20). It is now known that mouse Mϕ undergo variable metabolic reprogramming depending on the method of polarization. LPS and IFNγ-activated (M1 type) Mϕ or M(LPS+IFNγ) (21) display accelerated glycolysis, the pentose phosphate pathway (PPP) and Trp catabolism, but reduced oxidative phosphorylation (OXPHOS), glutaminolysis, and Krebs cycle activity, as well as accumulation of citrate and succinate as a result of two breaks in the Krebs cycle (22–27). However, Gln metabolism appears to be important for both M1 and M2-type murine Mϕ. Gln catabolism was found to be required for IL4-induced M2 polarization in murine Mϕ (M2-Mϕ) by fueling the production of UDP-N-acetyl-glucosamine (UDPGlcNAc) and consequent N-glycosylation of M2 Mϕ’s cell surface receptors (23). However, Gln metabolism was also enhanced in LPS-driven murine M1-Mϕ and human monocytes, which could support Arg and NO production (28). In human cancer cells and murine T/dendritric cells, NO in turn activates glycolysis (29–31), which is also a hallmark of mouse M(LPS+IFNγ). We have also seen activated glutaminolysis in murine M1-Mϕ in a stable isotope resolved metabolomic (SIRM) study (7). The reason for such divergence in Gln metabolism is unclear but illustrates the plasticity of glutaminolysis in response to Mϕ polarization.
It is also known that the products of the reprogrammed metabolism modulates key functions of activated Mϕ, as the enzymes that catalyze the reprogramming. For example, citrate accumulation fuels the production of the anti-microbial (32) but also anti-inflammatory (33, 34) metabolite itaconate in LPS-activated murine and human Mϕ. The latter role of itaconate involves a complex feedback loop in immunomodulation. Namely, sustained itaconate production by LPS stimulation limited type 1 interferon (IFN) response while promoting anti-inflammatory program mediated by Nuclear Factor Erythroid 2 Like 2 (Nrf2) activation in human and murine Mϕ as well as SDH inhibition in murine Mϕ. Blocked IFN response in turn attenuates inflammatory gene expression and itaconate production (34). Succinate produced from citrate stabilizes hypoxia-inducible factor (HIF)-1α (35) and induces mitochondrial ROS production (36), which regulate M1-Mϕ activation in murine Mϕ. Extracellular succinate released activates the succinate receptor GPR91 (SUCNR1) on the cell surface to induce pro-inflammatory IL-1β production in an autocrine manner in mouse Mϕ and human myeloid cells (15). Acetyl CoA derived from citrate via citrate lyase activity (ACLY) is a substrate for arachidonate synthesis, which is required for producing the immunosuppressive (37) modulator PGE2 in LPS-activated human Mϕ (38). The other ACLY product, oxaloacetate, can produce NADPH via the concerted action of malate dehydrogenase (MDH) and malic enzyme (ME) to fuel superoxide anion production via NADPH oxidase (i.e. O2 burst) for bactericidal activity (38, 39). Trp catabolism initiated by superoxide or proinflammatory cytokine-induced IDO produces quinolinate (QA), the accumulation of which accompanies M1 activation of human Mϕ (40, 41). QA buildup in human M1-Mϕ also results from the loss of quinolinate phosphoribosyl transferase (QPRT), which underlie compromised mitochondrial functions for lack of NAD+ replenishment supported by the QPRT activity (42). However, QA has also been thought to fuel NAD+ synthesis during inflammation. NAD+ is depleted by ADP-ribosylation catalyzed by poly(ADP-ribose) polymerase (PARP) for repairing DNA strand breaks and by ADP-ribosyltransferases for modulating the activity of cellular proteins in human or murine Mϕ and cell surface receptors in other mouse leukocytes (40, 43). Another product of Trp catabolism, picolinate, is also known to activate M1 polarization of murine Mϕ while inducing tumoricidal activity (44–46). Furthermore, the LPS-driven murine Mϕ activation is modulated by the glycolytic enzyme pyruvate kinase M2 (PKM2) via dimerization and HIF1α activation (47).
Despite these key roles of Mϕ metabolism in immunomodulation, our understanding of the metabolic reprogramming derives primarily from polarized murine Mϕ models. Whether these and additional metabolic events occur in polarized human Mϕ is still unclear. Even less is known about the temporal dependence and the plasticity of individual’s response to polarization and immune modulators in human Mϕ. A recent report indicates that human Mϕ from young and old individuals differ in their IM metabolism and functions (42).
β-Glucans are dietary fibers comprising D-glucose subunits linked via β-(1➛3) and β-(1➛6) or β-(1➛4) glycosyl bonds. Bioactive β-glucans (with β-(1➛3) bonds), yeast-derived whole glucan particles (WGP) in particular, have been shown to elicit numerous pro-inflammatory responses by ligating to pattern recognition receptors (PRRs) such as dectin-1 and CR3 (48) on the surface of innate immune cells. We and others showed that WGP reversed the immunosuppressive property of murine TAM and myeloid-derived suppressor cells (MDSCs), leading to CD4/CD8 T cell activation and reduced Treg cell numbers (7, 49). We also showed that this reversion of murine TAM to an M1-like state was accompanied by enhanced glycolysis and glutaminolysis (7). β-Glucan-enhanced glutaminolysis was recently shown to replenish fumarate, which modulated H3K27 acetylation and/or H3K4 methylation in human monocytes to promote innate immune memory or trained immunity (50). β-Glucan also reversed immune tolerance by suppressing IRG1 expression and itaconate production while restoring SDH expression in tolerant human monocytes (51). However, other than our recent finding on WGP-induced activation of glucose metabolism in NSCLC patient’s tumor tissues (52), there is little information on β-glucan’s effect on IM functions and metabolism in human Mϕ, particularly for old individuals. This knowledge is important for delineating Mϕ’s responses to β-Glucan in NSCLC tissues, as NSCLC is a disease mainly of the aged. In turn, the information will be valuable for better understanding of β-glucan’s action in ongoing combination clinical trial for NSCLC (NCT03003468 sponsored by Merck).
Here, we employed [13C6]-glucose as single tracer and [2H2]- or [D2]-glucose +[13C5]-Gln + [15N2]-Trp as triple tracers coupled with SIRM analysis to globally define time course changes in IM metabolism along with the analysis of IM function in human Mϕ (derived from four healthy donors) in response to differential polarization and WGP. We also investigated WGP’s effect on IM metabolism and function in ex vivo human NSCLC organotypic tissue cultures (OTC) using [13C6]-glucose or [13C5,15N2]-Gln as tracers. We compared the responses of human Mϕ’s to WGP in vitro to WGP’s effects on NSCLC OTCs ex vivo to gain a better understanding on the plasticity and TAM component of the latter response.
Materials and Methods
Monocytes Isolation, differentiation, and polarization
Monocytes were isolated from whole human peripheral blood of two each healthy male (UK096, UK168) and female (UK094 and UK166) donors using the RosetteSep™ human monocyte enrichment cocktail kit (StemCell). There is no known history of smoking, hypertension, atherosclerosis, diabetes mellitus, or cancer for any of the four healthy donors. UK094, UK166, and UK168 have seasonal allergy but were not under the influence at the time of blood collection. Monocytes were differentiated in 6-well plates (Nunclon Delta, Thermofisher) for 6 days in monocytes differentiation medium (MDM) containing DMEM, 10% FBS, 10 mM glucose, 2 mM Gln, 1X Anti-anti, and 50 ng/mL CSF-1 at 37°C/5% CO2 at a density of 3–5×10⁶ cells per well before polarization. Cells were maintained in MDM (M0) or polarized to either M1 with 100 ng/mL LPS + 20 ng/mL IFNγ or to M2a subtype with 20 ng/mL each IL-4 + IL-13 for 1 to 3 days.
Immunostaining
Mϕ were prestained with Hoechst 33342 (NucBlue reagent, Fisher Cat# R37605) as per vendor’s directions, fixed with 4% paraformaldehyde (PFA) for 10 minutes, then washed twice with PBS. Cells were blocked and permeabilized in blocking solution for 1hr (5% heat-inactivated goat serum + 0.3% Triton™ X100 in PBS), followed by overnight incubation at 4°C with the following primary antibodies: mouse CD206 (Biolegend Cat# 321102, 1:100 dilution) and rabbit IDO1 (Cell Signaling Cat# 86630, 1:100 dilution). Excess primary antibodies were removed with four washes in buffer comprised of 1X PBS, 5% heat-inactivated goat serum and 0.1% Triton™ X100. After washing, appropriate secondary antibodies (Alexa Fluor 488 goat anti-rabbit 1:500 dilution, Life Technologies Cat# A11008 and Alexa Fluor 647 goat anti-mouse 1:500 dilution, Life technologies Cat# A21235) were added and allowed to hybridize for 1hr. Cells were washed four times with wash buffer to remove excess secondary antibodies. Cells in each well were then covered with 50% Stay-Brite™ antifade solution (Ursa Bioscience) and stitch-imaged using an EVOS M7000 (Invitrogen) inverted fluorescent microscope with appropriate filters.
For tissue staining, formalin-fixed, paraffin-embedded (FFPE) tissues were cut into 4 μm sections, rehydrated, and processed for antigen retrieval in 10 mM sodium citrate + 0.05% Tween 20 (pH 6) before multiplex staining using the Tyramide SuperBoost™ kits (Life Technologies, cat# B40922, B40916) (53), as per vendor’s protocol. Briefly, tissue slides were blocked in 10% goat serum for 1 h at room temperature, incubated sequentially with each primary antibody (mouse anti-PCNA 1:4000, Cell Signaling cat# 25865 and anti-rabbit RIP1 1:100, Cell Signaling cat# 34935) at 4°C overnight, followed by incubation with the appropriate secondary antibody (see above) for 1 h at room temperature, and reaction with tyramide working solution for 10 min. The stained slides were mounted in Prolonged Gold anti-fade reagent + DAPI (Invitrogen cat# P36931) overnight at 4°C before microscopy on an Olympus FV1200 Confocal system.
Image Analysis
All stitched Mϕ images were analyzed using CellProfiler (54). The nuclei were segmented and counted in each image. The nuclei segmentation was inspected manually and images that did not segment well were either removed from analysis or re-analyzed to improve segmentation. The segmented nuclei were then masked with the other channels of the image to determine the colocalized intensity of those channels. Both the colocalized intensity and total intensity of the channels were normalized by the number of nuclei.
Phagocytosis Assay
Phagocytic activity was determined using pHrodo™ Red zymosan dye-conjugated bioparticles (Life Technologies Cat# P35364) as per vendor’s instructions. Briefly, 2×10⁵ unpolarized Mϕ were plated on a 384 well SV μClear black plate (Greiner Cat# 788091) and polarize with LPS+IFNγ or IL4+IL13 for 2–3 days prior to WGP treatment as described above. Treated Mϕ were then incubated with pHrodo bioparticles at 0.1 mg/mL in MDM at 37°C, 5% CO2 in a Cytation 3 plate reader (Biotek) and read with excitation and emission wavelengths of 560 nm and 590 nm, respectively. Readings were taken every 5 min over a 2 h period to generate kinetic curves. After phagocytosis reading, the bioparticle-containing media was replaced with DMEM containing Hoescht 33342 (NucBlue reagent, Fisher Cat# R37605), incubated for 15 minutes, and washed three times with PBS before reading at excitation and emission wavelengths of 360 nm and 460nm, respectively. The phagocytosis readings were normalized to the Hoescht readings.
Cytokine analysis
Cellular cytokine levels were obtained from RPPA analysis of protein extracts using appropriate antibodies, as described below. The spot intensity for each cytokine was normalized to the corresponding protein intensity acquired from the Fast Green protein staining prior to immunostaining. Medium cytokines were quantified on 10 μL samples using the Milliplex Human Cytokine/Chemokine Magnetic Bead Premixed 29 Plex Kit (cat# HCYTMAG-60K-PX29) per vendor’s protocol except that the method was adapted for 384-well plate assays by scaling down all reagents proportionally. Fluorescent bead reading was performed in 96-well plates with 80 μL Sheath Fluid per well on a Luminex 200™ analyzer (Luminex Corporation). Fluorescent intensity was calibrated with a standard curve of 29 cytokine standards at 0, 3.2, 6.4, 16, 80, 400, and 2000 pg/mL.
Tracer and WGP treatments of human Mϕ
At the end of the polarization period, Mϕ in 6-well plates were used as were or split into 12-well plates at 700,000 cells per well for tracer and WGP treatment. For the 13C6-Glc or 13C5,15N2-Gln experiments, media were changed to fresh MDM with unlabeled glucose or Gln replaced respectively by 0.2% 13C6-Glc or 2 mM 13C5,15N2-Gln. For the triple tracer experiment, media were changed to fresh MDM with unlabeled glucose, Gln, and Trp replaced respectively by 0.2% D2-Glc, 2 mM 13C5-Gln, and 78 μM 15N2-Trp. One set of M[IL4+IL13] in all tracer experiments were also treated with 100 μg/mL WGP (whole glucan particulates) and cultured for another 24 hr before harvest. Media were collected at 0 and 24 h after treatment and spun at 3,500 × g for 15 min at 4 °C to remove debris before extraction. At harvest, cells were rinsed twice in cold PBS and briefly (< 1 min) in nanopore water to remove salts before the addition of cold acetonitrile to quench metabolism (55).
Ex vivo human lung tissue slice experiments
Lung tissues were collected from consented patients at the operating room within 5 minutes of surgical resection and placed in DMEM media in accordance with HIPAA regulations. All tissue experiments were carried out via a protocol approved by the University of Kentucky Insitutional Review Board (IRB) (IRB 14–0288-F6A). The pair of CA and NC tissues were thinly sliced to < 1 mm thickness as previously described (56, 57) and incubated in glucose and Gln-free DMEM media supplemented with dialyzed fetal bovine serum (FBS), penicillin, streptomycin, and 15 mM 13C6-Glc + 2 mM unlabeled Gln or 2 mM 13C5,15N2-Gln + 15 mM unlabeled glucose ± 100 μg/mL WGP for 24 h at 37 °C/5% CO2 with gentle rocking to facilitate nutrient uptake and waste product mixing. Culture media were sampled at 0 and 24 h of incubation. Tissue slices were then quickly rinsed 3 times in cold PBS and then briefly in nanopure water to remove medium components and salts, blotted dry, weighed on a 4-place balance, and flash-frozen in liquid N2.
Metabolite and protein extractions
Polar extraction of human Mϕ in plates quenched as above was performed as previously described (58). Briefly, cells were scraped twice in acetonitrile:nanopure water (2:1.5, v/v), followed by addition of CHCl3 to a final ratio of 2:1.5:1 acetonitrile:nanopure water:CHCl3. The top layer of polar extracts was aliquotted and lyophilized for NMR and IC-UHR-FTMS analysis. The remaining pellets were removed of lipids as described previously (59). The residues after lipid extraction were homogenized in SDS buffer containing 62.5 mM Tris (pH=6.8), 2% SDS, and 1 mM dithiothreitol using a mini-pestle, followed by centrifugation at 14.8 k rpm for 10 min at 4 °C to obtain protein extracts. Protein concentrations were determined by microBCA assay (Pierce Chemical), per vendor’s protocol.
For tissue extraction, the frozen tissue slices were homogenized in 60% cold CH3CN in a ball mill (Precellys-24, Bertin Technologies, Washington, DC, MD) for denaturing proteins and optimizing extraction. Polar metabolites were extracted by the same solvent partitioning method as described above (58). The polar extracts were lyophilized in aliquots for NMR and IC-UHR-FTMS analysis.
All culture media were deproteinized in 80% acetone at −80 °C for 0.5 h before centrifugation, lyophilization, and reconsititution in 100% D2O for 1H NMR analysis (60). In parallel, 10 μL of each medium sample or an aliquot of cell polar extracts was derivatized in ethyl chloroformate (ECF) before direct infusion UHR-FTMS analysis as described previously (61) (ECF-UHR-FTMS). This method complemented NMR or IC-UHR-FTMS analysis by quantifing all amino acids and their isotopologues.
IC-UHR-FT-MS analysis
Ion chromatography-ultra high-resolution-Fourier transform-MS (IC-UHR-FTMS) was performed as previously described (52). Briefly, polar extracts were reconstituted in 20 μL Nanopure water, and analyzed by a Dionex ICS-5000+ ion chromatograph interfaced to an Orbitrap Fusion Tribrid mass spectrometer (Thermo Fisher Scientific, San Jose, CA, USA) operating at a resolution setting of 500,000 (FWHM at m/z 200) on MS1 acquisition to capture all 13C isotopologues. The chromatograph was outfitted with a Dionex IonPac AG11-HC-4 μm RFIC&HPIC (2 × 50 mm) guard column upstream of a Dionex IonPac AS11-HC-4 μm RFIC&HPIC (2 × 250 mm) column. Chromatography and mass spectrometric settings were the same as described previously (60) with an m/z range of 80 to 700. Metabolites and their isotopologues were identified and their peak areas were integrated and exported to Excel via the TraceFinder 3.3 (Thermo) software package. Peak areas were corrected for natural abundance as previously described (62), after which fractional enrichment and μmoles metabolites/g protein were calculated to quantify 13C incorporation into various metabolites.
1H NMR analysis of polar extracts
Lyophilized polar extracts were dissolved in 35 μL D2O containing 8.81 nmoles of d6-DSS (2,2-dimethyl-2-silapentane-5-sulfonate, Cambridge Isotope Laboratories, Tewksbury, MA) for NMR analysis. NMR spectra were recorded at 15°C on a 1.7 mm inverse triple-resonance HCN cryoprobe on a Bruker AVANCE III NMR at 16.45 T (Bruker Corp., Billerica, MA). A 1H 90° pulse with solvent presaturation was used to acquire 1D 1H spectra with a 8403 Hz spectral width, 2 sec acquisition time, 4 sec relaxation delay, and 512 transients. The free induction decays were zero-filled to 131,072 points, apodized with a 1 Hz line-broadening exponential before Fourier-transformation, followed by phasing, baseline correction and referencing to the internal DSS resonance at 0 ppm. 1D 1H{13C} HSQC spectra were recorded with 13C broad band adiabatic decoupling during the acquisition time of 0.25 s. 4200 data points were collected for each transient and a total of 1024 transients were acquired with 12 ppm (8403 Hz) spectral width with a recycle time of 2 s. The HSQC spectra were then apodized with unshifted Gaussian function and 4 Hz exponential line broadening and zero filled to 16384 data points before Fourier transformation, phasing, and baseline correction. The metabolites were identified using in-house databases (63–65) The “peak picking” routine in the MestReNova software (Mestrelab Research S.L., Santiago de Compostela, Spain) was used to quantify resonances of interest such as the central and 13C satellites of the methyl resonance of lactate and those of the anomeric 1H resonance of α-glucose. Each peak area was ratioed to that of the methyl resonance of d6-DSS to determine the analyte quantity, and then normalized to the cell protein content. The final metabolite content was expressed as μmole/g protein.
Protein analysis by Reverse Phase Protein Array (RPPA)
Protein extracts (at 0.34 to 1.25 mg/mL) from the tracer experiments of Figs. 2, S1–3, and 6 were mixed at a 1:1 ratio with a printing buffer (ArrayJet, Ltd.) before printing as 2–4 drops per spot onto a glass slide coated with 16 nitrocellulose membrane pads (ONCYTE SuperNOVA 16–6 mm, Grace Bio-Labs cat# 705016) using a microarray printer (ArrayJet, Ltd. Roslin UK) as previously described (66). Membranes were incubated in a 1:2×10⁶ dilution of 0.001% stock of Fast Green protein stain in 30% methanol + 7% acetic acid for 5 min, dried and scanned with InnoScan 710 AL Microarray Scanner (Innopsys, Inc. Carbonne France) to determine the amount of proteins deposited per sample spot. Slides were then rinsed in Nanopure H2O and washed twice at 5 min each in TBST (20 mM Tris, 150 mM NaCl, 0.001% Tween 20, pH 7.6) with each pad sealed under ProPlate slide chambers (Grace Bio-Labs). After blocking for 30 min in TBST containing 5% FBS (blocking buffer), each pad was incubated in a primary antibody (at 1:50 to 200 dilution; see below for vendor information) against a protein target for 2 h at room temperature, followed by rinsing 3 times at 5 min each in TBST and incubation with fluorescent secondary antibody (LICOR-IRDye 800) at 1:1000 dilution in blocking buffer for 1 h at room temperature. Slides were rinsed 3 times for 5 min each in TBST and vacuum-suctioned to dryness before scanning using InnoScan. Fluorescence image analysis of spots was done using the Innopsys Mapix software. Background fluorescence for each spot was subtracted from the fluorescence signal for that spot, followed by normalization to the corresponding Fast Green signal. Normalized signals were averaged across replicates.
Figure 2. Pathway tracking via triple tracers reveals time-dependent changes in nutrient uptake, glycolysis, and Krebs cycle activities in UK096 Mϕ in response to differential polarization and WGP treatments.

UK096 Mϕ were prepared and treated as in Fig. 1 except for the addition of the triple tracer (2H2-Glc + 13C5-Gln + 15N2-Trp) mixture as described in the Methods. Polar extracts of the cells and media were analyzed by 1H NMR (Aa-f, b’) and IC-UHR-FTMS (the rest). The pathway schemes track the fate of pre-existing 12C (●)/14N (◆) and 13C/15N ( ) atoms from 13C5-Gln and 15N2-Trp into medium and cellular metabolites through uptake/secretion, glycolysis, the Krebs cycle, and GSH/Trp metabolism. ●: 12C; ●, ●: 13C from PDH- and ME-initiated Krebs cycle reactions, respectively A: Unlabeled (0), 2H-labeled (D*), and 13C-labeled (C*) metabolite distributions in media (Aa-f, b’) and cells (g-h; g’-h’). B: Cellular 2H - (D*) and 13C-isotopologue (C*) distributions of Krebs cycle metabolites (a-g; a’-g’). Each data point was an average of 2 or 3 replicates. Glc: glucose; GSH: glutathione; 2HG: 2-hydroxyglutarate; Ita: itaconate; αKG: α-ketoglutarate; Lac: lactate; QA: quinolinate; Suc: succinate; SucCoA: succinyl coenzyme A; AST: aspartate aminotransferase; FH: fumarate hydratase; GLS: glutaminase, IDO: indoleamine-2,3-dioxygenase; IDH: isocitrate dehydrogenase, IRG1: immune-responsive gene 1 or aconitate decarboxylase (ACOD1); ME: malic enzyme: PDH: pyruvate dehydrogenase; PC: pyruvate carboxylase; SDH: succinate dehydrogenase; Ex: extracellular. Student t-test p values for pair-wise comparison among M1, M2, and M2WGP Mϕ will be provided as a table upon request.
Figure 6. IM Metabolic responses of ex vivo lung OTC of NSCLC patients to WGP treatment.

Cancerous (CA) and matched non-cancerous (NC) lung OTC were freshly prepared from five NSCLC patients and cultured in the presence of 13C6-Glc (UK052, C; UK020, B) or 13C5,15N2 Gln (UK021, A; UL065 and UK062, B) ± WGP for 24 h, followed by extraction and analysis by NMR and IC-UHR-FTMS as described in the Methods. The pathway schemes track the fate of preexisting 12C (●) and 13C (●,●,●) atoms from 13C6-Glc or preexisting 12C/14N (◆) and 13C/15N (◆) atoms from 13C5,15N2-Gln into metabolites of glycolysis, the Krebs cycle, pyrimidine/purine synthesis pathways, and glutaminolysis. X-axis denotes the number of 13C (0-x; C1-Cx) and/or 15N atoms in isotopologues of metabolite. ●: PC-initiated Krebs cycle reactions; all other symbols and abbreviations are as in Fig. 2. A: Isotopologue distributions of metabolites for Patients UK021, n=1; B-C: those for Patients UL065, UK062, and UK052, respectively, n=2; D: WGP-induced changes in mitotic index (green or PCNA) and necroptosis (red or RIP1) in CA OTC of NSCLC patient UK062, n=2. Student t-test p values for pair-wise comparison among M1, M2a, and M2WGP Mϕ will be provided as a table upon request. Note that WGP-induced changes in the labeling patterns of many individual metabolite showed large variations, presumably due to the intrinsic tissue heterogeneity. However, the same trend was evident for multiple metabolites in the Krebs cycle, which points to a change in the cycle activity.
The primary antibodies used were obtained from the following vendors with the following catalogue numbers. ProteinTech Group: Caspase 3, 19677–1-AP; CD38, 60006–1-Ig; CS, 16131–1-AP; CSF1, 25949–1-AP; CSF2, 17762–1-AP; FBP1, 12842–1-AP; FH, 11375–1-AP; G6PD, Ag5526; GLUD1, 14299–1-AP; GLUT1, 18068–1-AP; GSK3B, 22104–1-AP; GYS1, 10566–1-AP; HIF-1α, 20960–1-AP; HK3, 13333–1-AP; IDH1, 66197–1-Ig; IDH2, 15932–1-AP; IDO1, 13268–1-AP; IFNγ, 15365–1-AP; IL-1β, 16806–1-AP; IL4, 66142–1-Ig; IL6, 66146–1-Ig; IL10, 60269–1-Ig; IL23A, 66196–1-Ig; KGA/GAC (GLS1), 12855–1-AP; LDHA: 19987–1-AP; c-MAF, 55013–1-Ap; MDH1, 15904–1-AP; OGDH, 15212–1-AP; PC, 16588–1-AP; PCK1, 16754–1-AP; PCK2, 14892–1-AP; PDHE1α, 21829–1-AP; PFKFB3, 13763–1-AP; PGD, 14718–1-AP; PKM2, 60268–1-Ig; PYGB, 55380–1-AP; PYGL, 15851–1-AP; QPRT, 25174–1-AP; SDHB, 10620–1-AP; TGF-β1, 21898–1-AP; TNFα, 60291–1-Ig; VEGF, 19003–1-AP. Abnova: CLEC7A, PAB2591. Biomatik: ACOD1, CAC08562. Invitrogen: CD166, MA5–23850; GLS2, PA5–72963; MDH2, PA5–21700; CCL3, AHC6034; IL-13, 14–7139-81. BD Biosciences: CD206, 555954. St. Johns Labs: GOT2, STJ99292. Trevigen: PAR, 4335-MC-100.
Statistical analyses
Kinetic curve fitting was carried out by non-linear regression using Kaleidagraph (Synergy software, v 4.5) to obtain the linear slope values, which were reported as means ± sem. Pairwise comparisons were made using the 2-tailed Student t-test. For the phagocytosis assays, the normalized fluorescence time course data were analyzed as single exponential, as linear regressions to the last 13 points, or as the full curves according to the equation:
| (1) |
where S(t) is the observed signal, a is the intercept at t=0, b is the slope of the linear region at t > 60 minutes, and k is an apparent rate constant that describe the curved portion of the time course. The program returns the best estimate for the parameters a, b and k, the standard deviation of the estimates as well as the correlation coefficient and χ2 for the fits. The linear slope parameters were evaluated for changes among treatments using the Student 2-tailed t test.
For ratios r = a/b, the errors were calculated assuming independence of the components as
| (2) |
where Δa and Δb are the standard errors of a and b respectively, and <r> is the mean of the ratio r.
Time courses for each donor were analyzed on three technical replicates and compared for different treatments using the unpaired Student 2-tailed t test.
Results
Functional responses of human macrophages to differential polarization and WGP treatments
Expression of lineage markers
After 2 days of LPS+IFNγ or IL4+IL13 polarization, human Mϕ’s responded with an overexpression of IDO1 or CD206 (relative to unstimulated Mϕ, M[CSF1] or M0-Mϕ), respectively, as illustrated for the UK166 Mϕ in Fig. 1A. The time course of these responses differed among different donors, particularly for the IDO1 expression. The LPS+IFNγ-polarized Mϕ, herein referred as M[LPS+IFNγ] or M1-Mϕ of UK096 (male age 67), UK094 (female age 65), and UK166 (female, age 25), showed an increase in IDO1 overexpression with 1 to 3 days of treatment, while that of UK168 (male, age 31) did not (Fig. 1B). IDO1 overexpression was reported in M1 type human Mϕ but CD206 overexpression was not evident for M2 type human Mϕ after 1 day of polarization (67). This difference in CD206 expression patterns between the literature and ours could be a result of different methods (IL4+IL13 versus IL4 only) of polarization. WGP treatment attenuated CD206 overexpression in all four donors’ Mϕ treated with IL4+IL13 (M[IL4+IL13] or M2a-Mϕ; herein referred as M2-Mϕ), independent of the duration of the treatment. WGP also enhanced IDO1 expression in M2-Mϕ (relative to M1-Mϕ) but only after 3 days of polarization for UK096. These data on the expression of lineage markers suggest plasticity of human Mϕ in terms of functional responses elicited by different polarization methods and timing. They also point to the importance of reporting the polarization method and duration for proper comparison of responses of Mϕ lineage markers to immune perturbations.
Figure 1. Human macrophages display differential lineage markers and phagocytosis/ immune effector production in response to polarization and WGP treatments.

Human Mϕ were prepared from the PBMCs of four donors, polarized, and treated with WGP as described in the Methods. Cells were stained for lineage markers CD206 and IDO as well as subjected to phagocytosis and cytokine/chemokine assays as described in the Methods. A: CD206 (orange) and IDO (green) staining for M[CSF1] (M0), M[LPS+IFNγ] (M1), and M[IL4+IL13] (M2) ± WGP of UK166 after 2 days of polarization. B: Average image intensities (n=3) normalized to those of M0 CD206 and IDO. C: Time course changes (n=3) in the phagocytosis rate (slope of the linear time course) for four donors’ Mϕ. Phagocytosis rates were normalized to those of M0. D: Pro- (IL-1β, IL-6, IFNγ, TNFα, and IP-10 or CXCL10) and anti-inflammatory effector (IL-10) release into the medium (n=3). Student t-test p values for pair-wise comparison among M1, M2, and M2WGP Mϕ will be provided as a table upon request.
Phagocytosis
As phagocytosis is important both for bactericidal action and tissue repair (68), we determined the dependence of the phagocytotic capacity in human Mϕ. on polarization method/duration or WGP treatment. Figure 1C shows the time-dependent response of phagocytosis to differential polarization and WGP treatments for the four donors. M1-Mϕ (■) had a lower basal phagocytotic capacity than M0-Mϕ (●) or M2-Mϕ (▲) regardless of the donor or polarization time. This is consistent with a recent report on reduced phagocytosis in human Mϕ with the inflammatory phenotype (42). However, the time-course changes in the phagocytotic capacity differed among the individual donors, i.e. that in the M2-Mϕ of UK094, UK166, and UK168 decreased with time while that in the M2-Mϕ of UK096 did not. In all four cases, WGP treatment (▼) robustly decreased this capacity in M2-Mϕ toward that of the M1-Mϕ.
Cytokine/chemokine release
We further measured key cytokine/chemokine (effectors) release into the medium by the four donors’ Mϕ. We saw in general enhanced release of proinflammatory effectors by M1-Mϕ (■) versus M0-Mϕ (●) for all four donors, including IL-6, IFNγ, TNFα, and IL-1β (except for UK096 and UK166 for which IL-1β levels were too low to determine) (Fig. 1D). The time-course of these effector changes varied among donors except for that of IFNγ, which consistently decreased from Day 1 to Day 3. IFNγ release by M1-Mϕ was also consistently higher than that by M2-Mϕ (▲), for all donors and polarization durations. However, enhanced release of TNFα, IL-1β, and IL-6 by M1-Mϕ versus M2-Mϕ was donor and time-dependent. Likewise, the enhanced release of immunosuppressive cytokine IL-10 (69) by M2-Mϕ versus M1-Mϕ was donor- and time-dependent. An opposite response of IL-10 release by M2-Mϕ versus M1-Mϕ was reported previously (67), which points to the plasticity of this cytokine’s response to differential polarization. Moreover, enhanced release of proinflammatory chemokine CXCL10 (IP-10) was evident from Day 1 to Day 3 for M1-Mϕ versus M2-Mϕ for all donors. CXCL10 can recruit tumor-infiltrating T cells and NK cells for tumor suppression (70) but can also induce tumor metastasis via interaction with its receptor CXCR3 (71). CXCL10 and CXCR3 were overexpressed in metastatic lung adenocarcinoma specimens and associated with poor prognosis (72).
WGP treatment (▼) had a profound effect on effector releases by human M2-Mϕ. WGP consistently enhanced the release of IL-1β, IL-6, and TNFα by M2-Mϕ of all four donors and often to levels above those in M1-Mϕ (Fig. 1D). But, it failed to promote IFNγ release by M2-Mϕ in all but one case (UK096). WGP also enhanced the release of anti-inflammatory IL-10 but had little effect on the CXCL10 release by M2-Mϕ of all four donors. Thus, a dichotomy of WGP’s effect existed in terms of immune functions. On the one hand, WGP elicited M1-like proinflammatory responses, which is consistent with its known M1 repolarization effect on M2-type mouse Mϕ (7). On the other hand, WGP further promoted IL-10 release by M2-Mϕ, which contrasts with its suppression of IL-10 gene expression in mouse M2-Mϕ (7). IL-10 is generally known as a key cytokine for repressing proinflammatory responses while facilitating tissue repair (73).
Polarization- and WGP-induced metabolic reprogramming in human macrophages and its dependence on polarization duration.
In parallel to the functional characterization described above, we used triple tracers- 2H2-glucose +13C5-Gln + 15N2-Trp or single tracer [13C6]-glucose (13C6-Glc) to track the time course changes of the metabolic activities in the Mϕ derived from the four donors in response to differential polarization and WGP treatment. Cells were polarized for 1 to 3 days before tracer addition to all treatments and WGP addition to M2-Mϕ for another 24 h. The 13C, 15N, and/or 2H incorporation into metabolites of various metabolic pathways was determined by a combination of NMR and ultra high-resolution Fourier transform mass spectrometry (UHR-FTMS) methods (61, 66).
Changes in Glycolysis, Krebs cycle, and the quinolinate pathway in different polarization states of macrophages
With 2H2-Glc +13C5-Gln + 15N2-Trp as tracers, we tracked simultaneously the time course changes in glycolytic, Krebs cycle, and Trp catabolic activities in human Mϕ in response to polarization and WGP. As shown in Figure 2A, 2H2-Glc (a) and 13C5-Gln (c) were consumed while releasing respectively 2H-lactate (b) and 13C-lactate (b’) into the medium by UK096’s Mϕ. Accurate quantification of Gln consumption was difficult because it accounted for only a small fraction of the Gln administered. It is clear that LPS+IFNγ-polarized M1-Mϕ (■) did not show significantly enhanced 2H- or 13C-lactate release, nor buildup of cellular 2H /13C-lactate (g, g’) relative to M2-Mϕ (▲) or M0-Mϕ (●), which together with no significant changes in Glc consumption indicates at most minor changes in glycolytic activity. This response is contrary to the accelerated glycolysis observed in M1-type mouse Mϕ (25). In contrast, compared to the other three Mϕ types, Trp consumption by M1-Mϕ (f) was greatly enhanced and was accompanied by a large buildup of 15N-quinolinate (N*-QA, I’) and unlabeled QA (0-QA, i), which indicate activated Trp catabolism into QA. WGP treatment of M2-Mϕ (▼) enhanced 2H-Lac release (b), cellular 2H -lactate buildup, and Glc consumption but had little effect on 13C-lactate release, which suggests enhanced glycolysis but not Gln transformation into lactate via glutaminolysis. The latter agrees with no significant changes in the release of 13C-Glu (d) and -succinate (Suc, e) or in the buildup of cellular 13C-2-hydroxyglutarate (h’), which are also products of glutaminolysis. However, we saw enhanced buildup of 13C-2HG and 2H-2HG (h) in M1-Mϕ versus M1-Mϕ, which suggests that the 2HG synthesis pathway was activated by LPS+IFNγ polarization.
The above findings were largely recapitulated in the Mϕ of UK094, UK168, and UK166 (Fig. S1A). These included lack of accelerated glycolysis in M1-Mϕ, WGP-induced activation of glycolysis in M2-Mϕ (a-c), as well as enhanced synthesis of 2HG from Gln (d-f) and QA from Trp in M1-Mϕ (g-i). Notable responses that differed among donors’ Mϕ included WGP-enhanced synthesis of 2HG from Gln in M2-Mϕ of UK166 (f), that of QA from Trp in M2-Mϕ of UK168 (h), diminished (instead of sustained) synthesis of QA from Trp from 1 to 3 days polarized M1-Mϕ of UK094 (g), as well as increased release of Gln-derived Glu (k) and succinate (n) into the medium by M1-Mϕ of UK168 (Fig. S1A). Note that enhanced succinate release may be related to the enhanced depletion of cellular 13C-succinate in M1-Mϕ of UK168 (d’, Fig. S2B). Together, these data point to the plasticity of glycolytic/glutaminolytic activation in response to M1-type polarization and WGP treatment.
Tracking the glycolytic product 2H2-pyruvate into the Krebs cycle, we found depletion of the pyruvate dehydrogenase (PDH)-mediated production of 2H-citrate (D*-citrate) in UK096’s M1-Mϕ versus M2-Mϕ after 1 to 3 days of polarization (f) (Fig. 2B), which is consistent with reduced Krebs cycle activity reported for mouse M1-Mϕ (23). However, we did not observe a buildup of 2H-α-ketoglutarate (D*-αKG, b) resulting from a break at isocitrate dehydrogenase (IDH), nor did we see a buildup of 2H-succinate (d) with depletion of 2H-fumarate (e) resulting from the break at succinate dehydrogenase (SDH) in the Krebs cycle. These two breaks are known to occur in mouse M1-Mϕ (23). However, significant buildup of 2H-citrate-derived 2H-itaconate (D*-ItaC, g) was evident in the Day 1 polarized M1-Mϕ, which diminished in the Day 2 and Day 3 counterparts. This buildup of glucose-derived itaconate is consistent with that seen in mouse M1-Mϕ (23, 51). We also tracked the transformations of the product of glutaminolysis 13C5-Glu through the Krebs cycle and into glutathione (GSH) biosynthesis. 13C5-Glu (a’) was predominantly converted to 13C5-GSH (c’), as evident from the high buildup of 13C5-GSH, particularly in the M1-Mϕ. 13C5-Glu was also converted via the Krebs cycle to 13C-succinate (d’), -fumarate (e’), and -citrate (f’), more so in M1-Mϕ (■) than M2-Mϕ (▲) during Day1 or Day 2 of polarization. The production of 13C-lactate from 13C Gln (b’, g’, Fig. 2A) points to the activity of malic enzymes (ME), which converts 13C-malate to 13C-pyruvate and subsequently to 13C-lactate. The high amounts of 13C-lactate (in mmoles/g protein released into the medium (b’, Fig. 2A) compared with the much lower levels of the Krebs cycle intermediates (in μmoles/g protein, b’-f’, Fig. 2B) suggests that this anaplerotic ME pathway is very active in human Mϕ. Moreover, we saw elevated buildup of 13C-itaconate in M1-Mϕ in a similar time course as that for 2H-itaconate except at a higher level (g’ versus g, Fig. 2B). This suggests that Gln is a more important source for fueling itaconate synthesis in UK096’s M1-Mϕ. Itaconate has been shown to induce the development of immune tolerance in LPS-treated human monocytes, in addition to being an anti-microbial metabolite (51). Gln was also a better fuel for the enhanced production of another key immunoregulatory metabolite 2HG in UK096’s M1-Mϕ, as described earlier. However, glycolysis was not significantly enhanced in UK096’s M1-Mϕ, implicating the presence of counteracting mechanism for regulating glycolysis. For example, 2HG buildup could activate prolyl hydroxylase, thereby destabilizing HIF1α to attenuate glycolysis (74).
WGP had a polarization time-dependent effect on the Krebs cycle activity in UK096’s M2-Mϕ. Notably, it suppressed the synthesis of αKG (b, b’) and succinate from both glucose and Gln (d, d’) (Fig. 2B) in one-day polarized M2-Mϕ but this effect was diminished after 3-day polarization. In contrast, WGP has insignificant effect on glucose-fueled fumarate production after 1-day polarization but enhanced it after 2 to 3-days of polarization (e), which was also the case for glucose-fueled Glu synthesis (a). The opposite effect of WGP on succinate and fumarate production could be mediated by SDH activation, which is consistent with β-glucan’s ability to restore SDH expression in tolerant human monocytes (51). Also, fumarate accumulation was shown to revert the tolerizing effect of itaconate (51). As such, WGP’s capacity to repolarize M2- to M1-type Mϕ increases with polarization duration for UK096.
A similar trend in responses of Mϕ to polarization methods/duration and WGP treatment were seen for the other three donors UK094, UK168, and UK166. These included no apparent breaks at the IDH (a-f) and SDH (g-l) sites in M1-Mϕ (Fig. S1B), highly active ME pathway in all Mϕ types that led to abundant release of 13C-lactate into the medium (Fig. 2A–b’ and data not shown), depletion of 2H-citrate in M1- versus M2-Mϕ (a-c), and highest buildup of 13C-itaconate in 1-day polarized M1-Mϕ (m-o) (Fig. S1B). However, other responses showed plasticity, notably the lack of WGP effect on 13C-fumarate synthesis from Gln in M2-Mϕ for UK094 (j) and UK168 (k) and the much lower production of itaconate from Gln by M1-Mϕ for UK094 and UK166 (m and o, Fig. S1B) than for UK096 and UK168 (n, Fig. S1B; o, Fig. 2B). These differences are expected to impact immune functions. It should also be noted that the UK094’s Mϕ were less tightly bound to culture plates and suffered from losses during cell harvest for metabolite extraction, leading to the inability to reliably determine the very low levels of 2H-αKG, 2H-succinate, 2H-fumarate, and 2H-itaconate (Fig. S1B).
Our SIRM data suggest that the initial part of the Krebs cycle was consistently attenuated in the human M1-Mϕ but this attenuation is unlikely to result from the breaks at the IDH and SDH sites reported for the mouse M1-Mϕ. Our results also suggest that itaconate synthesis in the human M1-Mϕ was mainly fueled by Gln while its consistent enhancement and subsequent diminishment from 1 to 3 days of polarization is expected to elicit robust changes in immune functions. Moreover, the variable effect of WGP on succinate to fumarate conversion in the M2-Mϕ could lead to variable capacity for immune resolution and tissue repair.
Activation of Pentose phosphate pathway and gluconeogenesis in different polarization states of macrophages
In addition to glycolysis, we traced the pentose phosphate pathway (PPP), which is an important route of glucose utilization, for the four donors’ Mϕ in response to differential polarization and WGP treatment, as shown in Figures 3 (UK096) and S2 (UK094, UK168, UK166). Enhanced PPP activity in UK096’s M1-Mϕ versus M2-Mϕ after all 3 days of polarization was evidenced by the increased buildup of 2H2-Glc-derived PPP intermediates including 2H-ribose-/ribulose-5-phosphate (D*-R5P, c), and 2H-sedoheptulose-7-phosphate (D*-S7P; d-d’), and 2H-fructose-6-phosphate (D*-F6P, e) (Fig. 3). We also noted the depletion of 2H-6-phosphogluconate (D*-6PG, b) and the buildup of the product 2H-R5P in the M1-Mϕ regardless of the polarization times, which suggests activation of PGD (6-phosphogluconate dehydrogenase in the oxidative branch of PPP) activity and thus enhanced NADPH production. 6PG depletion and PGD gene upregulation was reported previously in mouse M[LPS+IFNγ] versus M[IL4] after 1 day of polarization (23).
Figure 3. Temporal dependence of reprogrammed pentose phosphate pathway and gluconeogenesis in UK096 Mϕ in response to polarization and WGP treatments.

Polar extracts from Fig. 2 were analyzed for the distribution of PPP and gluconeogenic metabolites by IC-UHR-FTMS. The pathway scheme tracks the fate of preexisting 12C (●) and 13C (●) atoms from 13C5-Gln into metabolites through both oxidative and non-oxidative branches of PPP as well as GNG. Not all expected labeled metabolites were shown and Dx in parenthesis denotes scrambled D positions across different C atoms. Time course changes in the abundance of metabolite isotopologues (n=3) shown include D* (sum of all 2H-labeled species) and C*Dx (sum of all 13C-labeled species that contained 0 to x number of D). G6P: glucose-6-phosphate; 6PG: 6-phosphogluconate; R5P: ribulose/ribose-5-phosphate; S7P: sedoheptulose-7-phosphate; GAP: glyceraldehyde-3-phosphate; X5P xylulose-5-phosphate, E4P: erythrose-4-phosphate; F6P: fructose-6-phosphate; G6PD glucose-6-phosphate dehydrogenase; PGD 6-phosphogluconate dehydrogenase; TK transketolase; TA transaldolase. Student t-test p values for pair-wise comparison among M1, M2, and M2WGP Mϕ will be provided as a table upon request.
WGP treatment of the M2-Mϕ led to a buildup of 2H-6PG with no accumulation of the product 2H-R5P, which points to attenuated PGD activity, opposite to the action of LPS+IFNγ. It should be noted that 2H-R5P, -S7P, and -F6P can also be formed from 2H2-Glc via the combined action of transketolase (TK) and transaldolase (TA) in the non-oxidative (non-Ox) branch of PPP, which is difficult to assess based on the 2H-labeling patterns of these metabolites alone. We thus performed a 13C6-Glc tracer experiment on UK096’s Mϕ under 2 days of polarization and WGP treatment for the M2-Mϕ. As shown in Fig. S2B, enhanced buildup of 13C5-S7P and 13C6-S7P (d, d’) occurred in the M1-Mϕ versus M2-Mϕ after 2 days of polarization, which suggests respectively increased activity of TK in the forward direction (green arrows) and TA in the reverse direction (blue arrows), i.e. increased carbon flow via both Ox and non-Ox branches of PPP. Enhanced synthesis of uniformly labeled G6P (13C6 a), R5P (13C5 c), S7P (13C7 d), and F6P (13C6 e) as well as increased conversion of 13C6-6PG (b) to 13C5-R5P was also evident in M1-Mϕ versus M2-Mϕ (Fig. S2B), which recapitulates the trend for the 2H2-Glc tracing (Fig. 3) and reflects increased PGD activity in the Ox branch.
We also saw 13C5-Gln-derived PPP metabolites in UK096’s Mϕ (a’-e’, Fig. 3), albeit at lower levels than those of the 2H-labeled counterparts. 13C labeling of these metabolites indicates their transformations from 13C5-Gln via gluconeogenesis (GNG). GNG occurrence is further confirmed by 13C incorporation into fructose-1,6-bisphosphate (C*Dx-F1,6BP, f’), F6P (e’), and G6P (a’). As the case for the 2H-labeled counterparts, enhanced buildup of 13C-R5P/S7P and depletion of 13C-6PG was evident in the M1-Mϕ versus M2-Mϕ, which again points to activation of the oxidative branch of PPP at the PGD site. We did not see a significant increase in 13C-F1,6BP (f’) conversion to 13C-F6P (e’) in the M1-Mϕ versus M2-Mϕ, which is catalyzed by the enzyme fructose-1,6-bisphosphatase 1 (FBP1). FBP1 was shown to be one of the top upregulated proteins in human M1-Mϕ versus M2-Mϕ (75). However, our RPPA analysis did not show such an increase in FBP1 expression (Fig. 5I), which corroborated our SIRM-based FBP1 activity assay. This disagreement may be due to the different method of M1 polarization, which used GM-CSF coupled with LPS in the previous study (75) versus M-CSF coupled with LPS+IFNγ in our study to generate M1-Mϕ. WGP treatment greatly enhanced the buildup of 13C-G6P, -F6P, and -F1,6BP in the M2-Mϕ, which suggests activation of GNG (76).
Figure 5. Temporal dependence of changes in metabolic proteins and immune modulators/effectors in four donors’ Mϕ in response to polarization and WGP treatments.
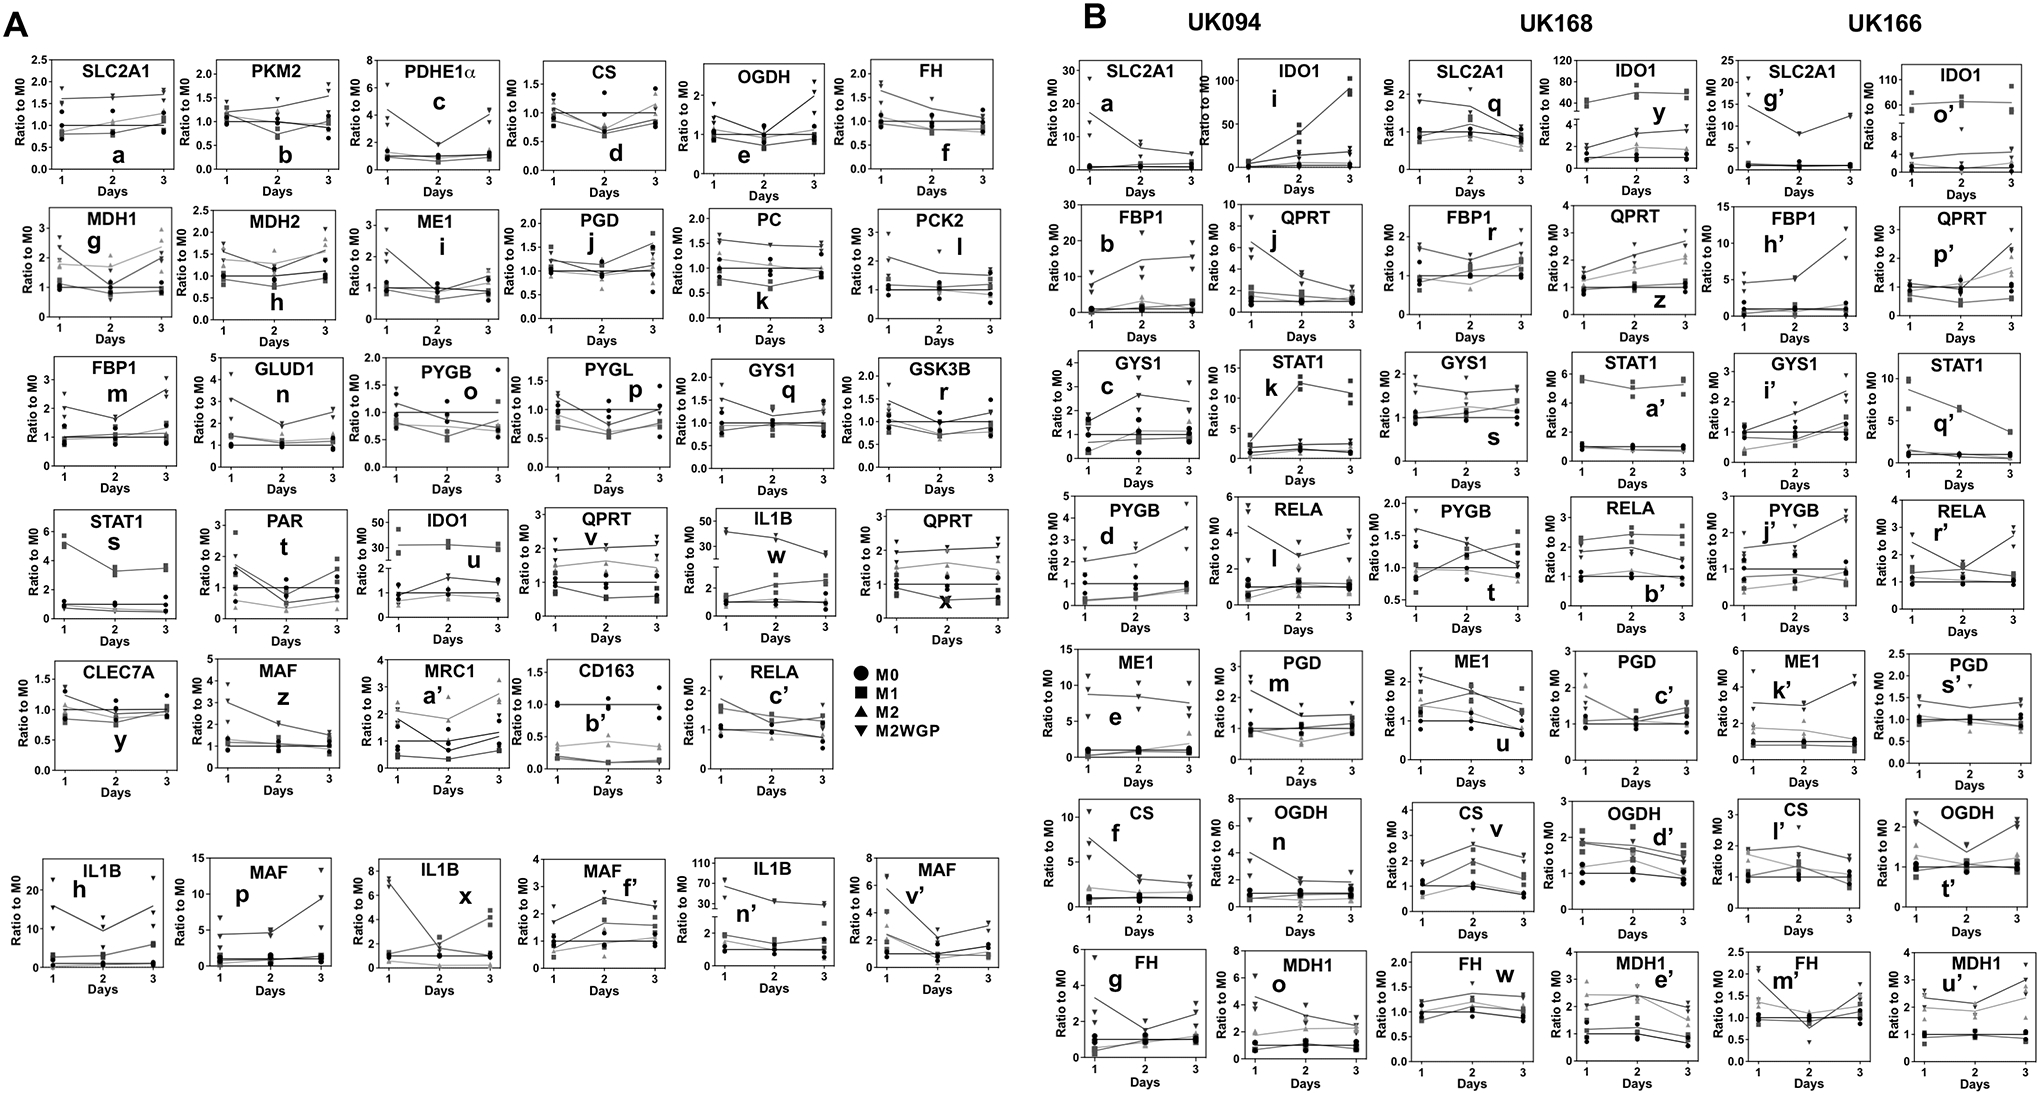
Cell lysates of UK096 Mϕ (A) from Fig. 2 and three other donors from Fig. S1 (B) were subjected to RPPA analysis of various protein targets, as described in the Methods. Image intensities for each target were normalized to those of total protein (n=3). GLUT1 or SLC2A1: glucose transporter 1. PKM2 pyruvate kinase M2 in glycolysis; PGD 6-phosphogluconate dehydrogenase in PPP. PDHE1α Pyruvate dehydrogenase E1 subunit alpha, CS citrate synthase, OGDH 2-oxoglutarate dehydrogenase, FH fumarate hydratase, and MDH1/2, Malate dehydrogenase 1/2 in the Krebs cycle. GLUD1 glutamate dehydrogenase 1 in the glutaminolysis pathway. PC pyruvate carboxylase, PCK1/2 PEP carboxykinase 2, and FBP1 fructose bisphosphatase 1 in gluconeogenesis. PYGB/PYGL glycogen phosphorylase brain/liver form, GYS1 muscle glycogen synthase, and GSK3B glycogen synthase kinase 3β; (liver forms) in glycogen metabolism. IDO1 indoleamine-2,3-dioxygenase 1, QPRT quinolinate phosphoribosyl transferase, and PAR PARylated proteins in Trp/NAD+ metabolism. IL1B interleukin 1 beta and NOS2 nitric oxide synthase 2 in immune function. CLEC7A C-type lectin domain containing 7A, MAF MAF BZIP transcription factor, MRC1 mannose receptor C-type 1, CD163 scavenger receptor cysteine-rich type 1 protein M130, and RELA nuclear factor NF-kappa-B P65 subunit in immune modulation. Student t-test p values for pair-wise comparison among M1, M2, and M2WGP Mϕ will be provided as a table upon request.
Similar activation of the oxidative PPP at the PGD site in the M1-Mϕ was evident for the other three donors, so did WGP enhancement of GNG in the M2-Mϕ, albeit less robust for UK094 and UK168 (Fig. S2A). In summary, LPS+IFNγ (M1) polarization activated both oxidative and non-Ox branches of PPP to enhance the production of NADPH and R5P while WGP stimulated GNG in IL4+IL13 (M2) polarized Mϕ. These altered metabolic events may help maintain redox homeostasis in the M1-Mϕ and anabolic capacity in WGP-treated M2-Mϕ.
WGP Increases glycogen synthesis in M2- like macrophages
Glycogen metabolism has been reported to modulate acute inflammatory responses via transformations into G6P to fuel NADPH production from the oxidative PPP, which then enables maintenance of high GSH levels for M[LPS+IFNγ] survival (77). We first tracked 13C6-Glc incorporation into UK096’s Mϕ in response to 2 to 3 days of polarization and WGP treatment. As shown in Fig. S3A, 13C-glycogen accumulated to a higher level in the M1-Mϕ versus M2-Mϕ after both 2 (–, c) and 3 days (–, c’) of polarization but its two precursors 13C6-G1P (a) and 13C-UDPG (b) did not buildup. These data suggest that glycogen accumulation is more likely to be caused by decreased glycogen degradation rather than increased glycogen synthesis in the M1-Mϕ. WGP treatment of the M2-Mϕ also led to enhanced buildup of 13C-glycogen in the M2-Mϕ after 2 days (–, c) but not 3 days (–, c’) of polarization, as was the case for its two precursors 13C-G1P/UDPG (a, b). These data are consistent with WGP stimulation of glycogen synthesis in 2-day but not 3-day polarized M2-Mϕ. A similar trend in the responses of 2H-G1P (d, g) and 2H-UDPG (e, h) to LPS+IFNγ polarization or WGP treatment of the M2-Mϕ was evident for the 2H2-Glc + 13C5-Gln tracer experiment. In addition, we saw large buildup of 2H2-G1P-derived 2H2-glucose-1,6-bisphosphate (G1,6BP, f) (78) elicited by WGP in the M2-Mϕ, which suggests diversion of G1P from glycogen to G1,6BP synthesis. Moreover, the fractional enrichment of 2H-G1P (g) increased but much less so for that of 2H-UDPG (h) and -G1,6BP (i) in WGP-treated versus control M2-Mϕ. The distinct responses of 2H enrichment in UDPG and G1P (g versus h) suggest additional input to the 2H-G1P pool, which presumably comes from 2H-glycogen degradation. Together, these data point to increased glycogen synthesis and utilization along with diversion of G1P to G1,6BP synthesis induced by WGP treatment in the M2-Mϕ.
The lack of a significant effect of M1 versus M2 polarization on 2H2-Glc incorporation into G1P and UDPG was also evident for UK168 (g, i) and UK166 (m, o) but not for UK094, which showed enhanced buildup of 2H-G1P/UDPG in one-day polarized M1-Mϕ (a, c) (Fig. S3B). Likewise, WGP’s effect on the M2-Mϕ was largely recapitulated for UK168 and UK166 but not for UK094 (a-e) in terms of 2H-G1P, 2H-UDPG, and 2H-G1,6BP (Fig. S3B). We were unable to track 2H incorporation into glycogen due to the low 2H-NMR sensitivity. However, by relating the changes in the labeling patterns of the precursors to the corresponding UK096’s data (Fig. S3A), we surmise that glycogen degradation is enhanced in UK166’s and UK168’s M1-Mϕ, while both glycogen synthesis and degradation were activated by WGP in UK166’s and UK168’s M2-Mϕ. In addition, diversion of G1P to G1,6BP synthesis in WGP-treated M2-Mϕ appeared to occur in all cases. Thus, both consistency and plasticity of glycogen metabolism were evident in human Mϕ in response to M1 polarization and WGP treatment, which is expected to have consequences in immune functions.
Nucleotide biosynthesis
A. Reprogrammed pyrimidine and hexosamine pathways implicate increased protein-glycosylation in M[IL4+IL13]
Glucose fuels the synthesis of pyrimidine and sugar nucleotides by providing precursors to the pyrimidine ring (Asp), ribose (phosphoribosyl pyrophosphate or PRPP), and the N-acetylglucosamine units (N-acetylglucosamine-1-phosphate or NAcGN1P) (Scheme in Fig. 4A). Fig. 4A showed that 2H2-Glc conversion to Asp (a) was not altered appreciably in UK096’s M1-Mϕ versus M2-Mϕ while 2H incorporation into PRPP (b) was enhanced after 1 to 3 days of polarization. The latter presumably results from enhanced PPP activity (Fig. 3). However, subsequent 2H labeling of UTP (c) was attenuated in the one-day polarized M1-Mϕ (■) versus M2-Mϕ (▲). This UTP response was opposite to that of its product UDP-N-acetylglucosamine (UDPGlcNAc) (e), which showed increased 2H labeling in the M1-Mϕ versus M2a-Mϕ, particularly after one day of polarization. 2H labeling in the other precursor NAcGN1P (d) did not differ between the M1-Mϕ and M2-Mϕ. WGP treatment of the M2-Mϕ (▼) repolarized 2H labeling of UTP towards the M1 type, which could be due to WGP-induced depletion of 2H-Asp (▼, a). In contrast, WGP had only a minor effect on 2H labeling of UDPGlcNAc but significantly enhanced that of the precursor NAcGN1P (d). These data point to regulation of UTP synthesis in the M1-Mϕ occurring downstream of Asp and that of UDPGlcNAc synthesis downstream of UTP and NAcGN1P. Changes in the fractional enrichment of 2H-UTP in response to polarization and WGP treatments (a, Fig. S4A) were consistent with those in the 2H-UTP level (c, Fig. 4A), which points to enhanced UTP synthesis by IL4+IL13 polarization and WGP suppression of this activity. However, we saw increased levels (e, Fig. 4A) with comparable fractional enrichment of 2H-UDPGlcNAc (b, Fig. S4A) in the M1-Mϕ versus M2-Mϕ, which, together with the reduced 2H labeling in the precursors UTP and NAcGN1P, suggest blocked UDPGlcNAc utilization in the M1-Mϕ. In addition, WGP treatment substantially increased the fractional enrichment of 2H-UDPGlcNAc in the M2-Mϕ with minor effect on the level, which also points to reduced utilization of UDPGlcNAc. UDPGlcNAc is a marker of N- and O-glycosylation of proteins, which were shown to be required for M2 polarization and functions (23, 79). Moreover, we saw 13C incorporation from 13C5-Gln into PRPP (b’) via GNG (Fig. 4A). The change patterns of 13C-labeled Asp (a’), PRPP, and UTP (c’) were largely akin to those of the 2H-labeled counterparts but those of UDPGlcNAc (C*NxDx-UDPGlcNAc, e’) and its precursor NAcGN1P (C*NxDx-NAcGN1P, d’) differed between the 13C- and 2H-labeled species, i.e. the 13C-UDPGlcNAc level was not enhanced in the M1-Mϕ versus M2-Mϕ, and WGP treatment did not elevate the level of 13C-NAcGN1P in the M2-Mϕ. As the 13C-labeled species included additional contribution of 15N derived from 15N2-Trp, our data suggest that Trp catabolism may have an important influence on UDPGlcNAc synthesis. Furthermore, the higher fractional enrichment of 13C-UDPGlcNAc in one-day polarized M2-Mϕ than the M1 counterpart (d, Fig. S4A) with depletion in its level (e’, Fig. 4A) again suggests activation of both synthesis and utilization.
Figure 4. Temporal dependence of reprogrammed nucleotide metabolism in UK096 Mϕ in response to differential polarization and WGP treatments.
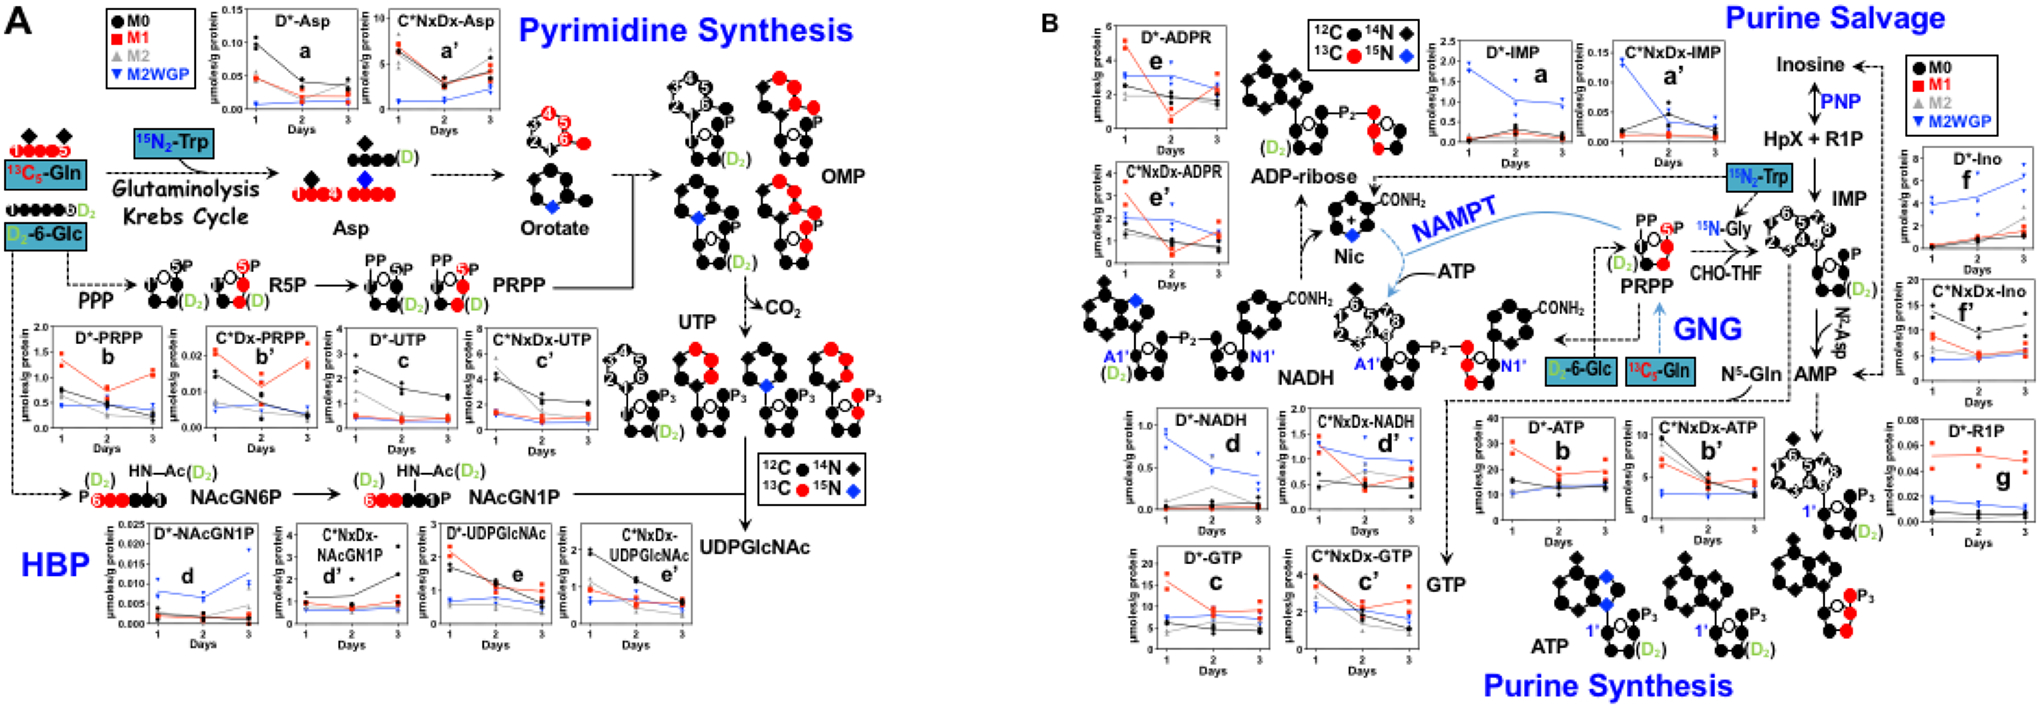
Polar extracts from Fig. 2 were analyzed by IC-UHR-FTMS for the distribution of labeled metabolite in the pyrimidine nucleotide/hexosamine biosynthesis pathways (HBP) (A) and the purine nucleotide/dinucleotide biosynthesis/salvage pathway (B). The pathway schemes track the fate of preexisting 12C (●)/14N (◆) and 2H (D)/13C (●)/15N (◆) atoms derived from the transformations of 2H2-glucose (D2-Glc), 13C5-Gln, and 15N2-Trp via glutaminolysis, the Krebs cycle, PPP, and Trp catabolism. Not all expected labeled metabolites were shown and Dx in parenthesis denotes scrambled D positions across different C atoms. The labeled species illustrated represent the top abundant 2H, 13C, and 15N isotopologues for each metabolite. Time course changes in the abundance of metabolite isotopologues shown (n=3) include D* (sum of all D-labeled species), C*NxDx (sum of all 13C-labeled species that contained 0 to x number of 15N and/or 2H), and 0 or unlabeled (12C/14N/1H). R5P: ribose-5-phosphate; PRPP: phosphoribosyl pyrophosphate; NAcGN1(6)P: N-acetylglucosamine-1(6)-phosphate; UDPGlcNAc: UDP-N-acetylglucosamine; HpX: hypoxanthine; Ino: inosine; R1P: ribose-1-phosphate; PNP: purine nucleoside phosphorylase; IMP: inosine monophosphate; CHO-THF: formyl tetrahydrofolate; PRPP: phosphoribosyl pyrophosphate; NAMPT: nicotinamide phosphoribosyl transferase; ADPR: ADP-ribose. Student t-test p values for pair-wise comparison among M1, M2, and M2WGP Mϕ will be provided as a table upon request.
Many of the pyrimidine metabolites in the Mϕ of the other three donors showed different labeling time course changes in responses to polarization and WGP treatments (data not shown). However, one consistent response was seen for all four donors, i.e. enhanced fractional enrichment of 2H-UDPGlcNAc in the M2-Mϕ by WGP (b, S4B-d to f) with decrease or no discernable changes in the levels (e, Fig. S4B-a to c). This suggests blocked UDPGlcNAc utilization by WGP for protein glycosylation, which was accompanied by reduced CD206 levels (Fig. 1) and presumably attenuated M2-type functions.
B. Reprogrammed purine nucleotide and dinucleotide pathways suggest activation of ADP ribosylation in M[LPS+IFNγ] and by WGP
Like pyrimidine nucleotides, glucose provides the precursors for the synthesis of purine nucleotides and dinucleotides (PRPP for ribose and Ser/Gly for purine rings) via the PPP and one-carbon pathway (Scheme in Fig. 4B) (66). 2H2-Glc incorporation into IMP both in terms of levels (a, Fig. 4B) and fractional enrichment (a, Fig. S4A) was comparable between UK096’s M1-Mϕ and M2-Mϕ but subsequent conversion to 2H-ATP (b, Fig. 4B; b, Fig. S4C) or 2H-GTP (c, Fig. 4B and data not shown) was enhanced in the M1-Mϕ versus M2-Mϕ. These data suggest activated ATP/GTP synthesis in the M1-Mϕ versus M2-Mϕ downstream of IMP synthesis. We also noted comparable 2H-IMP conversion to 2H-inosine (f, Fig. 4B; c, Fig. S4C) but subsequent conversion to 2H-ribose-1-phosphate (R1P, g, Fig. 4B; e, Fig. S4C) via the action of purine nucleoside phosphorylase (PNP) was enhanced in the M1-Mϕ versus M2-Mϕ. These data point to increased catabolism and/or salvage synthesis of purine nucleotides (80). To better delineate de novo versus salvage synthesis of purine nucleotides, we analyzed the 13C labeling patterns of purine nucleotide metabolites for the 13C6-Glc tracer experiment of Fig. S2,S4. We found that the fractional enrichment of the 13C5-isotopologues dominated for all metabolites regardless of the treatments (Fig. S4D) while that of 13C>5 (# 13C > 5 for ATP/GTP) or 13C>10 (# 13C > 10 for NADH/ADPR) isotopologues was negligible (data not shown). As the 13C5- and 13C>5/13C>10 isotopologues respectively represent 13C incorporation into ribose and nucleobase plus ribose (81), these data suggest that 13C6-Glc was incorporated mainly into the ribose unit of purine nucleotides via the salvage (80) rather than de novo synthesis pathway. We also noted that the fractional enrichment of 13C5-R1P (g) was higher than that of 13C5-Ino (f) and comparable to that of 13C5-R5P (a) (Fig. S4D), which indicates 13C6-Glc transformation to 13C5-R5P and then to 13C5-R1P as part of the salvage pathway (80). Thus, the heightened incorporation of 2H2-Glc into R1P and ATP/GTP in the M1-Mϕ points to enhanced production of ATP/GTP (Figs. 4B, S4C) mainly via the salvage pathway. Also noted was the WGP-enhanced incorporation of 2H2-Glc into IMP (a), inosine (c), and R1P (e) in the M2-Mϕ without promoting the buildup of 2H-ATP/GTP but with elevation of their fractional enrichment (b) (Fig. S4C and data not shown) and the buildup of 2H-NADH (d, Fig. 4B). These data point to enhanced salvage synthesis and utilization of ATP for fueling NADH/NAD+ synthesis in WGP-treated M2-Mϕ.
NAD+ is the substrate for ADP-ribosylation of proteins such as poly(ADP-ribose) polymerase (PARP) and the turnover of ADP-ribosylated proteins produces ADP-ribose (ADPR) (82). We saw respectively transient and sustained increase of 2H-ADPR levels in the M1-Mϕ and WGP-treated M2-Mϕ relative to the M2-Mϕ (e, Fig. 4B). Along with depletion of the precursor 2H-NAD(H) (d, Fig. 4B), ADPR buildup and increased release of nicotinamide (Nic) by the M1-Mϕ (i, Fig. S4D) indicate increased ADP-ribosylation activity and turnover. Our findings agree with a recent report on LPS-induced nicotinamide accumulation, NAD+ depletion, and buildup of PARylated PARP in human Mϕ (42). Furthermore, we saw an elevated ratio of 13C10-:13C5-ADPR (h, Fig. S4D) in WGP-treated M2-Mϕ versus untreated M2-Mϕ in the 13C6-Glc tracer study. A higher ratio not only indicates higher ADP-ribosylation activity but also NAD+ resynthesis by consuming the released nicotinamide, as both are required for producing 13C10-ADPR while 13C5-ADPR can be produced via ADP-ribosylation only (cf. Scheme in Fig. S4D). This is consistent with the lack of buildup of nicotinamide (i, Fig. S4D) and excess buildup of 2H-NADH (d, Fig. 4B) in WGP-treated M2-Mϕ versus M2-Mϕ. ADP-ribosylation of proteins has been shown to mediate LPS-induced activation of human monocytes (43) while CD38 (NAD+ glycohydrolase) that also consumes NAD+ to generate cyclic ADPR and ADPR (83) is known to activate murine Mϕ in response to bacterial infection (84). On the other hand, NAD+ homeostasis is crucial to sustaining oxidative phosphorylation and immune resolution (42). Thus, the simultaneous activation of NAD+ homeostasis and ADP ribosylation by WGP implicates boosting of both M1- and M2-type functions.
Gln is a required N source for purine biosynthesis but it is not expected to be a significant carbon source unless it is transformed via GNG to produce Gly, Ser, and R5P. We saw sizable 13C and 15N incorporation into all nucleotide metabolites containing purine rings in UK096’s Mϕ (Fig. a’–f’, 4B; Fig. S4C; and data not shown), which indicates the glutaminolysis to GNG pathway as a key route for supporting purine nucleotide biosynthesis in human Mϕ. We also noted a lower 13C fractional enrichment of IMP (f) than that of inosine (h) and ADPR (i) in all Mϕ (Fig. S4C), which is unexpected from the usual precursor and product relationship. We have shown recently that such an atypical relationship signifies preferential diversion of labeled precursors for purine biosynthesis in human lung cancer tissue slice cultures (85) and activated mouse T cells (86). Thus, the present data implicate preferential routing of Gln-derived IMP to the production of inosine and NADH, which also points to the importance of the purine salvage pathway. Fig. 4B scheme also showed the more abundant isotopologues of ATP, i.e. 2H2 (D2)-ATP, 13C3 (●)-ATP, and 15N1/15N2 (◆), 2H2-ATP, which is consistent with their respective transformations from 2H2-Glc, 13C5-Gln, and 15N2-Trp via PPP, glutaminolysis-GNG-PPP, and Trp catabolic pathways. Moreover, levels of 13C-IMP, -ATP, -inosine, -NADH, and -ADPR did not show discernable responses to polarization or WGP treatments other than the buildup of 13C-IMP and depletion of 13C-ATP (b’) in WGP-treated versus untreated M2-Mϕ as well as the buildup of 13C-ADPR (e’) in the M1-Mϕ and WGP-treated M2-Mϕ versus M2-Mϕ after one-day of treatment (Fig. 4B). These changes in levels contrasted with only minor changes in the corresponding fractional enrichment (13C-IMP, f; 13C-ATP, g; and 13C-ADPR, i) and reduced fractional enrichment for 13C-inosine (h) by WGP (Fig. S4C). Together, they suggest blockade of IMP conversion to inosine and enhanced ATP utilization in the M2-Mϕ elicited by WGP as well as enhanced ADPR production or ADPR ribosylation activity in one-day polarized M1- Mϕ, which diminished thereafter.
Consistent treatment responses of Mϕ from the other three donors included 1) sizable 13C and 15N incorporation into all nucleotide metabolites containing purine rings (a-c/g-i/p-r, Fig. S4E); 2) lower 13C enrichment of IMP (a, g, p) than that of inosine (b, h, q) and ADPR (c, i, r) (Fig. S4E); 3) 2H2-, 13C3-, and 15N1/15N2, 2H2-isotopologues as top abundant products of ATP (cf. Fig. 4B); 4) excess buildup of 2H-IMP (d, j, s, Fig. S4E) with less changes in the fractional enrichment (data not shown) and higher 2H enrichment of ATP (e, l, u) and ADPR (f, m, v) in WGP-treated versus control M2-Mϕ (Fig. S4E). Also consistently observed for UK168 and UK166 but not for UK094 were enhanced buildup of 2H-inosine in WGP-treated M2-Mϕ (k, t) as well as that of 2H-R1P (k, t) and increases in fractional enrichment in the M1-Mϕ (o, x) (Fig. S4E). The rest of the responses varied qualitatively and/or quantitatively as a function of polarization durations.
Altogether, our data indicate that the salvage pathway and Trp catabolism contributes significantly to the synthesis of purine nucleotides/dinucleotides while implicating preferential diversion of GNG-mediated transformations of Gln-carbon into purine nucleotides, which occurs downstream of IMP. They also implicate activation of ADP ribosylation along with enhanced Trp catabolism and blockade of NAD+ resynthesis in M[LPS+IFNγ], leading to enhanced pro-inflammatory functions and mitochondrial dysfunctions. They further point to WGP’s ability to restore ADP ribosylation while boosting NAD+ resynthesis in M[IL4+IL13], thereby sustaining both immune activation and resolution.
Altered expression of relevant proteins modulates many aspects of metabolic reprogramming induced by differential polarization and WGP
The mSIRM data described above revealed multiple sites of altered metabolic regulation in response to differential polarization and WGP treatments. To quantify a large number of protein candidates with very limited Mϕ protein lysates, we employed Reverse Phase Protein Array (RPPA), instead of Western blotting. We saw enhanced expression of SLC2A1 or GLUT1 (a) and PKM2 (b) elicited by WGP in UK096’s M2-Mϕ (Fig. 5A), which correlated with the enhanced release of 2H-lactate into the medium or glycolytic activity (b, Fig. 2A). Lower levels of malate dehydrogenase 1 (MDH1, g, Fig. 5A) was related to the depletion of 2H-citrate or decrease in the initial Krebs cycle activity in the M1-Mϕ (f, Fig. 2B) while increased levels of fumarate hydratase (FH, f, Fig. 5A) correlated with the buildup of 2H-fumarate in WGP-treated M2-Mϕ (e, Fig. 2B). However, in contrast to the two Krebs cycle breaks in mouse M1-Mϕ, we saw no suppression of IDH2 and SDHB proteins in UK096’s M1-Mϕ versus M2-Mϕ (data not shown), which is consistent with the lack of buildup in 2H-αKG or -succinate (Fig. 2B). Overexpression of PC (k), PCK2 (l), and FBP1 (m) (Fig. 5A) agrees with the buildup of 13C-hexose phosphate products or heightened GNG activity evident in WGP-treated versus untreated M2-Mϕ (Fig. 3). Although glutamate dehydrogenase (GLUD1, n, Fig. 5A) but not glutamate-oxaloacetate transaminase 2 or GOT2 (data not shown) was induced by WGP in the M2-Mϕ, we saw no corresponding buildup of its product 13C-αKG and downstream 13C-metabolites (Fig. 2B). This could result from enhanced utilization of 13C-OAA required for the increase in 13C5-Gln-mediated GNG activity.
To better resolve the dynamic changes and regulation of glycogen metabolism in UK096 Mϕ, we analyzed the response of the key enzymes glycogen synthase (GYS1), glycogen phosphorylase (PYGB and PYGL), and glycogen synthase kinase 3β (GSK3B) (87). We saw enhanced expression of PYGB (o), PYGL (p) and GYS1 (q) induced by WGP in the M2-Mϕ (Fig. 5A). We also saw minor increase in GSK3β expression by WGP (r, Fig. 5A), which could contribute to negative regulation of GYS1 via phosphorylation. These data point to a complex balance between activated glycogen synthesis and degradation machineries that underlie the observed 13C labeling patterns of the glycogen pathway metabolites (Fig. S3). However, the lack of changes in PYGL, PYGB, and GYS1 expression in response to M1 versus M2 polarization (Fig. 5A) suggests that the increased glycogen buildup in the M1-Mϕ versus M2-Mϕ (Fig. S8A) did not result from expression changes of these proteins, rather from changes in their posttranslational modifications (PTMs) and/or allosteric control. Glycogen deposition (88) or metabolism (77) is known to regulate M1-type inflammatory responses and STAT1 expression was shown to mediate such responses in mouse Mϕ (77). We saw elevated levels of STAT1 in the M1-Mϕ versus M2-Mϕ (s, Fig. 5A), which is consistent with the reported role of glycogen in immune modulation.
We also observed enhanced levels of protein PARylation (PAR) or ADP-ribosylation in the M1-Mϕ and WGP-treated M2-Mϕ (t, Fig. 5A). This corroborates the changes in the labeling patterns of ADPR (Figs. 4B; S4C, E) and the 13C10 to 13C5 ratio of ADPR (Fig. S4D-h), which reflect increased ADP-ribosylation activity. Overexpression of indoleamine-2,3-dioxygenase 1 (IDO1, u) and suppression of quinolinate phosphoribosyl transferase (QPRT, v) were evident in the M1-Mϕ versus M2-Mϕ (Fig. 5A), which should underlie the excess buildup of Trp-derived QA in the M1-Mϕ (I’, Fig. 2A). Lower IDO1 overexpression but higher QPRT overexpression elicited by WGP in the M2-Mϕ versus M1-Mϕ can account for the lower buildup of QA while supporting enhanced NAD+ resynthesis in WGP-treated M2-Mϕ as reasoned above from the SIRM data (cf. Figs. 4B, S4D). Furthermore, we saw WGP-induced MAF (z) but not Dectin-1 (CLEC7A, y) expression in the M2-Mϕ (Fig. 5A), which is consistent with the activation of Dectin-1 by WGP binding to this C-type lectin receptor and subsequent activation of the Maf gene expression in bone marrow-derived mouse Mϕ (BMDMs) (7). However, these results are opposite to those of a more recent study, where MAF expression was suppressed by WGP in human M2-like Mϕ (89). Nevertheless, WGP-induced buildup of proinflammatory cytokines IL-1β or IL1B, IL-6, IFNγ, TNFα (UK096, Fig. 1D) and to a small extent NOS2 (x, Fig. 5A), is consistent with the responses of mouse BMDMs (7) and our human Mϕ to WGP treatment (89). Also notable was the WGP-enhanced release of anti-inflammatory cytokine IL-10 (Fig. 1D) but suppressed M2-Mϕ markers CD206 (MRC1 a’) and CD163 (b’) and elevated levels of the pro-inflammatory transcription factor RELA (90) (NFκB p65 subunit, c’) (Fig. 5A). Suppression of CD206 has been linked to the downregulation of sedoheptulose kinase (CARKL), which converts sedoheptulose to S7P to regulate M2 activation (91). Together, these protein responses of UK096’s Mϕ to WGP support the SIRM data on a dual role of WGP in boosting both inflammatory and anti-inflammatory functions. They also revealed consistency and plasticity from those previously reported for mouse and human Mϕ.
Last, we saw a minor increase in the levels of 6-phosphogluconate dehydrogenase (PGD j, Fig. 5A) under M1 stimuli, which cannot explain the opposite responses in 2H-6PG and 2H-R5P between the M1-Mϕ and WGP-treated M2-Mϕ (b-c, Fig. 3). We surmise that other R5P-producing reactions such as that catalyzed by CARKL contribute to these metabolic responses, i.e. downregulation of CARKL by WGP in the M2-Mϕ could lead to the lack of buildup in R5P. Also, it is possible that allosteric and/or PTM modulation of PGD underlie WGP-mediated buildup of 2H-6PG.
Similar to UK096 described above, altered expression of multiple enzymes may be key to reprogramming central metabolism in the other donors’ Mϕ elicited by differential polarization and WGP. These include 1) enhanced expression of SLC2A1 (a, q, f’, Fig. 5B) for increased uptake of glucose in WGP-treated M2-Mϕ (data not shown); 2) enhanced expression of PC, PCK2 (data not shown), and FBP1 (b, r, h’, Fig. 5B) for activated GNG (Fig. S2) in WGP-treated M2-Mϕ; 3) enhanced expression of GYS1 (c, s, i’) for increased glycogen synthesis and that of PYGB (d, t, j’) (Fig. 5B) for increased glycogen utilization in WGP-treated M2-Mϕ of UK168 and UK166; 4) enhanced expression of IDO1 (i, y, o’) with reduced expression of QPRT (z, p’) (Fig. 5B) for increased buildup of QA in the M1-Mϕ (Figs. 2A, S1A); and 5) enhanced expression of IDO1 and QPRT (j, z, p’) (Fig. 5B) for less QA buildup (Figs. 2A, S1A) and increased NADH synthesis (Fig. 4B) in WGP-treated M2-Mϕ. In addition, although PGD levels were unresponsive to WGP for UK096’s (j) and UK168’s M2-Mϕ (c’) (Fig. 5A), they were enhanced by WGP in UK94’s (m) and UK166’s M2-Mϕ (s’) (Fig. 5B), which could account for the relatively higher buildup of 2H-R5P in the latter (Fig. S2A-b, l) than the former cases (Figs. 3-c, S2A-g).
On the other hand, protein expression changes alone could not account for some of the time course changes of metabolic activity in the four donors’ Mϕ in response to polarization or WGP. Notably, we did not see corresponding changes in the expression of relevant enzymes CS (d), OGDH (e) (Fig. 5A), or IDH1/2 (data not shown) that could account for the sharp decline in 2H-citrate and -αKG levels from 1 to 3 day-polarized M1- and M2-Mϕ of UK096 (Fig. 2B). Likewise, the expression patterns of these enzymes (Fig. 5) could not fully explain the differential time course changes in the levels of labeled Krebs cycle metabolites in M2-Mϕ in response to WGP among the four donors (Figs. 2B, S1B and data not shown). These results point to the complexity and plasticity in the modulation of the Krebs cycle activity in human Mϕ by polarization or WGP. Further investigation is needed to resolve this complexity at the individual level.
Furthermore, we saw expression changes in immune regulators that were related to those of immune effectors in the four donors’ Mϕ. These include 1) enhanced expression of STAT1 (k, a’, q’) to the buildup of intracellular IL-1β (h, x, n’) (Fig. 5B) and/or increased release of IL-6 (Fig. 1D) in the M1-Mϕ; 2) enhanced expression of RELA (l, b’, r’, Fig. 5B) to increased production of proinflammatory cytokines IL-1β, IL-6, and TNFα (Fig. 1D) in the M1-Mϕ and/or WGP-treated M2-Mϕ (92); 3) enhanced expression of MRC1 (Figs. 1B, 5A-z and data not shown) to increased production of anti-inflammatory cytokine IL-10 (Fig. 1D) in the M2-Mϕ; and 4) correlation of enhanced MAF expression (Figs. 5A-z; p, f’, v’, 5B) to a boost in IL-10 release in the M2-Mϕ in response to the WGP treatment. These protein expression changes reiterate WGP’s role in boosting both pro- and anti-inflammatory functions of human Mϕ.
We have previously shown that WGP elicited M1-like IM metabolic responses from cancerous (CA) lung organotypic tissue cultures (OTC) of an NSCLC patient (UK021) but not from those of another patient (UK049) based on 13C6-Glc tracer studies (52). These metabolic distinctions correlated with reduced mitotic index and increased necrosis in UK021 versus no responses in UK049 CA OTC (52). As a part of this study, we also performed 13C5,15N2-Gln tracer experiments on UK021 lung OTC along with the analysis of cytokine release. As Fig. 6A shows, WGP enhanced the buildup of 13C5,15N1-Glu (C5N1, a, direct product of glutaminolysis) and its subsequent transformation products via the Krebs cycle (b, αKG; d, fumarate; e, malate; f, citrate; g, Asp; j, GSH) in CA but less so in non-cancerous (NC) OTC of UK021. We also noted the lack of changes in 13C5,15N2-Gln metabolism into succinate (c), itaconate (h) and 2HG (i). Many of these IM metabolic responses to WGP were akin to those of 1 to 2-day polarized M[IL4+IL13] of UK166 (Fig. S1). They were accompanied by enhanced release of pro-inflammatory cytokines (67, 93) IL-1β, MIP-1α, and TNFα relative to the control treatment (Fig. 7A). Moreover, these cytokine releases by CA lung OTC of UK021 were more pronounced than those of the UK049 counterparts, which displayed insignificant metabolic responses to WGP. These new data further supported our conclusions on WGP’s capacity in boosting both M1- and M2-type responses from CA lung tissues of UK021.
Figure 7. IM effector responses of ex vivo cancerous lung OTC of NSCLC patients to WGP treatment.

Media from the tracer experiments in Fig. 6 (n=1) and the tracer study of UK049 OTC (n=2) performed previously (52) were analyzed for cytokines as described in the Methods. The data were presented as the ratio of WGP to control values. Dashed lines denote a ratio of 1.
To examine further how individual NSCLC patient tissues respond to WGP, we performed SIRM studies on additional ex vivo lung OTC using 13C6-Glc or 13C5,15N2-Gln as tracer. Figure 6B illustrated the IM metabolic changes in 4 such examples. WGP enhanced the conversion of 13C5,15N2-Gln to 13C5,15N1-Glu (a) and 13C5,15N1-GSH (h) via glutaminolysis without significantly impacting 13C5,15N1-Glu transformations through the Krebs cycle (b-f) except for a minor buildup of 13C-αKG (b) in CA OTC of UL065 (● versus ●, Fig. 6B). These responses were akin to those of 1-day polarized counterparts of UK168 (Fig. S1B). For UK052’s CA OTC (Fig. 6C), we saw WGP-elicited depletion of 13C isotopologues of citrate (b), αKG (c), and 2HG (h) derived from 13C6-Glc, which could result from attenuated activity in the first half of the Krebs cycle. WGP also induced the buildup of glycogen (d) and oxidized glutathione (GSSG, k) in UK52’s CA OTC. Moreover, the matched NC counterparts of these patients showed largely no or opposite response to WGP treatment (● versus ●, Fig. 6A–C). Note that there were large variations in the replicate data for individual metabolites of UK52’s OTC such that WGP-induced changes hardly reach statistical significance (Fig. 6C). These variations are presumably due to intrinsic slice heterogeneity as we have encountered previously (94) and described below. However, consistent changes in citrate and αKG isotopologues collectively point to attenuated Krebs cycle activity. These changes were in part similar to those of WGP-treated 1-day polarized counterparts of UK096 (Figs. 2B, 4, S3A). In both cases, IM metabolic changes were accompanied by increased release of pro-inflammatory cytokines (IL-1β, MIP-1α, and TNFα for both and IL-6 for UL065) (Fig. 7B–C), as the case for UK021.
In the third example (UK062) with 13C5,15N2-Gln as tracer, we saw attenuated levels of unlabeled/13C-lactate as well as unlabeled, 13C- and/or 15N labeled Krebs cycle metabolites in WGP- versus control CA lung OTC (Fig. 6B-t, l to s), which is opposite to those observed for UK021 (Fig. 6A). Similar responses of the NC counterparts to WGP were also evident but not for Glu (k) and GSH (r). These metabolic responses to WGP were accompanied by increased release of IL-1β and TNFα (but not IL-6 or MIP-1α) relative to the control CA OTC (Fig. 7C) as well as reduced mitotic index (green PCNA fluorescence) (Fig. 6D). As tumor associated Mϕ (TAM) are not expected to proliferate, we attributed the PCNA response to originate from the cancer cells. Attenuated cancer cell proliferation would lead to decreased lactate production and compromised Krebs cycle activity in UK062’s CA OTC. Thus, in this example, we may have seen cancer cell responses to WGP that overwhelmed those of TAM, as we have reported previously for brain-metastasized lung CA OTC (94).
In the fourth example (UK020), we saw none or no pathway-wise changes of 13C6-glucose metabolism in lung CA OTC induced by WGP (Fig. 6B) that reflected those of the human Mϕ counterparts (Figs. 2, 4, S1, S4). This is similar to the case for UK49 reported previously (52). Likewise, there was no enhanced release of the proinflammatory cytokines in WGP-treated versus control CA OTC (Fig. 7B), which qualifies this patient’s lung CA OTC as non-responder.
As noted above, individual patient tissue OTC were heterogeneous in cellularity and necrotic status (RIP1 as an indicator) (cf. CA-Ctl1 versus 2, Fig. 6D). Consequently, each tissue OTC may vary in its basal functional and metabolic properties, leading to larger than typical variances in phenotypic and metabolic responses to treatments. On the other hand, such heterogeneity is intrinsic to the patient tumors and is likely to govern variable sensitivity to drug treatments.
Discussion
We have measured in depth IM metabolic networks in human Mϕ prepared from the PBMC of two each female (young and old) and male (young and old) human donors as a function of polarization method/duration and WGP treatment. The two older subjects (> 60 years old) were age-matched to lung cancer patients for comparison with IM metabolic responses to WGP in ex vivo lung cancer OTCs. A recent report has indicated distinct IM metabolism of human Mϕ between young and old subjects (42). It should be emphasized that our conclusion was drawn from consistent trends in the responses to immune modulations among 4 different donors, rather than from the statistical average of the responses averaged over the donors. Due to the very large variation in metabolic responses to immune modulations among the four donors (e.g. 2H- or 13C-itaconate in Fig. 2B versus Figs. S1B–S3B), meaningful statistical analysis could not be performed on this limited number of biological replicates. These large variations illustrate the plasticity of metabolic activity in human Mϕ in response to immune modulations.
Our mSIRM analyses show that although there were individual variations, consistent responses of the four donors to polarization and WGP treatment were observed. First, we noted preferred diversion of gluconeogenic products to ADPR production, as indicated by the higher 13C fractional enrichment in ADPR than in its precursor ATP (g versus i, Fig. S4C; data not shown). This diversion is likely to be mediated via the salvage synthesis of NAD+ (blue arrows, Fig. 4B) and could represent an important mechanism for sustaining NAD+ turnover and ADP ribosylation in human Mϕ. Other consistent events included attenuated Krebs cycle and pyrimidine/UDPGlcNAc turnover as well as enhanced itaconate production, oxidative PPP leading to R5P buildup, Trp catabolism (QA buildup), and ADP ribosylation in M[LPS+IFNγ] versus M[IL4+IL13] (Figs. 2–5, S1–4). These metabolic events were accompanied by increased level or release of proinflammatory effectors IL-1β, IL-6, IFNγ, and IP-10 enhanced expression of IDO1, and reduced phagocytosis (Fig. 1). Such linkages of IM metabolism to immune functions generally agree with the metabolic roles in modulating pro-inflammatory responses in M[LPS+IFNγ] (43, 95, 96) except that the role of R5P and QA in immune modulation is still unclear. There is some indication that ribulose-5-phosphate can elicit pro-inflammatory responses by disrupting the LKB1-AMPK complex (97), thereby blocking AMPK-mediated anti-inflammation (98). Although QA buildup has been reported in human M1-Mϕ (41), Trp catabolism to QA is thought to be anti-inflammatory (40). Such apparent contradiction awaits further investigations to resolve.
Although enhanced glycolysis and glutaminolysis upon LPS+IFNγ versus IL4+IL13 polarization were evident in proliferative M1-type mouse Mϕ derived from bone marrow (BM) (7, 95), these responses were plastic in our human Mϕ studies as indicated respectively by variable donor-dependent glucose uptake/2H-lactate release and 13C-Gln uptake/13C-Glu release/13C5-Glu/GSH synthesis (Figs. 2, S1). It is possible that such a distinction between human and mouse Mϕ metabolism is attributable to differences in proliferative capacity. This could also be said for the lack of the Krebs cycle breaks via suppression of IDH and SDH in human M[LPS+IFNγ], which is known to occur in M1 type mouse Mϕ (23). Instead, variable buildup of 2-HG (Fig. 2A, S1A) and suppressed expression of MDH’s (Fig. 5A and data not shown) could contribute to the flexible changes in the Krebs cycle activity and immunomodulation in our human M[LPS+IFNγ] versus M[IL4+IL13]. 2-HG has been shown to block SDH activity in cancer cells (99) and we recently showed that SDH blockade led to T cell activation (100).
WGP is known to elicit pro-inflammatory responses (including enhanced glycolysis and glutaminolysis) in mouse M2-type Mϕ (7, 48). In this study, we observed a subset of known M1-type responses of IM metabolism in WGP-treated human M[IL4+IL13], regardless of age or gender. These include time-dependent enhancement of glycolysis, glutaminolysis, Trp catabolism to QA (Figs. 2, S1), and protein PARylation (Fig. 5 and data not shown) as well as reduced turnover of Gln-fueled UDPGlcNAc (Figs. 4A, S4A–B). These metabolic events were accompanied by the enhanced release of proinflammatory cytokines IL-1β, IL-6, and TNFα (Fig. 1D). In particular, WGP-enhanced TNFα and IL-6 secretion could be induced by suppressed CD206 expression (Fig. 1B), as TNFα and IL-6 gene expression was shown to be downregulated by CD206 in mouse Mϕ (101). Suppressed CD206 expression in WGP-treated M[IL4+IL13] could in turn be caused by reduced N-linked glycosylation using UDPGlcNAc as substrate. CD206 suppression could also be mediated by CARKL downregulation, which was shown to deplete R5P and enhance TNFα/IL-6 release in LPS-activated mouse Mϕ (91). Thus, the depletion of R5P along with the buildup of 6PG in WGP-treated M[IL4+IL13] versus M[LPS+IFNγ] not only reflects enhanced oxidative PPP (M1-like) (102) but could also point to blocked CARKL (M2-like) (91). As such, our mSIRM characterization suggests mixed polarization of M[IL4+IL13] by WGP while revealing a potential link of WGP-induced CD206 suppression to altered PPP activity that warrant future studies.
We also saw other aspects of metabolism indicative of mixed polarization in WGP-treated M[IL4+IL13]. These include the lack of activated itaconate synthesis (Fig. 2B), maintenance of NAD(H) synthesis (Fig. 4B), and boosted synthesis of F1,6BP or F6P from Gln via GNG (Figs. 3, S2A). Of note is the close match of the time course change patterns of 13C-F1,6BP or -F6P with those of IL-1β (Fig. 1D) in WGP-treated M[IL4+IL13]. F1,6BP has been shown to enhance M2-type IL-10 production while attenuating M1-type cytokine production in inflamed mouse tissues (103). Thus, it is likely that WGP-activated gluconeogenic production of F1,6BP orchestrates the time-dependent diminishment of the increase in IL-1β release along with boosting of IL-10 release in M[IL4+IL13]. The dichotomy of WGP-elicited IM metabolic reprogramming could help maintain homeostasis of immune responses, which could in turn account for the lack of immune toxicity of WGP treatment in human subjects (48). Moreover, our data demonstrated the plasticity in the IM responses of human donors’ M[IL4+IL13] to WGP, notably variations in the activation of glucose/Gln uptake, lactate release to the media, and the buildup of 2HG, fumarate, QA, G6P, F1,6BP, G1P/UDPG/G1,6BP, IMP/inosine/R1P (Figs. 2–4, S1–4). These variations respectively reflect flexible responses of glycolysis, the Krebs cycle, GNG, glycogen turnover, and nucleotide salvage pathway to WGP treatment. Based on the literature including our own findings on BM-derived mouse Mϕ (7), they could translate into variable immune functions and therapeutic efficacy.
Our mSIRM approach provided simultaneous and robust in situ assays for the activities of many established plus some unexpected IM metabolic pathways using very limited human specimens. The level of detail and complexity in IM metabolism resolvable by this approach cannot be achieved with conventional metabolite profiling or even single tracer approaches. The pathway information thus acquired revealed many key enzyme/transporter candidates involved in modulating the IM metabolic changes, which can then be verified by protein expression analysis. High throughput quantification of these many proteins with very limited cell or tissue lysates was made possible by adopting RPPA. Here, we showed that the combination of mSIRM and RPPA not only verified metabolic regulation at the protein expression level but also implicated that at the transcriptional level. For example, glycolytic activation by WGP in UK096’s M[IL4+IL13] (Fig. 2A) could be mediated by PKM2 overexpression (Fig. 5), which can promote HIF-1α activity and transcriptional control of glycolytic enzyme/IL-1β expression (47). Also, F1,6BP buildup in WGP-treated M[IL4+IL13] can enhance tetramerization of PKM2 (104), thereby boosting IL-10 production via enhancing gene transcription (47). Furthermore, UDPGlcNAc metabolism activated by WGP can be linked to MAF overexpression in M[IL4+IL13] (Fig. 5), which was shown to modulate M2-type responses in mouse Mϕ including IL-10 gene expression (89, 105). However, in a previous report (89), MAF was suppressed by WGP in M2-like Mϕ differentiated and polarized using FACS-sorted CD14+ human monocytes. This apparent contradiction is puzzling but one possible cause could be the different methods of monocyte isolation, i.e. FACS sorting by Liu et al. (89) versus the use of RosetteSep™ kit in this report. If so, WGP’s effect on IM metabolism and regulation in human Mϕ depends heavily on specific monocyte populations. Further investigations are required to clarify this point and to verify WGP-induced changes in metabolic regulation surmised from mSIRM analysis.
WGP-induced metabolic responses (activated glycolysis (52) and glutaminolysis but not itaconate production) in UK021’s CA lung OTC (Fig. 6A) reflects those of M1- and M2-type Mϕ (Fig. S1). The attendant M1-type increase in the release of pro-inflammatory cytokines (Fig. 7A) correlates with the increase in tissue necrosis reported previously (52), presumably due at least in part to the tumoricidal action of repolarized TAM. This is corroborated by the link of relatively less pro-inflammatory cytokine release (Fig. 7A) to insignificant M1-type metabolic response in WGP-treated UK49’s CA lung OTC observed previously (52). Such linkage of WGP-induced IM metabolic responses to pro-inflammatory cytokine release is also evident in other CA lung OTC including the responder OTC of UL065 and UK052 (Fig. 6B–C) versus the non-responder OTC of UK020 (Fig. 6B–7B). An exception is the divergence of IM metabolic responses (Fig. 6B) from the response of cytokine release (Fig. 7C) in WGP-treated lung CA OTC of UK062, which could be explained by the massive loss of proliferative cancer cells (Fig. 6D). The resulting attenuation of cancer cell metabolism would mask WGP-induced changes in TAM metabolism but not cytokine release (94). Thus, as the case for isolated human Mϕ, WGP elicited mixed type IM metabolic responses and immune effector release in patient-derived CA OTC, which could be attributed to the response of the TAMs. As this response varied among different CA OTC, we surmise that such variability could lead to variable immunotherapeutic efficacy of WGP in human cancer patients. Future studies on linking WGP-induced IM responses of patient-derived OTC to those of the corresponding patients will substantiate this hypothesis.
In conclusion, we presented comprehensive changes of IM metabolic networks in four human donors’ Mϕ in response to differential polarization and WGP treatments. We found both consistency and divergence in the network responses compared with those of the mouse counterparts. Of note is the consistent activation of glycolysis, glutaminolysis, Trp catabolism to QA and protein PARylation as well as reduced turnover of UDPGlcNAc by WGP in M[IL4+M13], which was related to increased releases of immune effectors. We also saw maintenance or reinforced M2-type IM metabolism by WGP such as increased synthesis of F1,6BP via gluconeogenesis and enhanced production of anti-inflammatory cytokine IL-10, which could be related to WGP’s low immune toxicity in human. We further found that as the case for human Mϕ in vitro, reprogrammed IM metabolic activities occurred variably in WGP-treated NSCLC OTC ex vivo, which were correlated with proinflammatory cytokine releases as well as compromised tumor status. Thus, the ex vivo OTC systems could serve as unique models for studying the immune microenvironment of individual patients and its response to immunotherapeutics, which can help predict treatment efficacy in cancer patients.
Supplementary Material
Key Points:
Enhanced tryptophan catabolism with blocked NAD+ and UTP synthesis was seen in M1-Mϕ
WGP increased glucose utilization, UDPGlcNAc turnover and gluconeogenesis in M2a-Mϕ
WGP variably impacted Krebs cycle and UTP synthesis in human NSCLC OTC.
Acknowledgments
We thank Huan Song for assistance with immunostaining of tissue slices and Dr. M. Bousamra for supplying the tissue and Dr. Y. Cai for assisting the experiment with patient UL065.
Funding
This work was supported by NIH grants P01CA163223-01A1, 1U24DK097215-01A1, 1R01CA118434-01A2, 5R21ES025669-02, 5R01ES22191, 5P20GM121327, Shared Resource(s) of the University of Kentucky Markey Cancer Center P30CA177558, and endowment funds to TWMF and ANL.
Footnotes
Ethics
Surgical patients were consented for freshly resected tissue specimens under the approved IRB protocol (14–0288-F6A; 13-LUN-94-MCC) of the University of Kentucky (UKy).
Competing Interests. The authors declare no competing interests.
References
- 1.Gordon S, and Martinez FO. 2010. Alternative activation of macrophages: mechanism and functions. Immunity 32: 593–604. [DOI] [PubMed] [Google Scholar]
- 2.Zhu Y, Herndon JM, Sojka DK, Kim KW, Knolhoff BL, Zuo C, Cullinan DR, Luo J, Bearden AR, Lavine KJ, Yokoyama WM, Hawkins WG, Fields RC, Randolph GJ, and DeNardo DG. 2017. Tissue-Resident Macrophages in Pancreatic Ductal Adenocarcinoma Originate from Embryonic Hematopoiesis and Promote Tumor Progression. Immunity 47: 323–338.e6. [DOI] [PMC free article] [PubMed] [Google Scholar]
- 3.Henze AT, and Mazzone M. 2016. The impact of hypoxia on tumor-associated macrophages. J Clin Invest 126: 3672–3679. [DOI] [PMC free article] [PubMed] [Google Scholar]
- 4.Kuang DM, Zhao Q, Peng C, Xu J, Zhang JP, Wu C, and Zheng L. 2009. Activated monocytes in peritumoral stroma of hepatocellular carcinoma foster immune privilege and disease progression through PD-L1. J Exp Med 206: 1327–1337. [DOI] [PMC free article] [PubMed] [Google Scholar]
- 5.Ganeshan K, and Chawla A. 2014. Metabolic regulation of immune responses. Annu Rev Immunol 32: 609–634. [DOI] [PMC free article] [PubMed] [Google Scholar]
- 6.Qian BZ, and Pollard JW. 2010. Macrophage diversity enhances tumor progression and metastasis. Cell 141: 39–51. [DOI] [PMC free article] [PubMed] [Google Scholar]
- 7.Liu M, Luo F, Ding C, Albeituni S, Hu X, Ma Y, Cai Y, McNally L, Sanders MA, Jain D, Kloecker G, Bousamra M 2nd, Zhang HG, Higashi RM, Lane AN, Fan TW, and Yan J. 2015. Dectin-1 Activation by a Natural Product beta-Glucan Converts Immunosuppressive Macrophages into an M1-like Phenotype. J Immunol 195: 5055–5065. [DOI] [PMC free article] [PubMed] [Google Scholar]
- 8.Doedens AL, Stockmann C, Rubinstein MP, Liao D, Zhang N, DeNardo DG, Coussens LM, Karin M, Goldrath AW, and Johnson RS. 2010. Macrophage expression of hypoxia-inducible factor-1 alpha suppresses T-cell function and promotes tumor progression. Cancer Res 70: 7465–7475. [DOI] [PMC free article] [PubMed] [Google Scholar]
- 9.Noman MZ, Desantis G, Janji B, Hasmim M, Karray S, Dessen P, Bronte V, and Chouaib S. 2014. PD-L1 is a novel direct target of HIF-1alpha, and its blockade under hypoxia enhanced MDSC-mediated T cell activation. J Exp Med 211: 781–790. [DOI] [PMC free article] [PubMed] [Google Scholar]
- 10.Chen C, Qu QX, Shen Y, Mu CY, Zhu YB, Zhang XG, and Huang JA. 2012. Induced expression of B7-H4 on the surface of lung cancer cell by the tumor-associated macrophages: a potential mechanism of immune escape. Cancer Lett 317: 99–105. [DOI] [PubMed] [Google Scholar]
- 11.Palazon A, Goldrath AW, Nizet V, and Johnson RS. 2014. HIF transcription factors, inflammation, and immunity. Immunity 41: 518–528. [DOI] [PMC free article] [PubMed] [Google Scholar]
- 12.Peranzoni E, Lemoine J, Vimeux L, Feuillet V, Barrin S, Kantari-Mimoun C, Bercovici N, Guerin M, Biton J, Ouakrim H, Regnier F, Lupo A, Alifano M, Damotte D, and Donnadieu E. 2018. Macrophages impede CD8 T cells from reaching tumor cells and limit the efficacy of anti-PD-1 treatment. Proc Natl Acad Sci U S A 115: E4041–E4050. [DOI] [PMC free article] [PubMed] [Google Scholar]
- 13.Rubic T, Lametschwandtner G, Jost S, Hinteregger S, Kund J, Carballido-Perrig N, Schwarzler C, Junt T, Voshol H, Meingassner JG, Mao X, Werner G, Rot A, and Carballido JM. 2008. Triggering the succinate receptor GPR91 on dendritic cells enhances immunity. Nature immunology 9: 1261–1269. [DOI] [PubMed] [Google Scholar]
- 14.Diskin C, and Palsson-McDermott EM. 2018. Metabolic Modulation in Macrophage Effector Function. Front Immunol 9: 270. [DOI] [PMC free article] [PubMed] [Google Scholar]
- 15.Littlewood-Evans A, Sarret S, Apfel V, Loesle P, Dawson J, Zhang J, Muller A, Tigani B, Kneuer R, Patel S, Valeaux S, Gommermann N, Rubic-Schneider T, Junt T, and Carballido JM. 2016. GPR91 senses extracellular succinate released from inflammatory macrophages and exacerbates rheumatoid arthritis. J Exp Med 213: 1655–1662. [DOI] [PMC free article] [PubMed] [Google Scholar]
- 16.Ghesquiere B, Wong BW, Kuchnio A, and Carmeliet P. 2014. Metabolism of stromal and immune cells in health and disease. Nature 511: 167–176. [DOI] [PubMed] [Google Scholar]
- 17.Chang CH, Qiu J, O’Sullivan D, Buck MD, Noguchi T, Curtis JD, Chen Q, Gindin M, Gubin MM, van der Windt GJ, Tonc E, Schreiber RD, Pearce EJ, and Pearce EL. 2015. Metabolic Competition in the Tumor Microenvironment Is a Driver of Cancer Progression. Cell 162: 1229–1241. [DOI] [PMC free article] [PubMed] [Google Scholar]
- 18.Lim S, Phillips JB, Madeira da Silva L, Zhou M, Fodstad O, Owen LB, and Tan M. 2017. Interplay between Immune Checkpoint Proteins and Cellular Metabolism. Cancer Research 77: 1245–1249. [DOI] [PMC free article] [PubMed] [Google Scholar]
- 19.Fischer K, Hoffmann P, Voelkl S, Meidenbauer N, Ammer J, Edinger M, Gottfried E, Schwarz S, Rothe G, Hoves S, Renner K, Timischl B, Mackensen A, Kunz-Schughart L, Andreesen R, Krause SW, and Kreutz M. 2007. Inhibitory effect of tumor cell-derived lactic acid on human T cells. Blood 109: 3812–3819. [DOI] [PubMed] [Google Scholar]
- 20.Sica A, and Bronte V. 2007. Altered macrophage differentiation and immune dysfunction in tumor development. The Journal of Clinical Investigation 117: 1155–1166. [DOI] [PMC free article] [PubMed] [Google Scholar]
- 21.Murray PJ, Allen JE, Biswas SK, Fisher EA, Gilroy DW, Goerdt S, Gordon S, Hamilton JA, Ivashkiv LB, Lawrence T, Locati M, Mantovani A, Martinez FO, Mege JL, Mosser DM, Natoli G, Saeij JP, Schultze JL, Shirey KA, Sica A, Suttles J, Udalova I, van Ginderachter JA, Vogel SN, and Wynn TA. 2014. Macrophage activation and polarization: nomenclature and experimental guidelines. Immunity 41: 14–20. [DOI] [PMC free article] [PubMed] [Google Scholar]
- 22.El Kasmi KC, and Stenmark KR. 2015. Contribution of metabolic reprogramming to macrophage plasticity and function. Semin Immunol 27: 267–275. [DOI] [PMC free article] [PubMed] [Google Scholar]
- 23.Jha AK, Huang SC, Sergushichev A, Lampropoulou V, Ivanova Y, Loginicheva E, Chmielewski K, Stewart KM, Ashall J, Everts B, Pearce EJ, Driggers EM, and Artyomov MN. 2015. Network Integration of Parallel Metabolic and Transcriptional Data Reveals Metabolic Modules that Regulate Macrophage Polarization. Immunity 42: 419–430. [DOI] [PubMed] [Google Scholar]
- 24.O’Neill LA 2015. A broken krebs cycle in macrophages. Immunity 42: 393–394. [DOI] [PubMed] [Google Scholar]
- 25.Liu L, Lu Y, Martinez J, Bi Y, Lian G, Wang T, Milasta S, Wang J, Yang M, Liu G, Green DR, and Wang R. 2016. Proinflammatory signal suppresses proliferation and shifts macrophage metabolism from Myc-dependent to HIF1alpha-dependent. Proc Natl Acad Sci U S A 113: 1564–1569. [DOI] [PMC free article] [PubMed] [Google Scholar]
- 26.Wang T, Liu H, Lian G, Zhang S-Y, Wang X, and Jiang C. 2017. HIF1α-Induced Glycolysis Metabolism Is Essential to the Activation of Inflammatory Macrophages. Mediators of Inflammation 2017: Article ID 9029327. [DOI] [PMC free article] [PubMed] [Google Scholar]
- 27.Kelly B, and O’Neill LA. 2015. Metabolic reprogramming in macrophages and dendritic cells in innate immunity. Cell Res 25: 771–784. [DOI] [PMC free article] [PubMed] [Google Scholar]
- 28.Murphy C, and Newsholme P. 1998. Importance of glutamine metabolism in murine macrophages and human monocytes to L-arginine biosynthesis and rates of nitrite or urea production. Clinical science 95: 397–407. [PubMed] [Google Scholar]
- 29.Li L, Zhu L, Hao B, Gao W, Wang Q, Li K, Wang M, Huang M, Liu Z, Yang Q, Li X, Zhong Z, Huang W, Xiao G, Xu Y, Yao K, and Liu Q. 2017. iNOS-derived nitric oxide promotes glycolysis by inducing pyruvate kinase M2 nuclear translocation in ovarian cancer. Oncotarget 8: 33047–33063. [DOI] [PMC free article] [PubMed] [Google Scholar]
- 30.Douguet L, Cherfils-Vicini J, Bod L, Lengagne R, Gilson E, and Prevost-Blondel A. 2016. Nitric Oxide Synthase 2 Improves Proliferation and Glycolysis of Peripheral gammadelta T Cells. PLoS One 11: e0165639. [DOI] [PMC free article] [PubMed] [Google Scholar]
- 31.Everts B, Amiel E, van der Windt GJ, Freitas TC, Chott R, Yarasheski KE, Pearce EL, and Pearce EJ. 2012. Commitment to glycolysis sustains survival of NO-producing inflammatory dendritic cells. Blood 120: 1422–1431. [DOI] [PMC free article] [PubMed] [Google Scholar]
- 32.Michelucci A, Cordes T, Ghelfi J, Pailot A, Reiling N, Goldmann O, Binz T, Wegner A, Tallam A, Rausell A, Buttini M, Linster CL, Medina E, Balling R, and Hiller K. 2013. Immune-responsive gene 1 protein links metabolism to immunity by catalyzing itaconic acid production. Proc Natl Acad Sci U S A 110: 7820–7825. [DOI] [PMC free article] [PubMed] [Google Scholar]
- 33.Lampropoulou V, Sergushichev A, Bambouskova M, Nair S, Vincent EE, Loginicheva E, Cervantes-Barragan L, Ma X, Huang SC, Griss T, Weinheimer CJ, Khader S, Randolph GJ, Pearce EJ, Jones RG, Diwan A, Diamond MS, and Artyomov MN. 2016. Itaconate Links Inhibition of Succinate Dehydrogenase with Macrophage Metabolic Remodeling and Regulation of Inflammation. Cell Metab 24: 158–166. [DOI] [PMC free article] [PubMed] [Google Scholar]
- 34.Mills EL, Ryan DG, Prag HA, Dikovskaya D, Menon D, Zaslona Z, Jedrychowski MP, Costa ASH, Higgins M, Hams E, Szpyt J, Runtsch MC, King MS, McGouran JF, Fischer R, Kessler BM, McGettrick AF, Hughes MM, Carroll RG, Booty LM, Knatko EV, Meakin PJ, Ashford MLJ, Modis LK, Brunori G, Sévin DC, Fallon PG, Caldwell ST, Kunji ERS, Chouchani ET, Frezza C, Dinkova-Kostova AT, Hartley RC, Murphy MP, and O’Neill LA. 2018. Itaconate is an anti-inflammatory metabolite that activates Nrf2 via alkylation of KEAP1. Nature 556: 113. [DOI] [PMC free article] [PubMed] [Google Scholar]
- 35.Tannahill GM, Curtis AM, Adamik J, Palsson-McDermott EM, McGettrick AF, Goel G, Frezza C, Bernard NJ, Kelly B, Foley NH, Zheng L, Gardet A, Tong Z, Jany SS, Corr SC, Haneklaus M, Caffrey BE, Pierce K, Walmsley S, Beasley FC, Cummins E, Nizet V, Whyte M, Taylor CT, Lin H, Masters SL, Gottlieb E, Kelly VP, Clish C, Auron PE, Xavier RJ, and O’Neill LA. 2013. Succinate is an inflammatory signal that induces IL-1beta through HIF-1alpha. Nature 496: 238–242. [DOI] [PMC free article] [PubMed] [Google Scholar]
- 36.Drose S 2013. Differential effects of complex II on mitochondrial ROS production and their relation to cardioprotective pre- and postconditioning. Biochim Biophys Acta 1827: 578–587. [DOI] [PubMed] [Google Scholar]
- 37.Saleh LS, Vanderheyden C, Frederickson A, and Bryant SJ. 2020. Prostaglandin E2 and Its Receptor EP2 Modulate Macrophage Activation and Fusion in Vitro. ACS Biomaterials Science & Engineering 6: 2668–2681. [DOI] [PubMed] [Google Scholar]
- 38.Infantino V, Iacobazzi V, Palmieri F, and Menga A. 2013. ATP-citrate lyase is essential for macrophage inflammatory response. Biochem Biophys Res Commun 440: 105–111. [DOI] [PubMed] [Google Scholar]
- 39.Infantino V, Convertini P, Cucci L, Panaro MA, Di Noia MA, Calvello R, Palmieri F, and Iacobazzi V. 2011. The mitochondrial citrate carrier: a new player in inflammation. Biochem J 438: 433–436. [DOI] [PubMed] [Google Scholar]
- 40.Moffett JR, and Namboodiri MA. 2003. Tryptophan and the immune response. Immunol Cell Biol 81: 247–265. [DOI] [PubMed] [Google Scholar]
- 41.Fuchs AL, Schiller SM, Keegan WJ, Ammons MCB, Eilers B, Tripet B, and Copie V. 2019. Quantitative (1)H NMR Metabolomics Reveal Distinct Metabolic Adaptations in Human Macrophages Following Differential Activation. Metabolites 9: 248. [DOI] [PMC free article] [PubMed] [Google Scholar]
- 42.Minhas PS, Liu L, Moon PK, Joshi AU, Dove C, Mhatre S, Contrepois K, Wang Q, Lee BA, Coronado M, Bernstein D, Snyder MP, Migaud M, Majeti R, Mochly-Rosen D, Rabinowitz JD, and Andreasson KI. 2019. Macrophage de novo NAD(+) synthesis specifies immune function in aging and inflammation. Nature immunology 20: 50–63. [DOI] [PMC free article] [PubMed] [Google Scholar]
- 43.Hauschildt S, Scheipers P, Bessler W, Schwarz K, Ullmer A, Flad HD, and Heine H. 1997. Role of ADP-ribosylation in activated monocytes/macrophages. Adv Exp Med Biol 419: 249–252. [DOI] [PubMed] [Google Scholar]
- 44.Ruffmann R, Schlick R, Chirigos MA, Budzynsky W, and Varesio L. 1987. Antiproliferative activity of picolinic acid due to macrophage activation. Drugs Exp Clin Res 13: 607–614. [PubMed] [Google Scholar]
- 45.Melillo G, Cox GW, Biragyn A, Sheffler LA, and Varesio L. 1994. Regulation of nitric-oxide synthase mRNA expression by interferon-gamma and picolinic acid. Journal of Biological Chemistry 269: 8128–8133. [PubMed] [Google Scholar]
- 46.Bosco MC, Rapisarda A, Massazza S, Melillo G, Young H, and Varesio L. 2000. The tryptophan catabolite picolinic acid selectively induces the chemokines macrophage inflammatory protein-1 alpha and −1 beta in macrophages. J Immunol 164: 3283–3291. [DOI] [PubMed] [Google Scholar]
- 47.Palsson-McDermott EM, Curtis AM, Goel G, Lauterbach MA, Sheedy FJ, Gleeson LE, van den Bosch MW, Quinn SR, Domingo-Fernandez R, Johnston DG, Jiang JK, Israelsen WJ, Keane J, Thomas C, Clish C, Vander Heiden M, Xavier RJ, and O’Neill LA. 2015. Pyruvate kinase M2 regulates Hif-1alpha activity and IL-1beta induction and is a critical determinant of the warburg effect in LPS-activated macrophages. Cell Metab 21: 65–80. [DOI] [PMC free article] [PubMed] [Google Scholar]
- 48.de Graaff P, Govers C, Wichers HJ, and Debets R. 2018. Consumption of beta-glucans to spice up T cell treatment of tumors: a review. Expert Opin Biol Ther 18: 1023–1040. [DOI] [PubMed] [Google Scholar]
- 49.Tian J, Ma J, Ma K, Guo H, Baidoo SE, Zhang Y, Yan J, Lu L, Xu H, and Wang S. 2013. beta-Glucan enhances antitumor immune responses by regulating differentiation and function of monocytic myeloid-derived suppressor cells. Eur J Immunol 43: 1220–1230. [DOI] [PubMed] [Google Scholar]
- 50.Arts RJ, Novakovic B, Ter Horst R, Carvalho A, Bekkering S, Lachmandas E, Rodrigues F, Silvestre R, Cheng SC, Wang SY, Habibi E, Goncalves LG, Mesquita I, Cunha C, van Laarhoven A, van de Veerdonk FL, Williams DL, van der Meer JW, Logie C, O’Neill LA, Dinarello CA, Riksen NP, van Crevel R, Clish C, Notebaart RA, Joosten LA, Stunnenberg HG, Xavier RJ, and Netea MG. 2016. Glutaminolysis and Fumarate Accumulation Integrate Immunometabolic and Epigenetic Programs in Trained Immunity. Cell Metab 24: 807–819. [DOI] [PMC free article] [PubMed] [Google Scholar]
- 51.Domínguez-Andrés J, Novakovic B, Li Y, Scicluna BP, Gresnigt MS, Arts RJW, Oosting M, Moorlag SJCFM, Groh LA, Zwaag J, Koch RM, ter Horst R, Joosten LAB, Wijmenga C, Michelucci A, van der Poll T, Kox M, Pickkers P, Kumar V, Stunnenberg H, and Netea MG. 2019. The Itaconate Pathway Is a Central Regulatory Node Linking Innate Immune Tolerance and Trained Immunity. Cell Metabolism 29: 211–220.e215. [DOI] [PubMed] [Google Scholar]
- 52.Fan TW, Warmoes MO, Sun Q, Song H, Turchan-Cholewo J, Martin JT, Mahan A, Higashi RM, and Lane AN. 2016. Distinctly perturbed metabolic networks underlie differential tumor tissue damages induced by immune modulator beta-glucan in a two-case ex vivo non-small-cell lung cancer study. Cold Spring Harb Mol Case Stud 2: a000893. [DOI] [PMC free article] [PubMed] [Google Scholar]
- 53.Parra ER, Uraoka N, Jiang M, Cook P, Gibbons D, Forget MA, Bernatchez C, Haymaker C, Wistuba II, and Rodriguez-Canales J. 2017. Validation of multiplex immunofluorescence panels using multispectral microscopy for immune-profiling of formalin-fixed and paraffin-embedded human tumor tissues. Scientific reports 7: 13380. [DOI] [PMC free article] [PubMed] [Google Scholar]
- 54.McQuin C, Goodman A, Chernyshev V, Kamentsky L, Cimini BA, Karhohs KW, Doan M, Ding L, Rafelski SM, Thirstrup D, Wiegraebe W, Singh S, Becker T, Caicedo JC, and Carpenter AE. 2018. CellProfiler 3.0: Next-generation image processing for biology. PLoS Biol 16: e2005970. [DOI] [PMC free article] [PubMed] [Google Scholar]
- 55.Crooks DR, Fan TW, and Linehan WM. 2019. Metabolic Labeling of Cultured Mammalian Cells for Stable Isotope-Resolved Metabolomics: Practical Aspects of Tissue Culture and Sample Extraction. Methods in molecular biology (Clifton, N.J.) 1928: 1–27. [DOI] [PMC free article] [PubMed] [Google Scholar]
- 56.Fan TW-M, Lane AN, and Higashi RM. 2016. Stable Isotope Resolved Metabolomics Studies in ex vivo Tissue Slices. Bio-protocol 6: e1730. [DOI] [PMC free article] [PubMed] [Google Scholar]
- 57.Fan TW-M, Lorkiewicz P, Sellers K, Moseley HNB, Higashi RM, and Lane AN. 2012. Stable isotope-resolved metabolomics and applications to drug development. Pharmacology and Therapeutics 133: 366–391 [DOI] [PMC free article] [PubMed] [Google Scholar]
- 58.Fan TW-M 2012. Sample Preparation for Metabolomics Investigation. In The Handbook of Metabolomics: Pathway and Flux Analysis, Methods in Pharmacology and Toxicology. DOI 10.1007/978-1-61779-618-0_11. Fan TW-M, Lane AN, and Higashi RM, eds. Springer Science, New York. 7–27. [DOI] [Google Scholar]
- 59.Matyash V, Liebisch G, Kurzchalia TV, Shevchenko A, and Schwudke D. 2008. Lipid extraction by methyl-tert-butyl ether for high-throughput lipidomics. Journal of lipid research 49: 1137–1146. [DOI] [PMC free article] [PubMed] [Google Scholar]
- 60.Fan T, El-Amouri S, Macedo J, Wang Q, Song H, Cassel T, and Lane A. 2018. Stable Isotope-Resolved Metabolomics Shows Metabolic Resistance to Anti-Cancer Selenite in 3D Spheroids versus 2D Cell Cultures. Metabolites 8: 40. [DOI] [PMC free article] [PubMed] [Google Scholar]
- 61.Yang Y, Fan TWM, Lane AN, and Higashi RM. 2017. Chloroformate Derivatization for Tracing the Fate of Amino Acids in Cells and Tissues by Multiple Stable Isotope Resolved Metabolomics (mSIRM). Analytica chimica acta 976: 63–73. [DOI] [PMC free article] [PubMed] [Google Scholar]
- 62.Moseley HN 2010. Correcting for the effects of natural abundance in stable isotope resolved metabolomics experiments involving ultra-high resolution mass spectrometry. BMC Bioinformatics 11: 139. [DOI] [PMC free article] [PubMed] [Google Scholar]
- 63.Fan TW-M, and Lane AN. 2011. Assignment strategies for NMR resonances in metabolomics research. In Methodologies for Metabolomics: Experimental Strategies and Techniques. Lutz Norbert, Sweedler Jonathan V., and Weavers RA, eds. Cambridge University Press. pp 525–84 [Google Scholar]
- 64.Fan TW, and Lane AN. 2008. Structure-based profiling of Metabolites and Isotopomers by NMR. Progress in NMR Spectroscopy 52: 69–117 [Google Scholar]
- 65.Fan TW-M 1996. Metabolite profiling by one- and two-dimensional NMR analysis of complex mixtures. Progress in Nuclear Magnetic Resonance Spectroscopy 28: 161–219. [Google Scholar]
- 66.Fan TW-M, Bruntz RC, Yang Y, Song H, Chernyavskaya Y, Deng P, Zhang Y, Shah PP Beverly LJ, Chi Z, Mahan AL, Higashi RM, Dang CV, Lane AN . in press, 2019. De novo synthesis of serine and glycine fuels purine nucleotide biosynthesis in human lung cancer tissues. J. Biol. Chem 294: 13464–13477 [DOI] [PMC free article] [PubMed] [Google Scholar]
- 67.Jaguin M, Houlbert N, Fardel O, and Lecureur V. 2013. Polarization profiles of human M-CSF-generated macrophages and comparison of M1-markers in classically activated macrophages from GM-CSF and M-CSF origin. Cellular immunology 281: 51–61. [DOI] [PubMed] [Google Scholar]
- 68.Mao Y, and Finnemann SC. 2015. Regulation of phagocytosis by Rho GTPases. Small GTPases 6: 89–99. [DOI] [PMC free article] [PubMed] [Google Scholar]
- 69.Staples KJ, Smallie T, Williams LM, Foey A, Burke B, Foxwell BM, and Ziegler-Heitbrock L. 2007. IL-10 induces IL-10 in primary human monocyte-derived macrophages via the transcription factor Stat3. J Immunol 178: 4779–4785. [DOI] [PubMed] [Google Scholar]
- 70.Wennerberg E, Kremer V, Childs R, and Lundqvist A. 2015. CXCL10-induced migration of adoptively transferred human natural killer cells toward solid tumors causes regression of tumor growth in vivo. Cancer Immunol Immunother 64: 225–235. [DOI] [PMC free article] [PubMed] [Google Scholar]
- 71.Wightman SC, Uppal A, Pitroda SP, Ganai S, Burnette B, Stack M, Oshima G, Khan S, Huang X, Posner MC, Weichselbaum RR, and Khodarev NN. 2015. Oncogenic CXCL10 signalling drives metastasis development and poor clinical outcome. British Journal of Cancer 113: 327–335. [DOI] [PMC free article] [PubMed] [Google Scholar]
- 72.Duruisseaux M, Rabbe N, Antoine M, Vieira T, Poulot V, Cadranel J, and Wislez M. 2017. Pro-tumoural CXCL10/CXCR3-A autocrine loop in invasive mucinous lung adenocarcinoma. ERJ Open Res 3: 00047–02016. [DOI] [PMC free article] [PubMed] [Google Scholar]
- 73.Ouyang W, Rutz S, Crellin NK, Valdez PA, and Hymowitz SG. 2011. Regulation and functions of the IL-10 family of cytokines in inflammation and disease. Annu Rev Immunol 29: 71–109. [DOI] [PubMed] [Google Scholar]
- 74.Yang M, Su H, Soga T, Kranc KR, and Pollard PJ. 2014. Prolyl hydroxylase domain enzymes: important regulators of cancer metabolism. Hypoxia (Auckl) 2: 127–142. [DOI] [PMC free article] [PubMed] [Google Scholar]
- 75.Reales-Calderon JA, Aguilera-Montilla N, Corbi AL, Molero G, and Gil C. 2014. Proteomic characterization of human proinflammatory M1 and anti-inflammatory M2 macrophages and their response to Candida albicans. Proteomics 14: 1503–1518. [DOI] [PubMed] [Google Scholar]
- 76.Sun Y, Bandi M, Lofton T, Smith M, Bristow CA, Carugo A, Rogers N, Leonard P, Chang Q, Mullinax R, Han J, Shi X, Seth S, Meyers BA, Miller M, Miao L, Ma X, Feng N, Giuliani V, Geck Do M, Czako B, Palmer WS, Mseeh F, Asara JM, Jiang Y, Morlacchi P, Zhao S, Peoples M, Tieu TN, Warmoes MO, Lorenzi PL, Muller FL, DePinho RA, Draetta GF, Toniatti C, Jones P, Heffernan TP, and Marszalek JR. 2019. Functional Genomics Reveals Synthetic Lethality between Phosphogluconate Dehydrogenase and Oxidative Phosphorylation. Cell reports 26: 469–482 e465. [DOI] [PubMed] [Google Scholar]
- 77.Ma J, Wei K, Liu J, Tang K, Zhang H, Zhu L, Chen J, Li F, Xu P, Chen J, Liu J, Fang H, Tang L, Wang D, Zeng L, Sun W, Xie J, Liu Y, and Huang B. 2020. Glycogen metabolism regulates macrophage-mediated acute inflammatory responses. Nature communications 11: 1769. [DOI] [PMC free article] [PubMed] [Google Scholar]
- 78.Maliekal P, Sokolova T, Vertommen D, Veiga-da-Cunha M, and Van Schaftingen E. 2007. Molecular identification of mammalian phosphopentomutase and glucose-1,6-bisphosphate synthase, two members of the alpha-D-phosphohexomutase family. The Journal of biological chemistry 282: 31844–31851. [DOI] [PubMed] [Google Scholar]
- 79.Mantuano NR, Oliveira-Nunes MC, Alisson-Silva F, Dias WB, and Todeschini AR. 2019. Emerging role of glycosylation in the polarization of tumor-associated macrophages. Pharmacol Res 146: 104285. [DOI] [PubMed] [Google Scholar]
- 80.Tozzi MG, Camici M, Mascia L, Sgarrella F, and Ipata PL. 2006. Pentose phosphates in nucleoside interconversion and catabolism. Febs Journal 273: 1089–1101. [DOI] [PubMed] [Google Scholar]
- 81.Lorkiewicz P, Higashi RM, Lane AN, and Fan TW. 2012. High information throughput analysis of nucleotides and their isotopically enriched isotopologues by direct-infusion FTICR-MS. Metabolomics : Official journal of the Metabolomic Society 8: 930–939. [DOI] [PMC free article] [PubMed] [Google Scholar]
- 82.Stein LR, and Imai S.-i.. 2012. The dynamic regulation of NAD metabolism in mitochondria. Trends in endocrinology and metabolism: TEM 23: 420–428. [DOI] [PMC free article] [PubMed] [Google Scholar]
- 83.Howard M, Grimaldi JC, Bazan JF, Lund FE, Santos-Argumedo L, Parkhouse RM, Walseth TF, and Lee HC. 1993. Formation and hydrolysis of cyclic ADP-ribose catalyzed by lymphocyte antigen CD38. Science 262: 1056–1059. [DOI] [PubMed] [Google Scholar]
- 84.Botta D, Rivero-Nava L, and Lund F. 2014. The NAD glycohydrolase CD38 regulates macrophage effector function and defense against Listeria monocytogenes. (INC7P.409). The Journal of Immunology 192: 186.110–186.110. [Google Scholar]
- 85.Fan TWM, Bruntz RC, Yang Y, Song H, Chernyavskaya Y, Deng P, Zhang Y, Shah PP, Beverly LJ, Qi Z, Mahan AL, Higashi RM, Dang CV, and Lane AN. 2019. De novo synthesis of serine and glycine fuels purine nucleotide biosynthesis in human lung cancer tissues. The Journal of biological chemistry 294: 13464–13477. [DOI] [PMC free article] [PubMed] [Google Scholar]
- 86.Daneshmandi S, Cassel T, Lin P, Higashi RM, Wulf GM, Boussiotis VA, Fan TW, and Seth P. 2021. Blockade of 6-phosphogluconate dehydrogenase generates CD8(+) effector T cells with enhanced anti-tumor function. Cell reports 34: 108831. [DOI] [PMC free article] [PubMed] [Google Scholar]
- 87.Zois CE, and Harris AL. 2016. Glycogen metabolism has a key role in the cancer microenvironment and provides new targets for cancer therapy. J Mol Med (Berl) 94: 137–154. [DOI] [PMC free article] [PubMed] [Google Scholar]
- 88.Ceperuelo-Mallafré V, Ejarque M, Serena C, Duran X, Montori-Grau M, Rodríguez MA, Yanes O, Núñez-Roa C, Roche K, Puthanveetil P, Garrido-Sánchez L, Saez E, Tinahones FJ, Garcia-Roves PM, Gómez-Foix AM, Saltiel AR, Vendrell J, and Fernández-Veledo S. 2016. Adipose tissue glycogen accumulation is associated with obesity-linked inflammation in humans. Molecular metabolism 5: 5–18. [DOI] [PMC free article] [PubMed] [Google Scholar]
- 89.Liu M, Tong Z, Ding C, Luo F, Wu S, Wu C, Albeituni S, He L, Hu X, Tieri D, Rouchka EC, Hamada M, Takahashi S, Gibb AA, Kloecker G, Zhang H.-g., Bousamra M II, Hill BG, Zhang X, and Yan J. 2020. Transcription factor c-Maf is a checkpoint that programs macrophages in lung cancer. The Journal of Clinical Investigation 130: 2081–2096. [DOI] [PMC free article] [PubMed] [Google Scholar]
- 90.Bokulich M 2007. Chronic Inflammation, NF-kB, and Cancer. SCI&MED 10(3):180–193. 10: 180–193. [Google Scholar]
- 91.Haschemi A, Kosma P, Gille L, Evans CR, Burant CF, Starkl P, Knapp B, Haas R, Schmid JA, Jandl C, Amir S, Lubec G, Park J, Esterbauer H, Bilban M, Brizuela L, Pospisilik JA, Otterbein LE, and Wagner O. 2012. The sedoheptulose kinase CARKL directs macrophage polarization through control of glucose metabolism. Cell metabolism 15: 813–826. [DOI] [PMC free article] [PubMed] [Google Scholar]
- 92.Barnes PJ, and Karin M. 1997. Nuclear factor-kappaB: a pivotal transcription factor in chronic inflammatory diseases. N Engl J Med 336: 1066–1071. [DOI] [PubMed] [Google Scholar]
- 93.Menten P, Wuyts A, and Van Damme J. 2002. Macrophage inflammatory protein-1. Cytokine Growth Factor Rev 13: 455–481. [DOI] [PubMed] [Google Scholar]
- 94.Fan TW, Higashi RM, Song H, Daneshmandi S, Mahan AL, Purdom MS, Bocklage TJ, Pittman TA, He D, Wang C, and Lane AN. 2021. Innate immune activation by checkpoint inhibition in human patient-derived lung cancer tissues. eLife 10: e69578. [DOI] [PMC free article] [PubMed] [Google Scholar]
- 95.Viola A, Munari F, Sánchez-Rodríguez R, Scolaro T, and Castegna A. 2019. The Metabolic Signature of Macrophage Responses. Frontiers in immunology 10: 1462–1462. [DOI] [PMC free article] [PubMed] [Google Scholar]
- 96.Davies LC, Rice CM, McVicar DW, and Weiss JM. 2019. Diversity and environmental adaptation of phagocytic cell metabolism. J Leukoc Biol 105: 37–48. [DOI] [PMC free article] [PubMed] [Google Scholar]
- 97.Lin R, Elf S, Shan C, Kang HB, Ji Q, Zhou L, Hitosugi T, Zhang L, Zhang S, Seo JH, Xie J, Tucker M, Gu TL, Sudderth J, Jiang L, Mitsche M, DeBerardinis RJ, Wu S, Li Y, Mao H, Chen PR, Wang D, Chen GZ, Hurwitz SJ, Lonial S, Arellano ML, Khoury HJ, Khuri FR, Lee BH, Lei Q, Brat DJ, Ye K, Boggon TJ, He C, Kang S, Fan J, and Chen J. 2015. 6-Phosphogluconate dehydrogenase links oxidative PPP, lipogenesis and tumour growth by inhibiting LKB1-AMPK signalling. Nat Cell Biol 17: 1484–1496. [DOI] [PMC free article] [PubMed] [Google Scholar]
- 98.Sag D, Carling D, Stout RD, and Suttles J. 2008. Adenosine 5’-monophosphate-activated protein kinase promotes macrophage polarization to an anti-inflammatory functional phenotype. Journal of immunology (Baltimore, Md. : 1950) 181: 8633–8641. [DOI] [PMC free article] [PubMed] [Google Scholar]
- 99.Li F, He X, Ye D, Lin Y, Yu H, Yao C, Huang L, Zhang J, Wang F, Xu S, Wu X, Liu L, Yang C, Shi J, He X, Liu J, Qu Y, Guo F, Zhao J, Xu W, and Zhao S. 2015. NADP(+)-IDH Mutations Promote Hypersuccinylation that Impairs Mitochondria Respiration and Induces Apoptosis Resistance. Molecular cell 60: 661–675. [DOI] [PubMed] [Google Scholar]
- 100.Chen X S. B, Wang M, Kang S, Wang T, Gnanaprakasam JNR, Liu L, Cassel TA, Scott DA, Muñoz-Cabello AM, Lopez-Barneo J, Yang J, Lane AN, Xin G, Stanton BZ, Fan TW, Wang R. . 2022. Succinate dehydrogenase/complex II is critical for metabolic and epigenetic regulation of T cell proliferation and inflammation. Sci Immunol 7: eabm8161. [DOI] [PMC free article] [PubMed] [Google Scholar]
- 101.Nawaz A, Aminuddin A, Kado T, Takikawa A, Yamamoto S, Tsuneyama K, Igarashi Y, Ikutani M, Nishida Y, Nagai Y, Takatsu K, Imura J, Sasahara M, Okazaki Y, Ueki K, Okamura T, Tokuyama K, Ando A, Matsumoto M, Mori H, Nakagawa T, Kobayashi N, Saeki K, Usui I, Fujisaka S, and Tobe K. 2017. CD206(+) M2-like macrophages regulate systemic glucose metabolism by inhibiting proliferation of adipocyte progenitors. Nature communications 8: 286. [DOI] [PMC free article] [PubMed] [Google Scholar]
- 102.Baardman J, Verberk SGS, Prange KHM, van Weeghel M, van der Velden S, Ryan DG, Wust RCI, Neele AE, Speijer D, Denis SW, Witte ME, Houtkooper RH, O’Neill L A, Knatko EV, Dinkova-Kostova AT, Lutgens E, de Winther MPJ, and Van den Bossche J. 2018. A Defective Pentose Phosphate Pathway Reduces Inflammatory Macrophage Responses during Hypercholesterolemia. Cell reports 25: 2044–2052 e2045. [DOI] [PubMed] [Google Scholar]
- 103.Veras FP, Peres RS, Saraiva ALL, Pinto LG, Louzada-Junior P, Cunha TM, Paschoal JAR, Cunha FQ, and Alves-Filho JC. 2015. Fructose 1,6-bisphosphate, a high-energy intermediate of glycolysis, attenuates experimental arthritis by activating anti-inflammatory adenosinergic pathway. Scientific reports 5: 15171–15171. [DOI] [PMC free article] [PubMed] [Google Scholar]
- 104.Anastasiou D, Yu Y, Israelsen WJ, Jiang JK, Boxer MB, Hong BS, Tempel W, Dimov S, Shen M, Jha A, Yang H, Mattaini KR, Metallo CM, Fiske BP, Courtney KD, Malstrom S, Khan TM, Kung C, Skoumbourdis AP, Veith H, Southall N, Walsh MJ, Brimacombe KR, Leister W, Lunt SY, Johnson ZR, Yen KE, Kunii K, Davidson SM, Christofk HR, Austin CP, Inglese J, Harris MH, Asara JM, Stephanopoulos G, Salituro FG, Jin S, Dang L, Auld DS, Park HW, Cantley LC, Thomas CJ, and Vander Heiden MG. 2012. Pyruvate kinase M2 activators promote tetramer formation and suppress tumorigenesis. Nat Chem Biol 8: 839–847. [DOI] [PMC free article] [PubMed] [Google Scholar]
- 105.Kang K, Park SH, Chen J, Qiao Y, Giannopoulou E, Berg K, Hanidu A, Li J, Nabozny G, Kang K, Park-Min KH, and Ivashkiv LB. 2017. Interferon-gamma Represses M2 Gene Expression in Human Macrophages by Disassembling Enhancers Bound by the Transcription Factor MAF. Immunity 47: 235–250 e234. [DOI] [PMC free article] [PubMed] [Google Scholar]
Associated Data
This section collects any data citations, data availability statements, or supplementary materials included in this article.