

Abstract

Liesegang pattern (LP) is one example of self-organized periodic precipitation patterns in nonequilibrium systems. Several studies have demonstrated that the LP morphology can track physicochemical environmental conditions (e.g., temperature); however, the polarity effect has not been explored to date. In this study, a copper chromate system is used to reveal the impact of solvent polarity on the evolving LP structure using water/organic solvent mixtures. In the typical case of using water/dimethyl sulfoxide (DMSO) mixtures, two drastic changes in LP morphology with increasing DMSO contents were found: (i) increasing frequency of the original structure and (ii) formation of a hierarchical pattern with the appearance of another, lower-frequency structure. Furthermore, the simulation model operating with a bimodal size distribution, allowing both homogeneous and heterogeneous precipitations showed good agreement with the experimental results. Therefore, this study demonstrated that LP can be tailored by solvent polarity and can be used for designing hierarchical precipitation patterns in a straightforward manner.
1. Introduction
Out of equilibrium conditions control various self-assembly and self-organization processes in biological, physical, geochemical, and chemical systems.1,2 These processes are important in the formation and design of artificial hierarchical structures with high functionality like those found in nature.3−5 The Liesegang phenomenon (Liesegang pattern (LP) or periodic precipitation) is one of the examples of self-organized chemical patterns with periodic layered structures in nonequilibrium systems.6−8 This type of pattern formation occurs in a porous medium (typically in hydrogels), in which a homogeneously distributed electrolyte (X–, inner electrolyte) is in contact with another medium containing another electrolyte (M+, outer electrolyte).9−11 A periodic array of precipitate (MX) forms due to the diffusion of M+ into the gel and a reaction with X– (M+ + X– → MX). The periodicity of the typical LPs shows a general property, namely the distances of bands measured from the gel interface are the members of a geometric progression. This empirical rule is known as the spacing law12−14
| 1 |
where n is the band number, xn and xn+1, are the distance of the nth and (n + 1)th bands measured from the interface between media containing M+ and X–, and p is the spacing coefficient, which is constant at large values of n. Furthermore, the inter-band spacing (Δxn) deduced by the spacing law is given by
| 2 |
Generally, Δxn increases with increasing n, and this type of pattern is called regular LP.9,14 The regular-type LP generation can be observed in the CuCrO4 system and many other precipitation systems.9,14−20 However, when Pb2+ is used instead of Cu2+ as an outer electrolyte, exceptional LP can be formed, in which Δxn decreases in contrast to the regular-type pattern, which is the so-called revert (invert) LP.21−23 This difference was discussed from the perspective of the property of colloidal stability.24−27 Also, some LPs sometimes showed the formation of hierarchical layered structures with the coexistence of two patterns with different frequencies of periodicity.21,28,29 Furthermore, recent studies on LPs have focused on investigating, in both simulations and experiments, how the periodicity of LPs is controlled and designed in response to physical and chemical conditions of the environment (such as the temperature,30 gel concentration,15 direct and alternating electric field,31,32 and mechanical deformation of the gel16). These factors can affect the precipitation by influencing the diffusion of M+, the chemical reaction between M+ and X–, and the nucleation and aggregation of the precipitate.
It is known that solvent polarity affects the stability of colloidal particles.33−37 Therefore, the polarity can also modify the routes to precipitation thus affecting the morphology and periodicity of the pattern formed. In this study, we investigate the effect of solvent polarity on the LP structures in the copper chromate precipitation system in an agarose gel. We used a mixture of water and dimethyl sulfoxide (DMSO), a popular aprotic solvent, for the gel preparation, and we changed the volume ratio (φDMSO) to control the polarity of the dispersing media. The relative dielectric constants (εr) of water and DMSO are 78 and 47 at 20 °C,38 respectively; since lower εr indicates a lower polarity, by increasing φDMSO the polarity in gels is reduced. In our experiments, we found that, by decreasing the polarity of the system, the global structure of the obtained pattern shifted from the regular-type to the revert-type. Furthermore, the regular-type had a fine periodic structure with a length scale (100 μm) smaller than the formed revert pattern itself (∼1 cm). This represents the formation of hierarchical LPs where different periodicities coexist. To extend our concept, we investigated the pattern formation using other common organic solvents (N,N-dimethylformamide (DMF), ethylene glycol (EG), tert-butyl alcohol (TBA), glycerol (GL), and glycerol carbonate (GC)).
2. Experimental Section
2.1. Reagents and Instrument
Agarose powder (Type I) as a reaction medium, copper (II) chloride (CuCl2, 97%) as the outer electrolyte, potassium chromate (K2CrO4, ≥99.0%) as the inner electrolyte, and EG (≥99.5%), GL (≥99.5%), DMF (≥99%), DMSO (≥99.9%), and TBA (≥99.5%) were purchased from Sigma-Aldrich. All reagents were used without further purification. Pattern formation experiments were carried out in glass test tubes with a diameter of 10 mm. The line profile analysis was performed using ImageJ software. The particle size distribution and ζ potential were measured using dynamic light scattering (DLS) measurement with a Malvern Zetasizer NanoZS (Malvern Panalytical) at 25 °C.
2.2. Pattern Formation in Organic Solvents/Water Gels with Different Volume Fractions of Organic Solvents (φOS)
Agarose powder was added to ultrapurified water, and this mixture was continuously stirred using a magnetic stirrer (150 rpm) at 90 °C until complete dissolution of the agarose, making the solution transparent. Subsequently, this solution was cooled at room temperature until the temperature of the solution dropped below 70 °C. This temperature was determined by considering the lowest boiling point of the organic solvents used in this study (TBA, 82 °C). After cooling, the organic solvent was added to this solution with prescribed φOS between water and organic solvents, and a concentrated aqueous solution of K2CrO4 (typically 10–1 M) was also added to this mixture. This agarose sol was added to a glass test tube at a height of 2:3 from the bottom (usually ∼65 mm). The concentration of agarose and K2CrO4 were fixed at 1.0% w/v and 1.0 × 10⁻² M. Subsequently, this sample was cooled in a refrigerator at ∼5 °C overnight to complete the gelation process. After gelation, the gel column was allowed to stand for 1 h at room temperature, and then a mixture of water and organic solvents containing CuCl2 (0.5 M, 1.5 mL) was poured on the top of the gel. The same volume ratio of organic solvents/water (φOS) was used in the gel (K2CrO4) and in the outer electrolyte (CuCl2) as well. All experiments on pattern formation were carried out at room temperature, and the time of the pattern formation was 1 week. The periodicity of the patterns was determined using a line profile analysis (Figure S1 in the Supporting information (SI)).
2.3. Measurements of the CuCrO4 Particle Size
First, the water/organic solvent mixture with K2CrO4 was prepared in a quartz cuvette (1 cm × 1 cm). Subsequently, the CuCl2 solution was added to this mixture and mixed by repeated pipetting up and down 10 times. Concentrations of K2CrO4 and CuCl2 were fixed at 1.0 × 10⁻⁴ M, only φOS was changed by adjusting the mixing volume ratio between water and organic solvents. Immediately after mixing, this colloid dispersion was measured by DLS at 25 °C to obtain the size distribution and average particle size.
2.4. Measurements of the ζ Potential
The same as in the size measurement, CuCl2 was mixed with K2CrO4 in the water/organic solvent mixture with different φOS. Also, concentrations of CuCl2 and K2CrO4 were the same as in the size measurement. Immediately after mixing, this dispersion was replaced in a folded capillary cell (Malvern DTS1070), then the ζ potential was measured at 25 °C.
3. Results and Discussion
Figure 1a shows the patterns obtained after one week at different φDMSO values. When φDMSO = 0 (the solvent is pure water), a clear periodic precipitation pattern with alternating precipitation and inter-band (no precipitate) regions was formed. Since Δxn increased with the distance measured from the liquid–gel interface, the produced pattern was the regular-type LP. When φDMSO increased from 0 to 0.1, Δxn was found to decrease, thus producing a higher frequency pattern, although the morphology of the regular-type was preserved. In the case of φDMSO = 0.2, a different trend was observed: while maintaining the overall regular morphology, the formation of a clear precipitate in the inter-band regions was observed. The structure of the pattern was further changed when φDMSO was increased up to 0.3. The frequency of the bands increased, and the precipitate formed in the inter-band regions self-organized into a secondary structure having a lower frequency with respect to the primary pattern. Interestingly, in the secondary structure, the distance between the precipitate bands became smaller further away from the liquid–gel interface, generating a revert-type LP.21−23 However, the primary (higher frequency) structure remained regular and the distance between the bands increased toward the bottom of the test tube (Figure 1b(i)). Therefore, the global periodicity of the pattern switched from regular to the revert-type when φDMSO was changed from 0.2 to 0.3. High and low-frequency patterns coexisted in the system in a way that the low-frequency pattern is the revert one. Although some previous studies have reported two types of coexistence so far, these are classified into the following two types: coexistence of (i) two independent regular-type structures with high and low frequencies28,29 or (ii) revert-type with low frequency and local structure in-between regular- and equidistant-type with high frequency.21 Therefore, our pattern structure represents a new class of hierarchical LPs.
Figure 1.

(a) Pattern formation of the CuCrO4 system using different volume ratios of DMSO (φDMSO) ranging from φDMSO = 0 (pure water) to φDMSO = 0.5 (water:DMSO = 50%:50%). (b) Enlarged optical photographs of regions (i)–(iii) in (a).
On increasing φDMSO to 0.5, the original high-frequency primary pattern tended to disappear, and it could be seen only in the regions of the low-frequency pattern (Figure 1b(ii),(iii)). Indeed, this change in the distribution of the primary patterns was also observed using optical microscopy (Figure S2 in the SI). Also, the time course of pattern formation for φDMSO = 0, 0.3, and 0.5 showed that the formation of bands with high-density precipitation and regions with low-density precipitation alternated from top to bottom in both high- and low-frequency patterns (Figures S3–S5 in the SI). Therefore, the phenomena in this system can be explained by a nucleation-particle aggregation-based mechanism (pre-nucleation model) that is frequently employed to understand Liesegang systems.12,39−41
To extend the effect of polarity, we also used other organic solvents: DMF (εr = 40)42 as another aprotic solvent and EG (εr = 38),43 TBA (εr = 12),44 GL (εr = 47), and GC (εr = 116)45−47 as protic solvents (Figures S6–S9 in the SI). In the case of DMF, there was no revert pattern formation, while the frequency of the primary pattern increased as the DMF content increased (Figure S6 in the SI). In contrast, EG and TBA showed a transition similar to the case observed in DMSO (Figures S7 and S8 in the SI). Therefore, the pattern transition from regular to revert-type and formation of the low-frequency pattern structure occurred regardless of the type of solvents (protic or aprotic). Furthermore, it was suggested that periodicity could be controlled by the polarity because the length scale of both structures with lower and higher frequency depending on the type and the volume ratios of the solvents.
To explore the details of the abovementioned transition of the morphology and the periodicity of the obtained patterns, a line profile analysis in Figure 1a was performed (Figure 2a). When φDMSO = 0–0.1, precipitation regions appeared as sharp peaks, and the inverted gray value showed spatial periodicity. Furthermore, the interval between two successive peaks increased with the distance from the gel surface. Therefore, the regular-type periodic precipitation pattern (LP) was formed. The baseline oscillated in space around x = 30–45 mm at φDMSO = 0.2, which indicated the presence of two types of regions having different amounts of precipitate, as seen in Figure 1a. Furthermore, broad peaks (e.g., at x = 18–25 mm) appeared periodically throughout the pattern at φDMSO = 0.3, and a high-frequency pattern was superimposed on the low-frequency pattern (Figure 2a(i)). One low-frequency zone contained ∼10 precipitation bands from the high-frequency pattern. With further increase of φDMSO, the amplitude of the oscillation of the high-frequency pattern decreased (φDMSO = 0.4, Figure 2a(ii)), and the high-frequency pattern disappeared, only the low-frequency revert pattern dominated at φDMSO= 0.5. Also, we analyzed the variation of the width of nth band (wn) in xn for the revert-type bands (low-frequency patterns) obtained at φDMSO = 0.3–0.5 (Figure S10 in the SI). Previous experiments and simulations showed that wn usually increases linearly with increasing xn (wn ∼ xn: so-called width law) for the regular-type LPs, which means that the density of material in each band is constant, and they satisfy the mass conservation.48,49 In contrast, the obtained revert patterns in this study showed a linear decrease in wn with increasing xn, which indicates that the revert-type LPs should satisfy the inverted form of the classical width law for the regular-type LPs.
Figure 2.
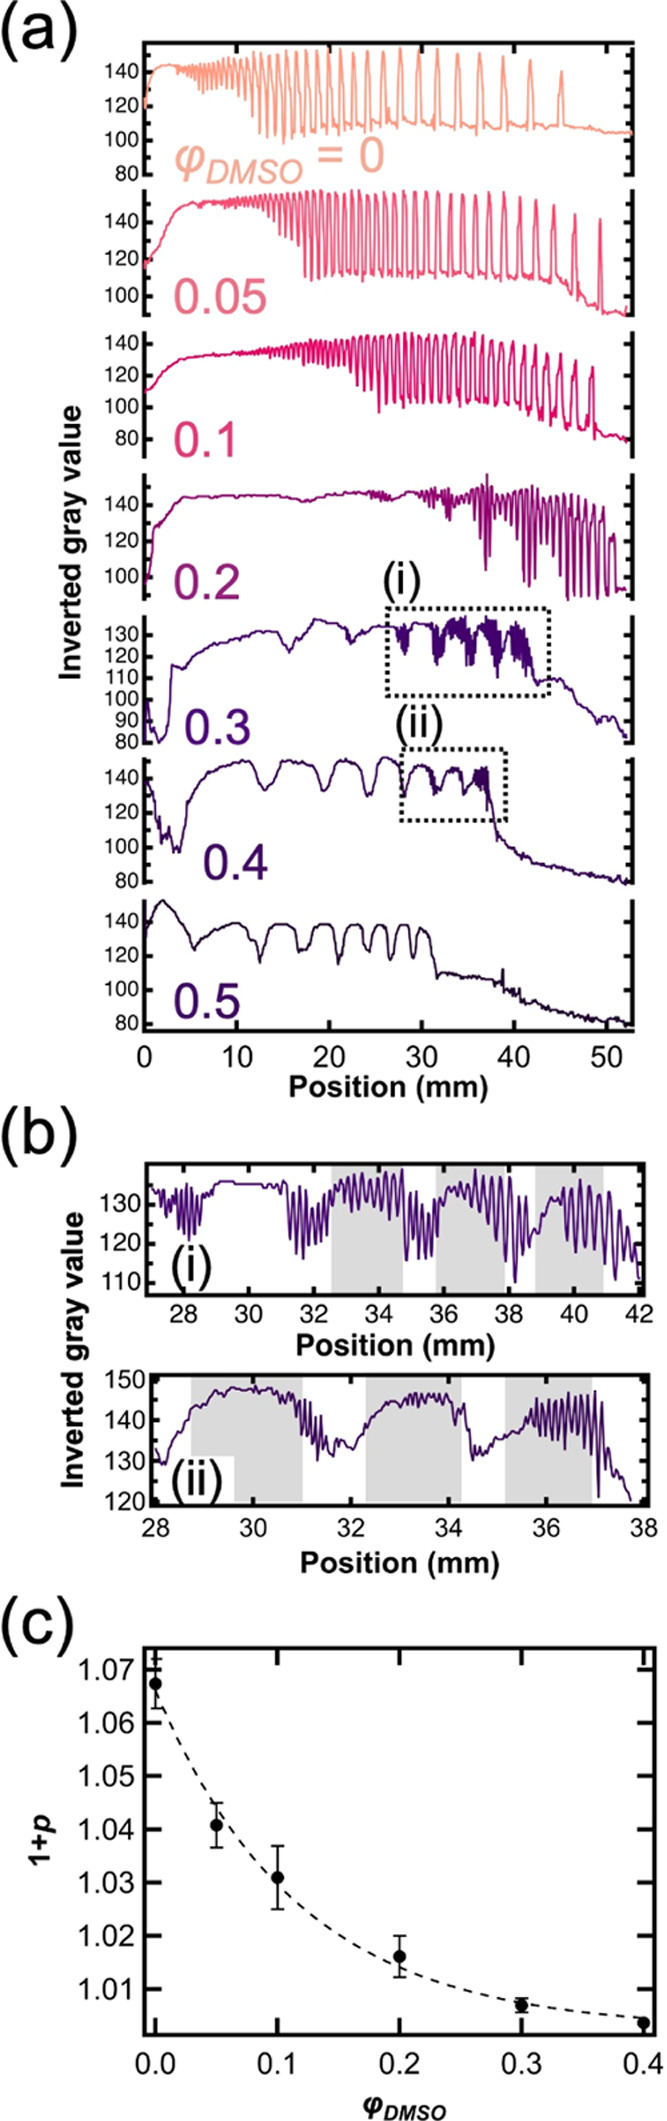
(a) Line profile analysis of the LPs starting from the liquid–gel interface (position = 0) to the bottom of test tubes at various DMSO contents. (b) Enlarged views of the regions (i) and (ii) are indicated as dotted line squares in (a). (c) Relationship between the spacing coefficient (p) and φDMSO. The plot was fitted by a power function (f(x) = f(0) + αxβ, where α and β are coefficients). Error bars were obtained from 5 replicates, which were calculated using p-values < 0.05.
Profiles of the patterns obtained using other solvents also showed a good agreement with the trend obtained in DMSO (Figure S11 in the SI). In particular, EG had a very similar pattern of transition behavior. We can conclude that lowering the polarity of the gel medium leads to a global pattern transition from the regular to the revert one with a hierarchical structure, namely the coexistence of high and low-frequency precipitation regions. Figure 2c shows the relationship between the spacing coefficient (eq 1) and φDMSO, where p is calculated from the primary regular-type at φDMSO = 0–0.1 and the high-frequency pattern above φDMSO = 0.2. The spacing coefficient decreases exponentially with the DMSO content. Furthermore, this change showed a good agreement with a fitting curve based on the power function. Other solvents also showed a similar trend (Figure S12 in the SI), the decreasing polarity reduces the inter-band spacing of regular LPs and facilitates the formation of revert hierarchical precipitation structures.
To obtain more information about the possible mechanism of the pattern transition and the formation of low-frequency bands, we measured the particle size and ζ potential of CuCrO4 particles formed in water/DMSO mixtures with different φDMSO. Figure 3a shows the size distribution measured by dynamic light scattering (DLS). When φDMSO = 0, a rather broad peak centered at 300 nm is obtained, which narrows and decreases until φDMSO = 0.2. At φDMSO = 0.3 and 0.4, a bimodal distribution appeared, the value of the smaller size peak was less than 100 nm, the second one is greater than 200 nm. The size at the 1st peak (corresponding to smaller particles) decreased monotonically with φDMSO and slightly increased at φDMSO = 0.5 (Figure 3b). At the same time, the ζ potential shows a pronounced increase with increasing DMSO content (Figure 3c). Particles had a positive ζ potential (∼10 mV) in water (φDMSO = 0), indicating excess Cu2+ ion adsorption at the surface of the CuCrO4 particles. The measured ζ potential peaked around 40 mV at φDMSO = 0.3, while a further increase of the DMSO content decreases its value. The reason why the ζ potential increased up to φDMSO = 0.3 is that the decreasing dielectric constant of the embedding medium leads to improvement of electric repulsion because εr is in the denominator in the relationship of electrostatic interaction.50 Furthermore, it has to be noted that the ζ potential increase is accompanied by decreasing DLS size (Figure 3a,b), which indicates a more stable nanoparticle dispersion as a result of increased electric double-layer repulsion. The apparent decrease of the ζ potential above φDMSO = 0.3 can be attributed to the loss of particle stability, also reflected in the appearance of a second peak on the DLS graph. On the other hand, as with decreasing solvent polarity the attractive dispersion interaction increases rapidly,50 after a given DMSO content, an increase in attraction will dominate, resulting in the partial loss of colloid stability, hence a larger DLS size. Similar measurements were carried out for DMF, EG, and TBA as well (Figure S13 in the SI), leading qualitatively to the same results. It has to be pointed out, that the solvent composition where particle stability is lost, correlates with the dielectric constant of each added solvent; the lower its value, the smaller volume fraction, which is sufficient to induce the formation of a population with a larger size. This bimodal distribution has important implications for the formation of complex patterns in the gels, as in this case, two different precipitation processes can take place with different kinetics.28,29,51 Also, this bimodal distribution appeared only in the presence of agarose (Figure S14a,b in the SI). Furthermore, the existence of two different precipitation processes was strongly supported by the kinetics of the particle size measurements in the water/DMSO mixture with a low concentration of agarose (Figure S14c in the SI), where the rate of increase in the hydrodynamic size of the peak for bigger particles in the bimodal distribution was greater than that for the peak for smaller particles due to the electrostatic stabilization. Therefore, this distribution was likely to result from a relatively fast precipitation process (heterogeneous precipitation) facilitated by the presence of agarose for unstable particles due to the decrease in polarity and a relatively slow process, in which the remaining electrostatically stabilized particles themselves form precipitates (homogeneous precipitation). Based on this, a possible mechanism to explain why the hierarchical structure was formed with decreasing polarity is proposed as follows. Since a major component of the system at φDMSO = 0 is unstable colloidal particles with low ζ potential, the heterogeneous process dominates the precipitation and the high-frequency pattern formation. However, the proportion of electrostatically stable particles increases with increasing φDMSO, the contribution of the homogeneous process increases, and the system creates bimodal distribution (i.e., the competition between the heterogeneous and homogeneous process), which induces the formation of low-frequency and hierarchical patterns. Furthermore, because the peak with bigger particles finally unified with the peak of smaller particles, and the bimodal distribution disappeared at φDMSO = 0.5, the homogeneous process becomes the dominant process in the pattern formation mechanism instead of the heterogeneous process, which induces localizing and reducing the abundance of high-frequency pattern as shown in Figures 1b, 2a,b, and S2 in the SI.
Figure 3.

(a) Size distribution of CuCrO4 colloidal particles in aqueous solution with different φDMSO, measured by dynamic light scattering (DLS). (b) Relationship between the mean particle size at the 1st peak (with a smaller size in bimodal distribution) and φDMSO. (c) Relationship between the ζ potential of CuCrO4 particles and φDMSO. Error bars were obtained from 3 replicates, which were calculated using p-values < 0.05.
We also performed numerical simulations to verify the validity of the above possible mechanism. As we mentioned above, we considered the homogeneous and heterogeneous precipitation processes, where nucleation and aggregation of a small-size species take place in the solvent phase (homogeneous precipitation), with the eventual deposition of the aggregates on agarose, which itself acts as a source of heterogeneous precipitation as well. The latter allows for the formation of large species directly on the biopolymer matrix. We assumed that a competition of these two processes forms both the high and low-frequency patterns in the system. The following mechanism was used in the simulations:
Homogeneous precipitation process:
| 3 |
| 4 |
| 5 |
| 6 |
Heterogeneous precipitation process:
| 7 |
| 8 |
| 9 |
| 10 |
The reaction between Cu2+ (A) and CrO42– (B) produces seeds (C) (eq 3), and C turns into bigger nanoparticles (D) by growth and aggregation (eq 4) and autocatalytic aggregation (eq 5), D finally transforms into an immobile precipitate (E) (eq 6). In a competitive process, the seeds attached to the agarose network (F) are formed through heterogeneous nucleation (eq 7), and precipitate (G) is directly formed from F by aggregation and precipitation because the diffusion of particles is limited on the agarose matrix (eq 8). Equations 9 and 10 represent autocatalytic aggregation and precipitation. r1–r8 are the reaction rates for each process, and k1–k8 are the corresponding rate constants. a, b, c, d, e, f, and g are the concentrations of A, B, C, D, E, F, and G, respectively. c*, f*, and g* are the threshold concentrations. These processes can be expressed by the following set of partial differential equations (reaction-diffusion equations)
| 11 |
| 12 |
| 13 |
| 14 |
| 15 |
| 16 |
| 17 |
where DA, DB, Dc, DD, and DF are the diffusion coefficients of A, B, C, D, E, F, and G, respectively. In the model, DA, DC, DF, and c* are expressed as functions of the volume fraction (φ) and distance (x) based on the experimental results (for details see the SI) to relate the polarity effect to the reaction-diffusion kinetics in the Liesegang system with CuCrO4 precipitates. Briefly, DA(φ) and DF(φ) were expressed as decreasing functions of φ. In fact, the diffusion rate of Cu2+ was strongly decelerated by increasing φ (Figure S15 in the SI), while the ζ potential increased with φ (Figure 3c), revealing a stronger interaction of the particles with the agarose matrix. On the other hand, the polarity dependence of DF was not applied to DD since D was defined as one of the chemical species for the homogeneous process, and there is no electrostatic interaction between D and agarose. Due to the diffusion of the outer electrolyte (CuCl2) into the gel, the concentration of the Cu2+ ions decreases as we go away from the interface. The lower copper ion concentration decreases the surface charge, which results in less stable particles (c* decreases). Also, some previous studies showed that the particle size increased in the distance measured from the gel–liquid interface in Liesegang systems,52 we expected that a decrease in c* also led to increasing the particle size. In summary, this effect might have two consequences for the CuCrO4 particles without binding to the agarose: (i) the diffusion coefficient of C decreases due to the increase in particle size, and (ii) the aggregation threshold decreases in x. Therefore, we expressed both DC and c* as decreasing functions of x as discussed in some previous studies.21−23,25,26 Furthermore, these studies showed that the decreasing function of threshold was mainly contributed by revert LP. Therefore, we predicted that the low-frequency revert LP emerged when the homogeneous process is pronounced by the stabilization of particles due to the increase in φ. In contrast to the expression of DC, we applied that DD was independent of the position (x). According to the previous study which investigated the diffusivity of nanoparticles in a gel medium, the diffusion coefficient of particles decreased inversely with the hydrodynamic radius.53 This result indicates that differences in diffusion coefficients due to size differences between relatively large particles are not significant. Since D corresponds to bigger particles than C, the size effect on the diffusivity of D should be less than C. Therefore, we used the expression without the dependency of position for DD. The details of the numerical model and the simulations (including information for all parameters) can be found in the SI.
The simulation results provided a qualitative agreement with the results of global transition and formation of high and low-frequency patterns observed in the experiments (Figures 4 and S16 in the SI). When φ = 0, the regular LP was formed (Figure 4a left panel), the same as in the experiment at φDMSO = 0. As φ was increased, the frequency of the primary patterns increased and the low-frequency pattern appeared generating a superimposed high-frequency pattern on the low-frequency one (Figure 4a middle panel). In the case of φ = 0.5, the high-frequency pattern disappeared completely in the system leaving only low-frequency revert patterns (Figure 4a right panel). These trends become more vivid by obtaining concentration profiles of E and G (Figure 4b). This result shows a good agreement with the experimental results (Figures 2b and S2 in the SI). Also, the contribution of each process is shown in Figure S17 in the SI, where the homogeneous process formed low-frequency revert LPs with increasing φ, while the heterogeneous process promoted high-frequency regular LP formation. Therefore, based on the simulation results, we can propose that the pattern transitions and the formation of the superimposed high and low-frequency patterns are driven by the polarity of the solvent and governed by two precipitation pathways with different reaction rates.
Figure 4.

(a) Effect of φ on the pattern structure in simulations (φDMSO in experiments), where φ = 0 and 0.5 correspond to conditions of pure water and water/DMSO mixture of 1:1. Color changes from green to yellow show the sum of concentrations (e + g) of species E and G. (b) Concentration profiles of E + G in simulations at various φ. Regions surrounded by the dotted line square at φ = 0.3–0.5 are inserted into the right panel of each condition as enlarged graphs. Gray regions in enlarged graphs correspond to the formation of the low-frequency revert patterns.
4. Conclusions
In summary, in experiments on the precipitation of CuCrO4 in different mixtures of water and various organic solvents (DMSO, DMF, EG, TBA, and GC), we have demonstrated that the polarity of the medium in a hydrogel matrix affects the morphology of LP. We interpreted the observed results with the support of numerical simulation based on the homogeneous and heterogeneous precipitation processes. Typically, depending on the DMSO content (i.e., overall polarity of the solvent mixture), (i) we could control the frequency of regular LPs (Figure 2c), and (ii) the global periodicity transited from regular to revert patterns, we finally obtained the hierarchical pattern coexisting with the revert low-frequency pattern with superimposed high-frequency regular pattern (Figures 1b and 2b). Similar trends were also observed in some other organic solvents as well. The results of size and ζ potential measurements showed the possibility that the competition of two different precipitation processes was induced depending on the polarity of the medium. Based on this result, we constructed one possible model, and simulation using this model showed good qualitative agreement with experimental observations. According to this behavior, LP could be employed for practical purposes to track the polarity changes in unknown solvents, similar to the use of LPs for tracking environmental changes.15,16,30 Moreover, tuning the solvent polarity can be a promising strategy to control, tailor, and design both regular LPs and new hierarchical structures. In addition, hierarchical layered structures are of great importance for the design of self-organized functional materials from nano- to macroscale.3−5 Some recent studies showed that LPs can be formed using some functional materials (e.g., metal nanoparticles and metal–organic frameworks), and another study indicated how to form microscale periodicity.17,20,54,55 By combining this knowledge with our strategy of polarity-based LP control, LP could be a potential candidate for the generation of self-organized hierarchical layered structures with various functions and structures.
Acknowledgments
This work was supported by JSPS Overseas Challenge Program for Young Researchers (Identification Number 202180075), JSPS Postdoctoral Fellowship Program for Overseas Researchers (Identification Number 202260298), the National Research, Development, and Innovation Office of Hungary (K131425, FK128327, and FK142148), and the National Research, Development, and Innovation Fund of Hungary under Grant TKP2021-EGA-02 and TKP2021-NKTA-05.
Glossary
Abbreviations
- LP
Liesegang pattern
- EG
ethylene glycol
- GL
glycerol
- DMF
N,N-dimethylformamide
- DMSO
dimethyl sulfoxide
- TBA
tert-butyl alcohol
- DLS
dynamic light scattering
- εr
relative dielectric constants
Supporting Information Available
The Supporting Information is available free of charge at https://pubs.acs.org/doi/10.1021/acs.jpcb.2c05810.
Procedures for the synthesis of GC, solubility product (Ksp) measurements, and line profile analysis, detail of numerical simulation and model; results of optical microscopy observations, time-course, pattern formation with organic solvents (DMF, EG, TBA, GL, and GC), line profile, spacing coefficient, DLS, and ζ potential measurements, Ksp measurements, diffusion of Cu2+, and simulations (PDF)
Author Contributions
F.R., B.B., and I.L. conceived the study. M.I. carried out the experiments, data analysis, and prepared the draft. G.H. constructed the numerical model and performed the simulations based on the discussion with M.I. and I.L. D.Z. and A.D. supported experiments and discussion regarding the measurements of particle size and ζ potential. GC was synthesized by F.R., R.C., and P.L.N. All authors interpreted the data. The manuscript was written through contributions of all authors.
The authors declare no competing financial interest.
Supplementary Material
References
- Grzybowski B. A.; Bishop K. J. M.; Campbell C. J.; Fialkowski M.; Smoukov S. K. Micro- and Nanotechnology via Reaction–diffusion. Soft Matter 2005, 1, 114–128. 10.1039/b501769f. [DOI] [Google Scholar]
- Epstein I. R.; Xu B. Reaction–diffusion Processes at the Nano- and Microscales. Nat. Nanotechnol. 2016, 11, 312–319. 10.1038/nnano.2016.41. [DOI] [PubMed] [Google Scholar]
- Roth W. J.; Gil B.; Makowski W.; Marszalek B.; Eliášová P. Layer Like Porous Materials with Hierarchical Structure. Chem. Soc. Rev. 2016, 45, 3400–3438. 10.1039/C5CS00508F. [DOI] [PubMed] [Google Scholar]
- Shehzad K.; Xu Y.; Gao C.; Duan X. Three-dimensional Macro-structures of Two-dimensional Nanomaterials. Chem. Soc. Rev. 2016, 45, 5541–5588. 10.1039/C6CS00218H. [DOI] [PubMed] [Google Scholar]
- Yang X.-Y.; Chen L.-H.; Li Y.; Rooke J. C.; Sanchez C.; Su B.-L. Hierarchically Porous Materials: Synthesis Strategies and Structure Design. Chem. Soc. Rev. 2017, 46, 481–558. 10.1039/C6CS00829A. [DOI] [PubMed] [Google Scholar]
- Liesegang R. E. Ueber einige Eigenschaften von Gallerten. Naturwiss. Wochenschr. 1896, 11, 353–362. [Google Scholar]
- Nabika H.; Itatani M.; Lagzi I. Pattern Formation in Precipitation Reactions: The Liesegang Phenomenon. Langmuir 2020, 36, 481–497. 10.1021/acs.langmuir.9b03018. [DOI] [PubMed] [Google Scholar]
- Nakouzi E.; Steinbock O. Self-organization in Precipitation Reactions Far from the Equilibrium. Sci. Adv. 2016, 2, e1601144 10.1126/sciadv.1601144. [DOI] [PMC free article] [PubMed] [Google Scholar]
- Lagzi I. Controlling and Engineering Precipitation Patterns. Langmuir 2012, 28, 3350–3354. 10.1021/la2049025. [DOI] [PubMed] [Google Scholar]
- Smoukov S. K.; Bitner A.; Campbell C. J.; Kandere-Grzybowska K.; Grzybowski B. A. Nano- and Microscopic Surface Wrinkles of Linearly Increasing Heights Prepared by Periodic Precipitation. J. Am. Chem. Soc. 2005, 127, 17803–17807. 10.1021/ja054882j. [DOI] [PubMed] [Google Scholar]
- Badr L.; Sultan R. Ring Morphology and pH Effects in 2D and 1D Co(OH)2 Liesegang Systems. J. Phys. Chem. A 2009, 113, 6581–6586. 10.1021/jp8094984. [DOI] [PubMed] [Google Scholar]
- Antal T.; Droz M.; Magnin J.; Rácz Z.; Zrinyi M. Derivation of the Matalon-Packter Law for Liesegang patterns. Chem. Phys. 1998, 109, 9479–9486. 10.1063/1.477609. [DOI] [Google Scholar]
- Thomas S.; Molnár F.; Rácz Z.; Lagzi I. Matalon–Packter Law for Stretched Helicoids Formed in Precipitation Processes. Chem. Phys. Lett. 2013, 577, 38–41. 10.1016/j.cplett.2013.05.031. [DOI] [Google Scholar]
- Itatani M.; Fang Q.; Nabika H. Modification of the Matalon–Packter Law for Self-Organized Periodic Precipitation Patterns by Incorporating Time-Dependent Diffusion Flux. J. Phys. Chem. B 2021, 125, 6921–6929. 10.1021/acs.jpcb.1c02175. [DOI] [PubMed] [Google Scholar]
- Itatani M.; Fang Q.; Unoura K.; Nabika H. Programmable Design of Self-Organized Patterns through a Precipitation Reaction. J. Phys. Chem. B 2020, 124, 8402–8409. 10.1021/acs.jpcb.0c05603. [DOI] [PubMed] [Google Scholar]
- Morsali M.; Khan M. T. A.; Ashirov R.; Hollo G.; Baytekin H. T.; Lagzi I.; Baytekin B. Mechanical Control of Periodic Precipitation in Stretchable Gels to Retrieve Information on Elastic Deformation and for the Complex Patterning of Matter. Adv. Mater. 2020, 32, 1905779 10.1002/adma.201905779. [DOI] [PubMed] [Google Scholar]
- Zakhia Douaihy R.; Al-Ghoul M.; Hmadeh M. Liesegang Banding for Controlled Size and Growth of Zeolitic-Imidazolate Frameworks. Small 2019, 15, 1901605 10.1002/smll.201901605. [DOI] [PubMed] [Google Scholar]
- Sultan R.; Halabieh R. Effect of an Electric Field on Propagating Co(OH)2 Liesegang Patterns. Chem. Phys. Lett. 2000, 332, 331–338. 10.1016/S0009-2614(00)01200-8. [DOI] [Google Scholar]
- Badr L.; Moussa Z.; Hariri A.; Sultan R. Band, Target, and Onion Patterns in Co(OH)2 Liesegang Systems. Phys. Rev. E 2011, 83, 016109 10.1103/PhysRevE.83.016109. [DOI] [PubMed] [Google Scholar]
- Park J. H.; Paczesny J.; Kim N.; Grzybowski B. A. Shaping Microcrystals of Metal-Organic Frameworks by Reaction-Diffusion. Angew. Chem., Int. Ed. 2020, 59, 10301–10305. 10.1002/anie.201910989. [DOI] [PubMed] [Google Scholar]
- Karam T.; El-Rassy H.; Sultan R. Mechanism of Revert Spacing in a PbCrO4 Liesegang System. J. Phys. Chem. A 2011, 115, 2994–2998. 10.1021/jp200619g. [DOI] [PubMed] [Google Scholar]
- Kalash L.; Farah H.; Eddin A. Z.; Sultan R. Dynamical Profiles of the Reactive Components in Direct and Revert Liesegang Patterns. Chem. Phys. Lett. 2013, 590, 69–73. 10.1016/j.cplett.2013.10.035. [DOI] [Google Scholar]
- Ezzeddine D.; El-Rassy H.; Sultan R. Surface and Structural Studies in a PbCrO4 Liesegang Pattern with Revert Spacing. Chem. Phys. Lett. 2019, 734, 136735 10.1016/j.cplett.2019.136735. [DOI] [Google Scholar]
- Kanniah N.; Gnanam F. D.; Ramasamy P.; Laddha G. S. Revert and Direct Type Liesegang Phenomenon of Silver Iodide. J. Colloid Interface Sci. 1981, 80, 369–376. 10.1016/0021-9797(81)90195-8. [DOI] [Google Scholar]
- Kanniah N.; Gnanam F. D.; Ramasamy P. Revert and Direct Liesegang Phenomenon of Silver Iodide: Factors Influencing the Transition Point. J. Colloid Interface Sci. 1983, 94, 412–420. 10.1016/0021-9797(83)90281-3. [DOI] [Google Scholar]
- Kanniah N.; Gnanam F. D.; Ramasamy P. A New Spacing Law for Liesegang Rings. Proc. - Indian Acad. Sci. 1984, 93, 801–811. 10.1007/BF02866341. [DOI] [Google Scholar]
- Kulkarni S. D.; Walimbe P. C.; Ingulkar R. B.; Lahase J. D.; Kulkarni P. S. Revert Banding in One-Dimensional Periodic Precipitation of the (AgNO3 + KBr) System in Agar Gel. ACS Omega 2019, 4, 13061–13068. 10.1021/acsomega.9b00937. [DOI] [PMC free article] [PubMed] [Google Scholar]
- Smoukov S. K.; Lagzi I.; Grzybowski B. A. Independence of Primary and Secondary Structures in Periodic Precipitation Patterns. J. Phys. Chem. Lett. 2011, 2, 345–349. 10.1021/jz101679t. [DOI] [Google Scholar]
- Tóth R.; Walliser R. M.; Lagzi I.; Boudoire F.; Duggelin M.; Braun A.; Housecroft C. E.; Constable E. C. Probing the Mystery of Liesegang Band Formation: Revealing the Origin of Self-organized Dual-frequency Micro and Nanoparticle Arrays. Soft Matter 2016, 12, 8367–8374. 10.1039/C6SM01564F. [DOI] [PubMed] [Google Scholar]
- Khan M. T. A.; Kwiczak-Yiğitbaşı J.; Tootoonchian P.; Morsali M.; Lagzi I.; Baytekin B. Chemical Tracking of Temperature by Concurrent Periodic Precipitation Pattern Formation in Polyacrylamide Gels. ACS Appl. Mater. Interfaces 2022, 14, 7252–7260. 10.1021/acsami.1c20640. [DOI] [PMC free article] [PubMed] [Google Scholar]
- Lagzi I.; Kármán D. Equidistant Precipitate Pattern Formation Behind a Propagating Chemical Front. Chem. Phys. Lett. 2003, 372, 831–835. 10.1016/S0009-2614(03)00524-4. [DOI] [Google Scholar]
- Bena I.; Droz M.; Lagzi I.; Martens K.; Rácz Z.; Volford A. Designed Patterns: Flexible Control of Precipitation through Electric Currents. Phys. Rev. Lett. 2008, 101, 075701 10.1103/PhysRevLett.101.075701. [DOI] [PubMed] [Google Scholar]
- Dash U. N. Solute–solvent Interactions and Dissolution of Some Sparingly Soluble Silver Salts in Various Solvent Systems. Fluid Phase Equilib. 1981, 5, 323–336. 10.1016/0378-3812(80)80064-1. [DOI] [Google Scholar]
- Dash U. N.; Pattanaik E.; Sahu R. Solute-solvent Interactions: Dissolution of Sparingly Soluble Silver Salts in Aqueous-organic Solvent Systems. Fluid Phase Equilib. 1991, 63, 101–110. 10.1016/0378-3812(91)80023-O. [DOI] [Google Scholar]
- Humayun H. Y.; Shaarani M. N. N. M.; warrior A.; Abdullah B.; Salam M. A. The Effect of Co-solvent on the Solubility of a Sparingly Soluble Crystal of Benzoic Acid. Procedia Eng. 2016, 148, 1320–1325. 10.1016/j.proeng.2016.06.548. [DOI] [Google Scholar]
- Dembek M.; Bocian S.; Buszewski B. Solvent Influence on Zeta Potential of Stationary Phase—Mobile Phase Interface. Molecules 2022, 27, 968 10.3390/molecules27030968. [DOI] [PMC free article] [PubMed] [Google Scholar]
- Lyklema J. Principles of the Stability of lyophobic Colloidal Dispersions in Non-aqueous Media. Adv. Colloid Interface Sci. 1968, 2, 67–114. 10.1016/0001-8686(68)85001-8. [DOI] [Google Scholar]
- Płowaś I.; Świergiel J.; Jadżyn J. Relative Static Permittivity of Dimethyl Sulfoxide + Water Mixtures. J. Chem. Eng. Data 2013, 58, 1741–1746. 10.1021/je400149j. [DOI] [Google Scholar]
- Dee G. T. Patterns Produced by Precipitation at a Moving Reaction Front. Phys. Rev. Lett. 1986, 57, 275–278. 10.1103/PhysRevLett.57.275. [DOI] [PubMed] [Google Scholar]
- Krug H.-J.; Brandtstädter H. Morphological Characteristics of Liesegang Rings and Their Simulations. J. Phys. Chem. A 1999, 103, 7811–7820. 10.1021/jp991092l. [DOI] [Google Scholar]
- Pan C.; Gao Q.; Xie J.; Xia Y.; Epstein I. R. Precipitation Patterns with Polygonal Boundaries Between Electrolytes. Phys. Chem. Chem. Phys. 2009, 11, 11033–11039. 10.1039/b904445k. [DOI] [PubMed] [Google Scholar]
- Kumbharkhane A. C.; Puranik S. M.; Mehrotra S. C. Dielectric Relaxation Studies of Aqueous N,N-dimethylformamide Using a Picosecond Time Domain Technique. J. Solution Chem. 1993, 22, 219–229. 10.1007/BF00649245. [DOI] [Google Scholar]
- Zahn M.; Ohki Y.; Fenneman D. B.; Gripshover R. J.; Gehman V. H. Dielectric Properties of Water and Water/ethylene Glycol Mixtures for Use in Pulsed Power System Design. Proc. IEEE 1986, 74, 1182–1221. 10.1109/PROC.1986.13611. [DOI] [Google Scholar]
- Kumbharkhane A. C.; Puranik S. M.; Mehrotra S. C. Dielectric Relaxation of Tert-butyl Alcohol–water Mixtures Using a Time-domain Technique. J. Chem. Soc., Faraday Trans. 1991, 87, 1569–1573. 10.1039/FT9918701569. [DOI] [Google Scholar]
- Sonnati M. O.; Amigoni S.; Taffin de Givenchy E. P.; Darmanin T.; Choulet O.; Guittard F. Glycerol Carbonate as a Versatile Building Block for Tomorrow: Synthesis, Reactivity, Properties and Applications. Green Chem. 2013, 15, 283–306. 10.1039/C2GC36525A. [DOI] [Google Scholar]
- Sarri F.; Tatini D.; Tanini D.; Simonelli M.; Ambrosi M.; Ninham B. W.; Capperucci A.; Dei L.; Lo Nostro P. Specific Ion Effects in Non-aqueous Solvents: the Case of Glycerol Carbonate. J. Mol. Liq. 2018, 266, 711–717. 10.1016/j.molliq.2018.06.120. [DOI] [Google Scholar]
- Valletti N.; Acar M.; Cucciniello R.; Magrini C.; Budroni M. A.; Tatini D.; Proto A.; Marchettini N.; Lo Nostro P.; Rossi F. Glycerol Carbonate Structuring in Aqueous Solutions as Inferred from Mutual Diffusion Coefficient, Density and Viscosity Measurements in the Temperature Range 283.15–313.15 K. J. Mol. Liq. 2022, 357, 119114 10.1016/j.molliq.2022.119114. [DOI] [Google Scholar]
- Droz M.; Magnin J.; Zrinyi M. Liesegang Patterns: Studies on the Width Law. Chem. Phys. 1999, 110, 9618–9622. 10.1063/1.478927. [DOI] [Google Scholar]
- Rácz Z. Formation of Liesegang Patterns. Phys. A 1999, 274, 50–59. 10.1016/S0378-4371(99)00432-X. [DOI] [Google Scholar]
- Israelachvili J. N.Intermolecular and Surface Forces; Academic Press: Cambridge, Massachusetts, United States, 2011. [Google Scholar]
- Nabika H.; Sato M.; Unoura K. Liesegang Patterns Engineered by a Chemical Reaction Assisted by Complex Formation. Langmuir 2014, 30, 5047–5051. 10.1021/la5003786. [DOI] [PubMed] [Google Scholar]
- Walliser R. M.; Boudoire F.; Orosz E.; Tóth R.; Braun A.; Constable E. C.; Rácz Z.; Lagzi I. Growth of Nanoparticles and Microparticles by Controlled Reaction-diffusion Processes. Langmuir 2015, 31, 1828–1834. 10.1021/la504123k. [DOI] [PubMed] [Google Scholar]
- Moncure P. J.; Simon Z. C.; Millstone J. E.; Laaser J. E. Relationship between Gel Mesh and Particle Size in Determining Nanoparticle Diffusion in Hydrogel Nanocomposites. J. Phys. Chem. B 2022, 126, 4132–4142. 10.1021/acs.jpcb.2c00771. [DOI] [PubMed] [Google Scholar]
- Jiang J.; Sakurai K. Formation of Ultrathin Liesegang Patterns. Langmuir 2016, 32, 9126–9134. 10.1021/acs.langmuir.6b02148. [DOI] [PubMed] [Google Scholar]
- Farkas S.; Fonyi M. S.; Holló G.; Német N.; Valletti N.; Kukovecz Á.; Schuszter G.; Rossi F.; Lagzi I. Periodic Precipitation of Zeolitic Imidazolate Frameworks in a Gelled Medium. J. Phys. Chem. C 2022, 126, 9580–9586. 10.1021/acs.jpcc.2c02371. [DOI] [Google Scholar]
Associated Data
This section collects any data citations, data availability statements, or supplementary materials included in this article.