

Abstract
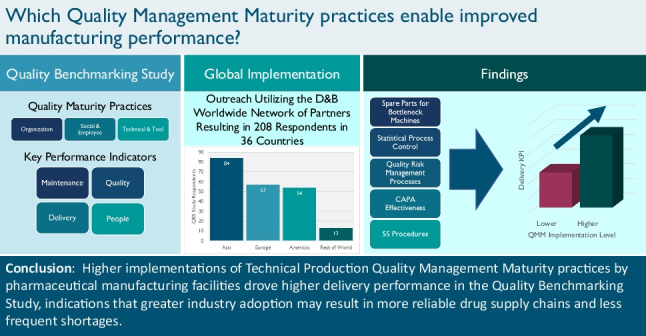
Over the past several decades, pharmaceutical manufacturing has become increasingly global and supply chains have become longer, more complex, and fragmented. While pharmaceutical products available to patients and customers typically conform with appropriate standards, supply chains are often affected by disruptive events and shocks that impact public health. One approach to assuring the availability of quality pharmaceutical products is to encourage drug manufacturers to invest in quality management maturity (QMM) and promote continual improvement. The interests of patients are served by risk-based drug shortage prevention and mitigation activities that help to proactively manage supply chain complexities and ensure availability of drugs. This paper demonstrates that adherence to certain quality practices enables improved manufacturing performance. Prior research has identified quality practices that are correlated with manufacturing performance. To better understand how these quality practices can be characterized, measured, and analyzed, this research project conducted a voluntary global study of pharmaceutical manufacturing establishments. Over 200 global pharmaceutical manufacturing establishments participated in this Quality Benchmarking Study (QBS) and provided data on manufacturing performance and self-assessments of adherence to quality practices. The analysis of these data found that the implementation level for selected quality management practices correlates positively with certain Key Performance Indicators (KPIs). More specifically, we found a significant positive correlation between (i) Delivery Performance and (ii) Application of QMM principles associated with Technical Production.
Graphical abstract
Keywords: Pharmaceutical manufacturing, Quality management maturity, Supply chain, Drug shortage prevention, Global study
Introduction
Part of the mission of the US Food and Drug Administration (FDA) is to ensure that quality pharmaceuticals are available for patients and consumers. FDA’s regulatory and research activities give the American public confidence of pharmaceutical quality, achieved by assuring that each dose of medicine is safe, effective, and free of contamination and defects. By law, all pharmaceutical manufacturing establishments must adhere to Current Good Manufacturing Practices (CGMP), which define the minimum manufacturing standards for drugs marketed in the USA.1 Compliance with CGMPs ensures proper design, monitoring, and controls for manufacturing processes and establishments.
Patients and consumers deserve confidence in the availability of their medicines. However, even prior to the Coronavirus Public Health Emergency, the global pharmaceutical supply chain confronted significant drug shortages and product recalls, largely for legacy products. Disruptions in the global pharmaceutical supply chain are recognized as a public health crisis (1) that puts patients at risk (2). Drug shortages are the result of many factors, including the “inability of the market to observe and reward quality” (3).
This limited patient access to critical drug products and undermined healthcare (4). The 2019 report Drug Shortages: Root Causes and Potential Solutions (5) issued by the multi-agency Federal Drug Shortages Task Force reported that 62% of drugs that went into shortage between 2013 and 2017 were associated with manufacturing or product quality problems, such as substandard manufacturing processes or quality defects in the finished product. These problems necessitate remediation and require time to address, interrupting production and leading to shortages. The Drug Shortages Task Force identified one root cause of drug shortages to be the fact that the market does not recognize and reward manufacturers for having mature quality management practices that focus on continual improvement and early detection of supply chain issues. As an enduring solution for this root cause, the report recommended the development of a ratings system to incentivize drug manufacturers to invest in quality management maturity (QMM) for their establishments. QMM is the state attained when drug manufacturers have consistent, reliable, and robust business processes to achieve quality objectives and promote continual improvement.
Over the past few years, FDA has initiated several efforts to improve drug quality (6–8) and study the relationship between quality management practices and manufacturing performance. An important finding from these efforts is that quality metrics can be used to monitor and control manufacturing processes as well as inform the continual improvement of product and process design (9–11). The research has also identified sound measurements for performance and cultural excellence (12–14). As the underlying knowledge of effective quality management has evolved, we have recognized the importance of a holistic approach that integrates quality metrics with mature quality management practices.
Recently, FDA proposed the development of a QMM program. The program seeks to develop objective ratings for the maturity of drug manufacturing establishments and their ability to deliver high-quality drug products reliably and without disruption. Operationalizing a QMM rating program for pharmaceutical establishments requires a collaborative and transparent partnership between FDA, industry, academia, and additional stakeholders. Establishments that have demonstrated higher levels of QMM may benefit from future regulatory flexibility for post-approval changes.
Recognizing the importance of QMM and the relationship to supply reliability, there has been a push from FDA2 and industry3 to develop frameworks for assessing maturity levels and promoting robust quality management practices. The Quality Benchmarking Study leveraged insights from industry-led efforts and was designed to collect objective data to inform both FDA and industry on key quality management practices that correlate with performance.
The QMM Program envisioned at CDER is a holistic approach that utilizes quality metrics to inform decision-making but also focuses on effective quality management practices. Hence, the effective use of quality metrics is one important element of robust QMM at an establishment. Research shows that quality management maturity and manufacturing performance are correlated and has identified quality management practices that most strongly differentiate establishments based on quality management maturity levels. More mature quality management practices proactively focus on outcomes that affect the patient or consumer, including reducing quality issues that might lead to defects, complaints, shortages, and quality-related adverse events. Establishments investing in mature quality management practices not only ensure reliable supply and less defects, but also obtain efficiency gains (e.g., speed, throughput, supply timeliness, etc.).
In the next section, this paper presents the methodology for data collection. Subsequent sections present and discuss the results. Finally, the paper concludes by elaborating on anticipated future activities and research opportunities.
Materials and Methods: Operational Excellence Benchmarking Methodology
To assist FDA CDER with identifying key quality management practices that correlate with manufacturing performance, Dun and Bradstreet (D&B), a global data and analytics company, leveraged its Worldwide Network partners4 covering 190 countries and markets to collect objective data through active participation and engagement across the global pharmaceutical manufacturing community. As part of this effort, FDA funded a research collaboration between D&B and the Institute of Technology Management at the University of St. Gallen, a leading research institution in the field of Operational Excellence (OPEX) in the pharmaceutical industry. St. Gallen defines OPEX in pharmaceutical manufacturing as not only a measure of high performance, but also the way in which high performance is achieved and how continual improvement is sustained (12–14).
The combination of the St. Gallen Pharmaceutical OPEX Benchmarking methodology with the reach and resources of D&B resulted in the Quality Benchmarking Study (QBS), an OPEX assessment applied to a sample of establishments that legally market drugs in the USA. The QBS deployed a questionnaire to obtain quantitative responses related to Key Performance Indicators (KPIs) that evaluate pharmaceutical manufacturing performance and Enablers, questions that measure the degree of implementation of selected quality management practices.
Key Performance Indicators (KPIs)
KPIs are objective, quantifiable measurements of a pharmaceutical manufacturing establishment’s operational performance that may be predictive of manufacturing quality failures and potential drug shortages. Based on statistical analyses, a subset of 13 KPIs from the comprehensive St. Gallen benchmarking program were identified to be included as QBS metrics. Table I lists these 13 KPIs across four categories.
Table I.
Quality Benchmarking Study KPIs
| Maintenance | Quality |
|
• Share of unplanned maintenance (of all time spent on maintenance) • Ratio: maintenance full-time equivalent (FTE) to Total FTE |
• Rejected batch rate (relative to all batches produced) • Recurring deviation rate (relative to all deviations) • Ratio: quality FTE to total FTE • Invalidated out-of-specification rate (of all out-of-specification results) • Average deviation closure time |
| Delivery | People |
|
• Order fulfilment customer—percentage delivery on time/right quantity • Order fulfilment supplier—percentage received on time/right quantity • Customer complaint rate (relative to dosage units) • Adherence to standard lead time (Lab) |
• Safety level—reported accidents • Sick leave as a percentage of total working time |
The raw KPI values collected from the questionnaire respondents are not comparable across KPIs. For example, one cannot compare reported accidents for safety level to the percentage of total working time for sick leave, nor can the two KPIs be combined to summarize a People section KPI. To facilitate a comparison of the thirteen KPIs and the calculation of summarized KPIs for overall and the four broad categories, the OPEX benchmarking methodology transforms the raw response values of each KPI into percentiles that compare each establishment with other establishments in its peer group. The OPEX benchmarking methodology assigns establishments to one or more of the following four peer groups based on the types of products manufactured:
Small Molecule Drug Substances
Large Molecule Drug Substances (i.e., therapeutic biological products)
Sterile Drug Products
Non-Sterile Drug Products
The Overall KPIs were derived as the average of the peer group-specific KPIs, providing a basis for comparison across all establishments regardless of the types of products they manufactured. Similarly, we calculated Section Scores for Maintenance, Quality, Delivery, and People as the average of the peer group-specific performance scores for the KPIs within each section. Figure 1 summarizes the QBS benchmarking methodology and the calculation of the Overall KPIs and Section Scores.
Fig. 1.

QBS benchmarking methodology. FTE, full-time equivalent; IOOS, invalidated out of specification
Enabler Questions
The QBS Questionnaire contained Enabler questions in addition to those used to benchmark KPIs. These Enabler questions measure the degree to which an establishment adheres to quality practices. Each Enabler question was self-assessed on a 1–5 Likert scale, where higher values represent a more comprehensive implementation of the QMM element. Unlike the KPIs, Enablers were not collected by peer group as the practices are comparable across products manufactured. Thus, each establishment had a single value for each Enabler, irrespective of the number of products manufactured at the establishment. Table II lists the Enablers included in the QBS study.
Table II.
Quality Benchmarking Study Enabler Set
| Organization | Social and Employee | Technical and Tools |
|---|---|---|
|
• We link product and process development for close collaboration • Performance metrics shall drive performance, apply to all employees and allow predictive analysis • Prioritization of Continual improvements • Customers frequently give us feedback on quality and delivery performance • Knowledge management allows/ensures we are immediately informed about all changes by contract manufacturing organizations (CMO)s and suppliers |
• Employees are very aware of the impact the products have on patients • Senior management is very involved in reviewing process performance and product quality reviews • Employees are engaged to identify and act on improvement ideas • Our employees are cross trained for a broad range of tasks • We train our employees on the LEAN/Operational Excellence (OPEX) tools they need |
• We are aware of bottleneck machines and supply them with additional spare parts • We use statistical tools to support our continual improvement program • We widely use SPC in real time • We apply a formal risk management process for all products and train employees accordingly • We use a structured RCA approach and evaluate our RCA effectiveness • We measure Corrective Action and Preventative Action (CAPA) effectiveness and identify non-effective CAPAs for additional measures • We widely use a 5S program • We widely use and improve Visual Management boards with KPIs in our manufacturing and QC areas |
Enabler questions are partitioned into three categories: Organization Enablers assess the incorporation of feedback systems and continual improvement, Social and Employee Enablers measure employee training and engagement, and Technical and Tools Enablers quantify the degree of implementation of technical methods and tools for optimization. In total, the QBS Questionnaire included 18 Enabler questions.
Results: Quality Benchmarking Study Execution
Execution of the QBS Questionnaire was a significant task as it required coordination with the D&B Worldwide Network, an extensive network of regional partners. These in-country resources conducted outreach to establishments in 52 countries and used an online module to collect questionnaire responses. Support services included questionnaire assistance from subject matter experts and data analysis to ensure data quality. Once completed, the team processed the data through St. Gallen’s OPEX Benchmarking methodology (12–14). In total, 208 establishments completed the QBS Questionnaire: 84 in Asia, 57 in Europe, 54 in the Americas, and 13 spread over the rest of the world. These counts show that respondents were relatively balanced between Asia, Europe, and the Americas.
Results: Pharmaceutical Quality Management Practices that Drive Operational Excellence
The goal of QBS was to leverage data-driven analytic techniques for the identification and extraction of specific quality management practices that drive higher manufacturing performance. The following sections of the paper detail this analysis, starting with an overall correlation analysis between Enabler responses and the KPIs, including each of the four section scores. We then analyzed a selection of Enablers from the Technical and Tools section and identified quality management practices that drive higher Delivery KPIs, focusing only on statistically significant results based on the QBS data collected.
For each of the Technical and Tools Section Enablers, we sought to identify the level of maturity and the associated behaviors that differentiate higher Delivery Performance from lower, as determined by the data collected. For some of these Enablers, the highest level of implementation (level 5) was required to demonstrate statistically significant differentiation in Delivery performance between it and the remaining levels of implementation. For other Enablers, maturity behaviors associated with lower levels of implementation were the differentiators. Thus, the levels of implementation associated with high Delivery performance differ among the 5 Enabler analyses presented.
Correlation Analysis
Enabler responses capture information related to fundamental quality management practices. One primary QMM program goal is to encourage the implementation of these quality management practices by industry as they are drivers for superior production quality and performance. The analysis in Table III correlates the Enabler responses with the KPIs to identify statistically significant drivers of higher Delivery performance. Highlighted cells indicate statistically significant correlations.
Table III.
Enabler Correlations with KPI Metrics

Note that only the five enabler questions with at least one significant positive correlation with KPI Section Scores were included in the table, each only correlating with the Delivery KPIs.
QMM Element #1: Spare Parts for Bottleneck Machines
A process bottleneck occurs when a stage of the manufacturing process chain cannot achieve its expected throughput, often caused by a temporary issue such as a machine breaking down. The QBS asked respondents about their approach to bottlenecks in the Technical and Tools Enabler question presented in Table IV.
Table IV.
Bottleneck Enabler Question
| To what degree are potential bottleneck machines identified and proactively supplied with additional spare parts? | |||
|---|---|---|---|
| Technical and Tools Enabler Responses for Bottlenecks | % Respondents | Mean Delivery KPI | |
| Group 1 |
1. Bottleneck machines are not identified. 2. Bottleneck machines are identified, but not in a dedicated process and not supplied with additional spare parts proactively. 3. Bottleneck machines are identified in a dedicated process, but not supplied with additional spare parts proactively. 4. Bottleneck machines are identified in a dedicated process, but only some are supplied with additional spare parts proactively. |
45.1% | 40.9 |
| Group 2 | 5. Bottleneck machines are identified in a dedicated process, which is updated regularly, and fully followed up by supplying additional spare parts proactively. | 54.9% | 50.3 |
The correlation analysis previously presented in Table III demonstrated that there was a significant positive correlation between the level of Bottleneck Enabler implementation and the Delivery KPI. Further analysis of the QBS questionnaire responses found significant discrimination between respondents that indicated level 5 implementation versus levels 1 through 4 implementations with mean Delivery KPIs of 50.3 and 40.9, respectively. The one-tailed t-test found the mean Delivery KPI to be significantly greater for respondents with higher levels of implementation (t = −2.704, p-value = 0.004). Bootstrap sampling of the t-statistic found a similar significance value (p-value = 0.004), indicating that the conclusion maintains validity if the t-test assumptions are violated.
QMM Element #2: Statistical Process Control (SPC)
SPC is leveraged by mature establishments to ensure consistency and quality of the drugs produced. Statistical tools such as control charts and scatterplots give indications of whether variations in critical process parameters are within a specified acceptable tolerance. Otherwise, a process is said to be “out of control.” The QBS Questionnaire asked participants about their use of SPC tools in the Enabler question presented in Table V.
Table V.
Statistical Process Control (SPC) Enabler Question
| To what degree do you use statistical process control (SPC) in your processes? | |||
|---|---|---|---|
| Technical and Tools Enabler Responses for SPC Implementation | % Respondents | Mean Delivery KPI | |
| Group 1 |
1. SPC not or rarely utilized, no equipment with real-time monitoring 2. SPC partly (>30%) utilized, no equipment with real-time monitoring |
38.6% | 41.2 |
| Group 2 |
3. SPC often utilized (>60%), little (<30%) equipment with real-time monitoring 4. SPC always utilized, some (>30%) equipment with real-time monitoring 5. SPC always utilized, >80% of equipment under real-time monitoring |
61.4% | 51.4 |
The correlation analysis previously presented in Table III demonstrated that there was a significantly positive correlation between the degree of SPC Enabler implementation and the Delivery KPI. Further analysis of the QBS Questionnaire responses found significant discrimination between respondents that indicated Levels 3 through 5 implementations versus levels 1 and 2 implementations with mean Delivery KPIs of 51.4 and 41.2, respectively. The one-tailed t-test found the average Delivery KPI to be significantly greater for respondents with higher levels of implementation (t = −2.9671, p-value = 0.002). Bootstrap sampling of the t-statistic found a similar significance value (p-value = 0.002), indicating that the conclusion maintains validity if the t-test assumptions are violated.
QMM Element #3: Quality Risk Management (QRM) Process
The use of knowledge management and quality risk management provides the means for science and risk-based decisions related to product quality. Product and process knowledge should be managed from development through the commercial life of the product up to, and including, product discontinuation. Effective QRM is dependent upon effective knowledge management and provides a proactive, systematic approach to the identification and avoidance of quality issues, ensuring quality/availability and product consistency throughout its lifecycle (22) and is integral to an effective pharmaceutical quality system. In the case of an issue, QRM utilization enables improved decision-making with respect to risk facilitated by science-based discovery of pertinent information. With the enabler question presented in Table VI, the QBS Questionnaire asked participants about their use of formal QRM processes, i.e., QRM processes defined by each establishment that cover all QRM elements for all stages of a drug’s lifecycle.
Table VI.
Quality Risk Management (QRM) Process Enabler Question
| Do you apply a formal quality risk management (QRM) process for all products and are your employees trained accordingly? | |||
|---|---|---|---|
| Technical and Tools Enabler Responses for QRM Implementation | % Respondents | Mean Delivery KPI | |
| Group 1 |
1. We do not have a formal quality risk management process. 2. We have a formal quality risk management process. However, it is not always applied, and employees are not trained on the procedures. 3. We have a formal quality risk management process. It is always applied for all new products/processes and SMEs (Subject Matter Experts) are trained according to it. |
28.1% | 37.9 |
| Group 2 |
4. We have a formal quality risk management process. It is always applied for all new products/processes and all relevant employees are trained accordingly. 5. We routinely review our existing quality risk management documentations (e.g., review initial assessments and mitigations based on production experience after a certain time). Procedures are clearly defined, and employees are trained accordingly. |
71.9% | 48.7 |
The correlation analysis previously presented in Table III demonstrated that there was a significantly positive correlation between the degree of QRM process implementation and the Delivery KPI. Further analysis of the QBS Questionnaire responses found significant discrimination between respondents that indicated levels 4 and 5 implementations versus levels 1 through 3 implementations with mean Delivery KPIs of 48.7 and 37.9, respectively. The one-tailed t-test found the average delivery score to be significantly greater for respondents with higher levels of implementation (t = −2.8096, p-value = 0.003). Bootstrap sampling of the t-statistic found a similar significance value (p-value = 0.003), indicating that the conclusion maintains validity if the t-test assumptions are violated.
QMM Element #4: CAPA Effectiveness
A system of taking Corrective Action and Preventive Action (CAPA) provides a structured approach to the collection and analysis of information, investigation of product quality issues, and the implementation of actions to prevent recurrence5. Essential steps in the implementation of CAPA activities include verification of the CAPAs, communication to responsible parties, management review of relevant information, and CAPA activity documentation. The QBS Questionnaire asked respondents about their use of CAPA systems in the Technical and Tools Enabler question presented in Table VII.
Table VII.
Corrective Action and Preventative Action (CAPA) Enabler Question
| Do you measure CAPA) effectiveness and identify CAPAs that are not effective? | |||
|---|---|---|---|
| Technical and Tools Enabler Responses for CAPA System Implementation | % Respondents | Mean Delivery KPI | |
| Group 1 |
1. We only use our CAPA system for documentation, i.e., we do not review the overall list of CAPAs, proportions of overdue CAPAs, or trends. 2. We use our CAPA system for documentation and review, e.g., the overall list of CAPAs, proportions of overdue CAPAs, or trends. 3. We have defined measures in place and are able to assess the overall effectiveness of the CAPA system. Furthermore, distinct ineffective CAPAs can be identified. 4. We have defined measures in place assessing the overall effectiveness of the CAPA system and identifying distinct ineffective CAPAs. Additional actions for all ineffective CAPAs are derived. |
51.9% | 42.2 |
| Group 2 | 5. We have defined measures in place assessing the overall effectiveness of the CAPA system, identifying distinct ineffective CAPAs and deriving additional actions. The measures are reviewed and updated regularly. | 48.1% | 49.4 |
The correlation analysis previously presented in Table III demonstrated that there was a significantly positive correlation between the CAPA System Enabler implementation and the Delivery KPI. Further analysis of the QBS Questionnaire responses found significant discrimination between respondents that indicated level 5 implementation versus levels 1 through 4 implementations with mean Delivery KPIs of 49.4 and 42.2, respectively. The one-tailed t-test found the average delivery score to be significantly greater for respondents with higher levels of implementation (t = −2.1306, p-value = 0.017). Bootstrap sampling of the t-statistic found a similar significance value (p-value = 0.019), indicating that the conclusion maintains validity if the t-test assumptions are violated.
QMM Element #5: 5S (Sort, Set in Order, Shine, Standardize, Sustain) Procedures
An implemented 5S System organizes pharmaceutical manufacturing spaces to maximize their efficiency, effectiveness, and safety (23). Overall, the system requires organization of tools and equipment and the maintenance of clean spaces. The following list details each aspect of the 5S system.
SortRemove all unnecessary items
Set in OrderOrganize workstations such that equipment is in close proximity and set in the logical order of use
ShineClean and inspect workspace on a regular basis
StandardizeEstablish standardized schedules for the Sort, Set in Order, and Shine steps
SustainEnsure employees are trained on 5S and follow through
The QBS Questionnaire asked respondents about their use of 5S procedures in the Technical and Tools Enabler question presented in Table VIII.
Table VIII.
5S (Sort, Set in Order, Shine, Standardize, and Sustain) Enabler Question
| To what degree have you implemented 5S (Sort, Set in Order, Shine, Standardize, Sustain) and continuously improve it? | |||
|---|---|---|---|
| Technical and Tools Enabler Responses for 5S Implementation | % Respondents | Mean Delivery KPI | |
| Group 1 |
1. We do not have formal procedures in place to implement 5S. 2. Formal procedures for putting all tools and fixtures in their place exist but are only partly (<50% of areas) adhered to. 3. Formal procedures for putting all tools and fixtures in their place exist that are fully adhered to but are static not optimized. |
44.0% | 39.3 |
| Group 2 |
4. Formal procedures for putting all tools and fixtures in their place exist that are fully adhered to, they are adapted/optimized unregularly, e.g., when requested by management. 5. Formal procedures for putting all tools and fixtures in their place exist that are fully adhered to; optimization constantly is our priority. |
56.0% | 51.3 |
The correlation analysis previously presented in Table III demonstrated that there was a significant positive correlation between 5S Enabler utilization and the Delivery KPI. Further analysis of the QBS Questionnaire responses found significant discrimination between respondents that indicated levels 4 and 5 implementations versus levels 1 through 3 implementations with mean Delivery KPIs of 51.3 and 39.3, respectively. The one-tailed t-test found the average delivery score to be significantly greater for respondents with higher levels of implementation (t = −2.2906, p-value = 0.012). Bootstrap sampling of the t-statistic found a similar significance value (p-value = 0.012), indicating that the conclusion maintains validity if the t-test assumptions are violated.
Implementation of QMM Elements
Establishments that implemented any of the five QMM elements demonstrated significant improvement in their Delivery KPI. Additional analysis of the QBS Questionnaire responses indicates that establishments with higher implementation of a majority of these five QMM elements have even higher performance discrimination than those that focus on fewer. Specifically, we compared establishments that had higher levels of implementation for four or more of these five QMM elements with establishments that employed three or less. Table IX provides the percentages of respondents that fall into each of these groups and the group’s mean Delivery KPI Performance Score.
Table IX.
Delivery KPI by Count of High Implementation Levels
| Number of higher implementation levels of QMM elements | ||
|---|---|---|
| 0 to 3 | 4+ | |
| % Respondents | 71.2% | 28.8% |
| Mean Delivery KPI | 42.0 | 54.7 |
A one-tailed t-test found the average Delivery Performance Score for establishments with four or more QMM elements to be significantly greater than the average for establishments with three or fewer elements (t = −3.639, p-value < 0.001). Bootstrap sampling of the t-statistic found a similar significance value (p-value < 0.001), indicating that the conclusion maintains validity if the t-test assumptions are violated.
Discussion
This paper used QBS Questionnaire responses to analyze relationships between the implementation of quality management practices and KPI Performance Scores. The shared insights derived from these data focused on how QMM elements displayed in the Tools and Technical Enabler questions drove higher Delivery KPI Performance Scores. Specifically, we demonstrated how the following five QMM elements displayed positive correlations with the Delivery KPI:
Proactively supply spare parts to all identified bottleneck machines
Make use of SPC with real-time equipment monitoring
Train all relevant employees on formalized QRM processes
Ensure CAPA Effectiveness
Adapt and optimize formalized 5S procedures
Additionally, establishments with higher levels of implementation for four or more of these QMM elements demonstrate even greater discrimination in performance versus those that had higher implementations for three or fewer.
In particular, equipment-related QMM elements play a particularly important role in the pharmaceutical industry as demonstrated by the positive correlation between 5S and the Delivery KPI. High implementation of 5S ensures well-designed facilities with clean, safe, and well-organized work environments. This helps to prevent process bottlenecks and assures that equipment is well maintained for manufacturing and packaging.
SPC utilizes statistical techniques to control a process by identifying and eliminating special-cause (i.e., assignable-cause) variation, thereby improving delivery performance (24). SPC models can be developed independently of the circumstances of the production system (25) and, therefore, support process stability and minimize supply chain disruptions, regardless of product type and complexity.
To fully capitalize on QRM, employees must be properly trained to apply QRM outcomes to future resource decisions. Consequently, QRM-trained employees are oriented toward high-quality standards and exhibit a deeper understanding of the role of quality (26). Similarly, training and human capital development have natural synergies with QMM elements that can improve productivity and quality (27).
An effective CAPA system facilitates root cause determination and prevents reoccurrence, improving understanding of products and processes (28, 29). A well-planned and executed CAPA delivers the rationale for the investigation, complete documentation, and guidance for appropriate management of any reoccurrence. In these ways, improvements in process stability from investigations can positively impact the Delivery KPI.
The research presented herein, though limited in the number of sites, represents an important step toward characterizing the link between QMM, supply reliability, and manufacturing performance. The maxim: “correlation does not imply causation” undoubtedly applies to our study. Therefore, it would be premature to conclude that certain enablers are not indicative of mature quality management practices due to the limited correlation analysis established through this study. In reality, they may have positive relationships with other performance measures used by industry. Furthermore, enablers for which no positive correlation was present cannot be eliminated because they might still be important quality management practices. This study was a first attempt with a limited sample size towards an understanding of such relationships.
Future Research Directions
The present study used a limited number of performance measures to explore correlations. If its scope is expanded, it could lead to greater granularity within the correlation analyses, associations, and significant statistical relations. Subsequent research with additional measures of performance areas, revised survey questions to enhance precision and clarity, and more participants is needed to expand on the empirical findings from our study. Further research to supplement these findings may also include studies with larger numbers of randomly selected sites, with expanded KPIs and enablers. In addition, future research could explore and quantify improvement gains to address the need for periodic re-assessment of firms. This could be performed capitalizing on a wealth of existing post-market quality data, including recalls, shortages, inspection outcomes and associated observations, and post-market quality defect reports, namely Field Alert Reports (FAR), Biologic Product Deviation Reports (BPDR), MedWatch reports, and Consumer Complaints (CC).
Future studies in this direction should attempt a properly conducted Design of Experiment (DOE) to quantify the effect of KPI and enabler variables independently, along with leading vs. lagging variable interactions. Fractional factorial methods can help guide improvements in performance metrics analysis. Association analysis could also prove useful to measure the relationships among multiple metrics and enablers (i.e., estimating the likelihood of events occurring based on the occurrence of other events). Because some metrics and enablers may be driving others, coupling metrics and analyzing them in combinations could provide meaningful insights. Finally, an interesting aspect to consider would be designing a methodology to study the interactions of multiple variables, including, but not limited to, people, maintenance, and quality, thereby assessing both linear and non-linear variable relationships with machine learning methods.
Conclusions
The QBS findings provide a promising foundation for additional research that can augment a robust understanding of how QMM characterizes quality. As establishments implement these approaches and regulators characterize quality management practices, there will be a rich set of data to drive continual improvement that will benefit patients and consumers. Purchasers and payors may gain insight into the supply chain for drugs they buy or reimburse. At the same time, patients, pharmacies, and healthcare professionals will benefit from improved clinical care via drugs that have less risk of quality-driven shortage. An improved characterization of quality management practices could complement FDA’s risk-based model for prioritizing surveillance inspections. In addition, QMM, along with quality metrics, could inform the assessment of pharmaceutical quality system effectiveness and consequently support ICH Q12 implementation through increased regulatory flexibility. All in all, the key research elements and findings obtained from this study provide objective analytical insights into the development of an effective and efficient QMM program that could provide advantages to all stakeholders as well as the FDA and may be a first step towards enabling performance-based regulations.
Acknowledgements
The authors would like to thank our colleagues at FDA CDER, Dun and Bradstreet, and University of St. Gallen for their helpful comments on the manuscript.
Author Contribution
The QBS Study survey module was developed as an adaptation of the Operational Excellence (OPEX) research by Dr. Thomas Friedli, Marten Ritz, and Matteo Bernasconi of St. Gallen University. Dr. Friedli, Mr. Ritz, and Mr. Bernasconi also contributed to the explanation of the QBS benchmarking methodology and discussion in the manuscript.
FDA CDER contracted Dun and Bradstreet to implement the QBS Study survey module, utilizing its network of partners for global outreach. Dr. Mark Seiss, Mat Swatek, and Matt Fellows processed collected survey data through the QBS benchmarking methodology and conducted statistical analyses on the results.
Ye Li, Jennifer Maguire, Nandini Rakala, Neil Stiber, and Alex Viehmann of FDA CDER oversaw the execution of the QBS Study and contributed to the discussion of the context of the study and its impact in the manuscript.
Funding
FDA CDER funded Dun and Bradstreet and the University of St. Gallen to conduct the QBS study under Contract 75F40119C10121 of the FDA Broad Agency Announcement FDABAA-19-00123.
Declarations
Conflict of Interest
The authors declare no competing interests.
Footnotes
The Federal Food, Drug and Cosmetic Act is interpreted in 21 CFR Part 210, 211, and 212.
For example: FDA’s Center for Devices and Radiological Health’s (CDRH) Case for Quality (15) and FDA’s Center for Drug Evaluation and Research’s (CDER) Quality Management Maturity Program (16, 17)).
For example: Parenteral Drug Association’s (PDA) Quality Culture research (18, 19) and International Society for Pharmaceutical Engineering’s (ISPE) Advancing Pharmaceutical Quality (20) and Proposals for FDA Quality Metrics Program (21).
See pages 10–11 in the Q10 Pharmaceutical Quality System: https://www.fda.gov/media/71553/download.
Any opinions provided in this article are the author’s own personal opinions and are not necessarily the views of Dun & Bradstreet.
Publisher’s Note
Springer Nature remains neutral with regard to jurisdictional claims in published maps and institutional affiliations.
References
- 1.European Medicines Agency, Reflection paper on medicinal product supply shortages caused by manufacturing/Good Manufacturing Practice Compliance Problems, EMA/590745/2012.
- 2.WHO, Medicines shortages: global approaches to addressing shortages of essential medicines in health systems, WHO Drug Information, Vol. 30, No. 2, 2016
- 3.Woodcock J, Wosińska M. Economic and technological drivers of generic sterile injectable drug shortages. Clin Pharmacol Ther. 2013;93(2):170–176. doi: 10.1038/clpt.2012.220. [DOI] [PubMed] [Google Scholar]
- 4.Yu LX, Kopcha M. The future of pharmaceutical quality and the path to get there. Int J Pharm. 2017;528(1-2):354–359. doi: 10.1016/j.ijpharm.2017.06.039. [DOI] [PubMed] [Google Scholar]
- 5.U.S. Food and Drug Administration. Drug shortages: root causes and potential solutions. 2019. https://www.fda.gov/drugs/drug-shortages/report-drug-shortages-root-causes-and-potential-solutions.
- 6.Yu LX, Raw A, Wu L, Capacci-Daniel C, Zhang Y, Rosencrance S. FDA’s new pharmaceutical quality initiative: knowledge-aided assessment & structured applications. Int J Pharm X. 2019;1:100010. doi: 10.1016/j.ijpx.2019.100010. [DOI] [PMC free article] [PubMed] [Google Scholar]
- 7.O’Connor TF, Yu LX, Lee SL. Emerging technology: a key enabler for modernizing pharmaceutical manufacturing and advancing product quality. Int. J Pharm. 2016;509(1-2):492–498. doi: 10.1016/j.ijpharm.2016.05.058. [DOI] [PubMed] [Google Scholar]
- 8.Fisher AC, Lee SL, Harris DP, et al. Advancing pharmaceutical quality: an overview of science and research in the US FDA’s office of pharmaceutical quality. Int J Pharm. 2016;515(1-2):390–402. doi: 10.1016/j.ijpharm.2016.10.038. [DOI] [PubMed] [Google Scholar]
- 9.Juran J, Godfrey AB. Juran’s quality handbook. New York: Mc Graw Hill; 1999. [Google Scholar]
- 10.Sam AP, Koch H. Quality metrics, quality culture, quality matters! Industrial Pharmacy Issue. 2014;44:18–22. [Google Scholar]
- 11.Torkko M, Katajavuori N, Linna A, Juppo AM. The utilization of quality KPIs in the pharmaceutical industry. J Pharm Innov. 2014;9:175–182. doi: 10.1007/s12247-014-9184-3. [DOI] [Google Scholar]
- 12.Friedli T, Köhler S, Buess P, Basu P, Calnan N. FDA quality metrics final report. 2017.
- 13.Friedli T, Köhler S, Buess P, Basu P, Calnan N. FDA quality metrics final report year 2. 2018.
- 14.Friedli T, Köhler S, Buess P, Basu P, Calnan N. FDA quality metrics final report year 3. 2019.
- 15.FDA-CDRH’s Case for Quality. (Retrieved March 18, 2022: https://www.fda.gov/medical-devices/quality-and-compliance-medical-devices/case-quality).
- 16.Woodcock J. Plenary Address at the 2014 PDA/FDA Joint Regulatory Conference October 2014. (Retrieved March 18, 2022: https://www.youtube.com/watch?x-yt-ts=1422503916&v=QUNbDSRPUhU&feature=player_detailpage&x-yt-cl=85027636).
- 17.FDA Quality Management Maturity Pilot Programs for Finished Dosage Forms and Active Pharmaceutical Ingredients, dated October 15th, 2020. (Retrieved March 18, 2022: https://www.fda.gov/drugs/development-approval-process-drugs/pharmaceutical-quality-resources).
- 18.Patel P, Baker D, Burdick R, Chen C, Hill J, Holland M, Sawant A. Quality culture survey report. PDA J Pharm Sci Technol. 2015;69(5):631–642. doi: 10.5731/pdajpst.2015.01078. [DOI] [PubMed] [Google Scholar]
- 19.Points to consider: Pharmaceutical Quality Metrics Updated September 2014. PDA Journal of Pharmaceutical Sci and Tech. 2014. Vol. 68, No. 5, September – October 2014. [DOI] [PubMed]
- 20.ISPE Advancing Pharmaceutical Quality Guides: Change Management System (Retrieved March 18, 2022: https://ispe.org/publications/guidance-documents/apq-guide-change-management-cm-system); Corrective Action and Preventive Action (CAPA) System (Retrieved March 18, 2022: https://ispe.org/publications/guidance-documents/corrective-action-preventive-action-capa-system); Management Responsibilities and Management Review (Retrieved March 18, 2022: https://ispe.org/publications/guidance-documents/apq-guide-management-responsibilities-review-mrr).
- 21.Proposals for FDA Quality Metrics Program - Whitepaper. IPSE. 20 December 2013. (Retrieved March 18, 2022: https://ispe.org/sites/default/files/training/quality-metrics-proposal.pdf).
- 22.Elder D, Teasdale A. “ICH Q9 quality risk management”, ICH quality guidelines: an implementation guide. 2017 pp 579-610.
- 23.Ho SK, Cicmil S, Fung CK. The Japanese 5-S practice and TQM training. Train Qual. 1995;3(4):19–24. doi: 10.1108/09684879510098222. [DOI] [Google Scholar]
- 24.Cua KO, McKone KE, Schroeder RG. Relationship between implementation of TQM, JIT, and TPM and manufacturing performance. J Operations Manag. 2001;19:675–694. doi: 10.1016/S0272-6963(01)00066-3. [DOI] [Google Scholar]
- 25.Floyd RC. Liquid lean – developing lean culture in the process industries.
- 26.Dean JW, Bowen DE. Management theory and total quality: improving research and practice through theory development. Acad Manag J. 1994;19:392–418. [Google Scholar]
- 27.MacDuffie JP. Human resource bundles and manufacturing performance: organizational logic and flexible production systems in the world of auto industry. Ind Labor Relat Rev. 1995;48:197–221. doi: 10.1177/001979399504800201. [DOI] [Google Scholar]
- 28.FDA. Guidance for Industry Q10 Pharmaceutical Quality System. 2009: https://www.fda.gov/media/71553/download. Accessed 1 Sep 2022.
- 29.Jain SK, Jain RK. Investigations and CAPA: quality system for continual improvement in pharmaceutical industry. Int J Res Pharm Pharm Sci. 2017;2:47–54. [Google Scholar]