

Abstract
This research aims to investigate the difference of the travel behaviours of the elderly in different urban areas. On the basis of the results of cluster analysis, the nested logit (NL) model is adopted to investigate the travel decision of the elderly in central urban areas and non-central urban areas. Moreover, it is used to forecast the change of their travel behaviours by implementing the policies of age-friendly society. The results show that the elderly in central urban areas are inclined to decide travel modes in advanced of determining trip chains, while the trip chains are first determined in non-central urban areas. For the central urban areas, the policies mainly affect the choice of travel modes of the elderly, rather than the choice of trip chains. However, for the non-central urban area, the policies simultaneously influence the choice of travel mode and trip chains of the elderly. Based on the results of the forecast, some measures are proposed in this study to meet different travel requirements of the elderly in central urban areas and non-central urban areas.
Keywords: The elderly, Travel behaviour, Two-step cluster, Nested logit model, Policy analysis
Introduction
In the past decades, there has been an appearance of population ageing in China, which has the most population in developing countries. According to the data of National Bureau of Statistics, as of 2019, the number of people aged ≥ 60 is 253.880 million, accounting for 18.100% of the total population in China. As a result of the change of social status, the travel behaviours of the elderly are converted from the commuting travel connected with living to the non-commuting travel related with personal and family life. At the same time, as the urbanization develops, the travel behaviours of the elderly are also changing due to the dualistic phenomenon between central urban areas and non-central urban areas. Therefore, it is meaningful to study the travel behaviours of the elderly in different locations and provide the foundation or supplement for the relevant department to formulate policies. The motivation of this study is to reasonably predict the travel behaviour of the elderly. The corresponding results will be used to analyse the behavioural characteristics of key populations. These can be used to address the challenges of an ageing population.
Driven by the background of urbanization, the travel behaviours of the elderly in different locations faced the following two problems. First, thoughtful facilities in central urban areas are planned and constructed reasonably near the neighbourhood, and they can better meet the daily living needs of the elderly. It invisibly leads to relatively long-distance and multi-purpose travel for the elderly in non-central urban areas, which will make the elderly in non-central urban areas have different travel behaviours (Tao & Shen, 2018). Thus, many elder people, who come to Beijing to reduce the living burden of their children, are mainly distributed among large neighbourhood and logistics parks in non-central urban areas. And their travel purpose is mainly to pick up their grandchildren or buy the necessary for family. Hence, the study on the travel behaviours of the elderly in different locations shows practical significance. The need for this research includes three aspects: (1) what is the impact of social ageing in developing countries on transportation? (2) how does the evolution of modern urban areas affect the travel behaviour of the elderly? (3) which factor is the key to the travel of the elderly since the epidemic?
This research aims to investigate the difference of the travel behaviours of the elderly in different urban areas. On the basis of the results of cluster analysis, the nested logit (NL) model is adopted to investigate the travel decision processes of the elderly in central urban areas and non-central urban areas. Moreover, it is used to forecast the change of their travel behaviours by implementing the relevant policies of age-friendly society. Therefore, the remaining content of this research is composed of five sections as follows. Section 2 is the literature review. Section 3 describes the source of data and the results of cluster-based methods. Section 4 presents the modelling adopted and the results of the model estimated and in the research. Afterwards, an analysis of the effect of various policies on the travel behaviours of the elderly is made in Sect. 5. The conclusions of this research and the discussions of future research issues are demonstrated in the last section.
Literature review
Among the travel behaviours, travel mode and trip chains are important for the effect of existing transportation policy and the efficiency of whole transportation system (Yang et al., 2016). In recent years, an increasing number of studies have explored traveller choice processes of travel mode and trip chains (Cheng et al., 2013; Wen & Koppelman, 2000; Yang et al., 2016). Krygsman et al. (2007) prove that in Netherlands, people choose travel chains earlier than travel mode in most situations. Hensher and Reyes (2000) point out that the complex trip chains have a negative effect to the choice of public transit in Australia. Islam and Habib (2012) analyse the travel behaviours of travellers in Switzerland and find that trip chains and travel mode are decided simultaneously. Li et al. (2013) demonstrate that the decision processes of people are different due to the difference of travel purpose. Obviously, the decision processes of people can be affected by the travel purpose and house location.
Existing works that investigate the determinants of travel behaviours of the elderly are chiefly conducted in developed countries (van den Berg et al., 2011). Few researches have been conducted in developing countries. In general, the determinants mainly include socio-demographic attributes and travel environment attribute. Many studies have showed socio-demographic characteristics, such as age, gender, income level, educational level and household size of individuals have a significant effect on the travel behaviours (Golob & Hensher, 2007; Petterssona & Schmöckerb, 2010; Rafiq & McNally, 2020; Su & Bell, 2009; Susilo & Kitamura, 2008; Zhang et al., 2007). In addition, travel environment attributes, such as density, diversity, design, destination and distance to public transit stop, are considered as important factors affecting travel behaviours. (Daisy et al., 2018; Kitamura & Susilo, 2005; Petterssona & Schmöckerb, 2010; Su & Bell, 2009; Winters et al., 2015).
As part of efforts to construct an age-friendly society, many policies have been implemented to accomplish an inclusive, safe and healthy living environment for the elderly. Some studies show that these policies can also affect the travel behaviours of the elderly to a certain extent (Mackett, 2014; Mah & Mitra, 2017; Zhang et al., 2019). The travel regularity of the elderly is often evident. From the point of view of taking public transportation, the departure time of the elderly is often fixed within a certain period every day. Under the assumption that the elderly would not change their departure time, this research explore whether the number of the elderly taking bus would change after the implementing the free buses. If the number of the elderly taking bus increases, it leads to more congestion of taking bus in the peak hours. If not, it is important to clarify the travel behaviours of the elderly. No matter what happens, some opinions can be provided to improve the travel environment of the elderly. In addition, there are some special policies, such as restrictions on elder people scooter (EPS) and income improvement, for the elderly in China. However, the impact of these policies on the travel behaviours of the elderly is still unclear.
There are some gaps in the existing studies. First, the spatial location of the elderly in urban areas, such as inner-city and suburban areas, is often underestimated. Second, previous models of elderly travel are often independent. As a result, the coupling effect between factors has not been deeply analysed. Finally, each country has numerous welfare policies for the elderly. These policies have not been analysed using a unified numerical methodology.
Focusing on the gaps in existing researches, the significant contributions of this paper lie in the following points: (1) This is the first survey on Chinese elderly travel since the epidemic of COVID-19; (2) this study innovatively focuses on the travel decision-making process of the elderly in central and non-central urban areas; (3) this is the first study to examine the relationship between age-friendly social policies and travel habits in China; (4) this article originally analyses four travel differences among the elderly between central and non-central urban areas.
Data
Data survey
The data by the travel survey of the elderly in Beijing are used in this research. The face-to-face survey is conducted from 3 November to 13 December 2020 in Beijing. Since we want to investigate the travel behaviours of the elderly, the respondents aged ≥ 60 are selected to complete the survey. The fifteen locations where the elderly gathered are selected within the 6th-Ring areas of Beijing, including five communities, four leisure parks, two shopping markets, two senior centres and two hospitals, as shown in Fig. 1. The area of a leisure park is usually within 1 km*1 km. For the elderly, the “long walk” is basically a slow walk within 3 km in the park. In the data survey, the trips of the elderly were recorded during the period of Monday to Friday. In China, 60 is both the legal retirement age and the defined age for “the elderly”. Therefore, the surveyed elderly are all retirees.
Fig. 1.

Location distribution of travel survey
During the investigation, we can account for some relevant problems or terms to make the elderly understand the questions and options accurately. The survey of the elderly with poor eyesight or hearing is completed by the family member who travel with them according to the true situation of their travel. At last, 620 respondents are randomly interviewed to complete the survey. After removing samples with missing information and obvious error, 606 valid samples are recovered, including 1,226 trip information records.
The chose variables involve individual attributes, household attributes and the information of all trips. They are taken as factors affecting travel behaviours of the elderly. Except for the variables mentioned above, some special variables including free buses card and EPS availability are developed in this study. The elderly are able to apply for the free buses card if they are the Beijing registered resident & ≥ 60. Since it is difficult to obtain the non-public detailed information of built environment in China, as many scholars did, the location variable is used to roughly evaluate built environment in this study. In traditional researches, the information of “location” mainly relates to residence, school, work place, park/recreation area, commercial area, and so on. In this study, the travel location information is included in the travel purpose. Therefore, the model mainly considers the category factor and uses the “location variable” to distinguish different categories of regions.
Data for this study were collected in late 2020. Although this period was during the COVID-19 period, China had entered normal epidemic prevention at that time. Travel restrictions had been largely lifted by then. In China, seniors are concerned about COVID-19. This leads them to be more cautious about long-distance (intercity) travel. At the same time, China’s low infection rate has made travel within cities unaffected. In addition, Chinese culture requires children to take care of their ageing parents. During the epidemic in Beijing, shopping for the elderly was usually replaced by children to some extent. However, most of the travel indicators selected in this study are based on the behaviour of the elderly themselves. For influencing factors, the impact of the epidemic is common, rather than specific to a certain factor. In addition, the average temperature in Beijing in December ranges from − 6 °C to a high of 4 °C. Compared to the warmer months of spring and fall, this will definitely affect older adults who exercise outdoors. To a certain extent, this affects the travel rate and travel patterns of the elderly. The above factors are also directions for further improvement in this study.
Cluster descriptions
A cluster-based modelling framework is applied to the Beijing elderly travel survey data in order to redefine the boundaries among different urban areas in Beijing. The two-step clustering algorithm is considered to be one of the most widely used clustering algorithm which can effectively estimate the mixed attribute of data and automatically determine the number of clusters in the modelling framework. First, a group of leaf nodes and their cluster feature (CF) are recorded in CF-tree as the initialization of the total cluster number and cluster characteristics on the basis of theory of CF-tree in balanced iterative reducing and clustering using hierarchies (BIRCH) (Zhang et al., 1996). Second, Bayes information criterion (BIC) is used to determine the appropriate number of clusters (de Campos et al., 2018). Third, according to the principle of agglomerative clustering, the nearest two clusters are chose to decrease the number of clusters and then the exact number of clusters can be obtained. Finally, the data points are assigned sequentially to the closest cluster based on the log-likelihood distance criterion. The results of cluster are shown in Table 1. Compared with the existing researches, the prominent feature of this study in the data is that it closely focuses on the characteristics of the elderly. In addition, data for each indicator are broken down into applicable units. Such fine classification can not only avoid the coupling between principal components, but also make the data more realistic.
Table 1.
Description of variable characteristics in different clustering
| Variables | Description | Sign | Sample (proportion) | |
|---|---|---|---|---|
| Cluster 1 | Cluster 2 | |||
| Individual | ||||
| Age | 60–69a | AGE_ 1 | 139 (0.602) | 239 (0.637) |
| 70–79 | AGE_ 2 | 72 (0.312) | 109 (0.291) | |
| ≥ 80 | AGE_ 3 | 20 (0.087) | 27 (0.072) | |
| Gender | Male | GEN | 112 (0.485) | 178 (0.475) |
| Female | 119 (0.515) | 197 (0.525) | ||
| Education level | Middle school or lowera | EDU_ 1 | 122 (0.528) | 191 (0.509) |
| High school | EDU_ 2 | 62 (0.268) | 121 (0.323) | |
| College or higher | EDU_ 3 | 47 (0.203) | 63 (0.168) | |
| Income level | ≤ 30,000 RMB/yeara | AIN_ 1 | 52 (0.225) | 64 (0.171) |
| 40,000–70,000 RMB/year | AIN_ 2 | 105 (0.455) | 192 (0.512) | |
| ≥ 70,000 RMB/year | AIN_ 3 | 74 (0.320) | 119 (0.317) | |
| Free buses card | Having access to free buses | FBC | 177 (0.676) | 288 (0.768) |
| Household | ||||
| Household type | The same generations cohabita | HTY_ 1 | 47 (0.203) | 88 (0.235) |
| The two generations cohabit | HTY_ 2 | 108 (0.468) | 190 (0.507) | |
| The three generations cohabit | HTY_ 3 | 76 (0.329) | 97 (0.259) | |
| Car availability | Having access to a car | CAV | 46 (0.199) | 76 (0.203) |
| EPS availability | Having access to an EES | EAV | 42 (0.182) | 51 (0.136) |
| Bicycle availability | Having access to a bicycle | BAV | 92 (0.398) | 126 (0.336) |
| Trip | ||||
| Trip distance | Single trip distance (km) | TRD | 5.147 (2.335)c | 6.519 (1.845)c |
| Trip time | Single trip time (min) | TRT | 47.817 (17.511)c | 62.465 (20.372)c |
| Trip purpose | Shopping & picking up children | PUR_ 1 | 121 (0.209) | 239 (0.369) |
| Leisure & Sporting | PUR_ 2 | 254 (0.439) | 232 (0.358) | |
| Others | PUR_ 3 | 203 (0.351) | 177 (0.273) | |
| House location | Core areasb | 104 (0.450) | 375 (1.000) | |
| Others | 127 (0.550) | 0 (0.000) | ||
| Total cluster membership | 231 (0.381) | 375 (0.619) | ||
| Total number of tours | 578 (0.471) | 648 (0.529) | ||
| Average number of tours per people per day | 2.502 | 1.728 | ||
areference group in modelling, bcore areas refer to Dongcheng district and Xicheng district, cthe number indicates the mean (standard deviation)
In Table 1, Cluster 1 and Cluster 2 represent the central urban areas and the non-central urban areas, respectively. The elderly belonging to Cluster 1 comprises all the elderly located in core areas and a small part of the elderly located in non-core areas. Their house location mainly locate in and around the core areas. All the elderly in Cluster 2 come from non-core areas. Their house locations are far away from the core areas in comparison with the elder people in Cluster 1. The travel purpose of many elderly in cluster 1 is leisure or sporting. They have less trip distance and trip time in comparison to the elder people in Cluster 2. However, there are the high proportion of bicycle and EPS ownership. The elderly in Cluster 2 prefer longer trip distance and trip time in single trip. Meanwhile, their travel purposes are mainly shopping and picking up children. Moreover, the proportion of individual attributes in two cluster is similar. For example, in the two clusters, the elderly aged 60–69 are the most, while the number of women is more than that of men. In addition, the education level is relatively low and the income structure ratio is about 0.2, 0.5 and 0.3.
Travel behaviours information on both central urban areas and non-central urban areas is extracted on the basis of cluster result. In this research, travel behaviours include travel mode and trip chains. Trip chains refer to the combination of a series of trips with house location as the starting point and ending point, including one or more midway activities (Ariane et al., 2021; Daisy et al., 2018). According to the number of midway activity sites, it can be divided into simple trip chains and complex ones. Travel modes collected in this survey are composed of walking, bicycle, electric bicycle, EPS, public transit and car. It is generally believed that walk is the most important travel mode for the elderly, while it is strange to travel by car, in China. The data of the elderly travelling by car are omitted due to less observed sample. Public transit in the research consists of bus and subway. Compared with bus, subway is uncommon for the elderly in the survey. Though the difference exists among bicycle, electric bicycle and EPS, these three modes are similar in the use of road space and the cause of traffic accidents. Therefore, the three modes are integrated into the cycling mode in the modelling. Finally, the travel behaviours of the elder are comprised of two trip chains and three travel modes in this research. From an overall perspective, the proportion of travel behaviours on central urban areas and non-central urban areas are shown in Table 2. The detailed results for the central and non-central urban areas will be compared and analysed in Sect. 4.2.
Table 2.
Statistics of travel behaviours
| Areas | Travel behaviours (%) | ||||
|---|---|---|---|---|---|
| Walking | Cycling | Public transit | Simple trip chains | Complex trip chains | |
| Central urban areas | 50.347% | 27.778% | 21.875% | 70.139% | 29.861% |
| Non-central urban areas | 51.485% | 25.083% | 23.432% | 63.696% | 36.304% |
Modelling work
In this research, the NL model is adopted to determine the decision processes of travel behaviours among the elderly with different locations. The model is supposed to be a simple and effective method to determine the decision processes of travellers (Yang et al., 2016). Compared to co-evolutionary logit model and structural equation model (SEM) (Li et al., 2013; Subbarao et al., 2020), the NL model has the advantages of less sample sizes, low error rate, simple technical requirements and straightforward performance. On the basis of the hypothesis of decision processes, the NL model with diverse nesting forms is developed. By comparing the scores of goodness-of-fit (GOF), the model with the optimal nesting form can be determined.
Model establishment
In the NL model, the choice set consists of two subsets, that is, travel mode and trip chains. Explicitly, the former subset is made up of walking, cycling and public transit, while the latter is composed of single trip chains and complex trip chains. Based on the hypothesis of decision processes, two nesting forms of the NL model are developed as described in Fig. 2. One represents the decision processes of trip chains earlier than travel mode, and another stands for the decision processes of travel mode earlier than trip chains. In order to simplify the following expression, Model 1 is used to represent that the decision processes of the elderly in central urban areas are trip chains earlier than travel mode, while Model 2 is adopted to express that the decision processes of the elderly in central urban areas is travel mode earlier than trip chains. Similarly, Model 1' and Model 2' are used to stand for the two decision processes of the elderly in non-central urban areas, respectively. In addition, the simple trip chains and the walking mode are used as a based group in the NL model.
Fig. 2.
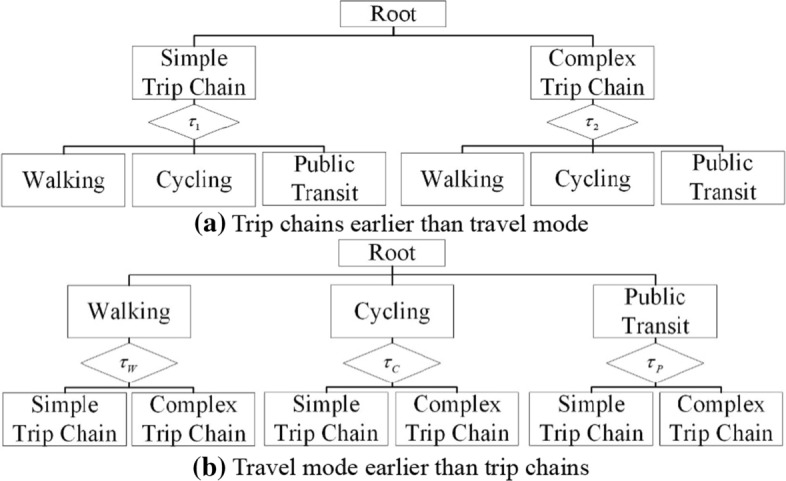
Two nesting forms for the elderly
In the NL model, the scale parameter is adopted to analyse the correlation among the alternatives in the same nest (Bierlaire, 2006). If the scale parameter does not range from 0 to 1, the NL model will break down, as it satisfies the independent of irrelevant alternatives property (IIA). In such an instance, the NL model cannot be applied to explain the decision processes of travellers. If the scale parameter is kept within reasonable bounds, the correlation among the alternatives in the nest increases as the scale parameter decreases. In this situation, the NL model can be used to describe the decision processes of travellers. Consequently, the scale parameter is adapted as a standard of GOF in the NL model (Qin et al., 2017; Yang et al., 2016).
Except for the scale parameter, the Akaike information criterion (AIC) and Bayesian information criterion (BIC) are considered to measure the GOF of the NL model on the basis of the concept of entropy. But differ in the AIC, the BIC takes the number of data into account. If the amount of data is large, it can effectively prevent the accuracy of the model from being too high. Generally, a smaller AIC or BIC demonstrates a better statistical performance (Kim et al., 2017; Zhou et al., 2020).
According to random utility modelling framework, utility can be shown as the total of a measured component and a stochastic component as Eq. (1) (Yang et al., 2016).
| 1 |
Suppose there are nests in the level 1 and there are alternatives in the level 2, if the linear function is used to express the measured component , then utility of traveller choosing the nest and alternative can be shown in the study as Eq. (2) (Feng, 2017).
| 2 |
where is the -th variable of nest and alternative , is the corresponding coefficient of variable , is the -th variable of nest , is the corresponding coefficient of variable . Referring to previous study, the measured utilities for each of the alternative are a function of the individual attributes, household attributes and travel-related attributes, as present in Table 1.
Let represent the random error from all unobserved factors, and each of obeys generalized extreme value (GEV) distribution. Based on the GEV theory, the probability that traveller chooses the nest and the alternative can be expressed as Eq. (3) (Zhang et al., 2019).
| 3 |
where is the probability of traveller choosing nest , is the conditional probability of traveller choosing alternative on nest being chosen, is the scale parameter to obtain the correlation among alternatives in the nest , and is defined as log-sum and can be expressed in the NL model as Eq. (4) (Zhang et al., 2019).
| 4 |
The maximum likelihood method is used to estimate the all unknown parameters including the scale parameter in the nest , the corresponding coefficient of variable and the corresponding coefficient of variable (Yang et al., 2016).
According to the above formulas, the key parameters will be calculated one by one. It is worth noting that the error of each parameter cannot be analysed individually. The data and results for each part will be strictly matched to the overall model. Subsequent calculation results will be calculated in the model and scene.
Model estimation
As described, Table 1 is the description of variable characteristics in different clusters. Moreover, Table 2 is the statistics of travel behaviours. These data results describe the difference between central and non-central urban areas from an overall perspective. In order to compare the two more concretely, the matching models need to be established for numerical calculation.
For central urban areas
In order to understand the decision processes of the elderly in central urban areas, two NL models with diverse nesting forms are estimated and the results are displayed in Table 3. As shown in Table 3, the Wald test with a significant number demonstrates a good GOF of Model 2. Moreover, both the AIC and the BIC in Model 1 are higher than those in Model 2. This indicates that the nesting form of Model 2 is more suitable for the empirical data than that of Model 1. Most importantly, the scale parameter of Model 1 is not within the 0–1 range, meaning that the nesting form of Model 1 is unreasonable. The results show that the elderly in central urban areas are inclined to decide travel mode in advanced of determining the trip chains. Moreover, the scale parameter is smaller than other scale parameters, indicating that the elderly in central urban areas have a higher dependency on public transit than other travel modes.
Table 3.
NL mode estimates for central urban areas
| Variables | Model 1: complex trip chains | Model 2: cycling | Model 2: public transit | ||||||
|---|---|---|---|---|---|---|---|---|---|
| Coeff | z | P | Coeff | z | P | Coeff | z | P | |
| Individual | |||||||||
| AGE_ 2 | 0.294 | 0.570 | 0.568 | − 0.158 | − 0.370 | 0.711 | − 0.894 | − 1.850 | 0.064 |
| AGE_ 3 | − 0.071 | − 0.220 | 0.828 | − 1.314 | − 1.930 | 0.054 | − 1.520 | − 2.030 | 0.042 |
| GEN | − 0.346 | − 0.960 | 0.338 | 0.682 | 1.580 | 0.113 | − 0.557 | − 1.250 | 0.212 |
| EDU_ 2 | − 0.486 | − 1.730 | 0.084 | 0.348 | 1.120 | 0.262 | 0.441 | 1.380 | 0.167 |
| EDU_ 3 | − 0.581 | − 1.780 | 0.075 | − 0.045 | − 0.090 | 0.930 | 2.063 | 2.750 | 0.006 |
| AIN_ 2 | 0.284 | 0.510 | 0.608 | − 0.161 | − 0.380 | 0.701 | 0.513 | 1.180 | 0.240 |
| AIN_ 3 | 0.349 | 0.640 | 0.520 | − 0.155 | − 0.310 | 0.755 | − 1.705 | − 2.980 | 0.003 |
| FBC | 0.480 | 0.440 | 0.662 | − 0.330 | − 1.000 | 0.316 | 1.222 | 3.160 | 0.002 |
| Household | |||||||||
| HTY_ 2 | 0.159 | 0.640 | 0.521 | − 0.383 | − 0.840 | 0.403 | − 1.704 | − 3.230 | 0.001 |
| HTY_ 3 | − 0.258 | − 0.950 | 0.342 | 0.177 | 0.340 | 0.731 | 1.849 | 2.500 | 0.012 |
| CAV | 0.296 | 1.190 | 0.232 | − 0.098 | − 0.280 | 0.780 | − 0.405 | − 1.060 | 0.289 |
| EAV | 0.067 | 0.180 | 0.853 | 0.067 | 0.250 | 0.806 | − 0.585 | − 2.050 | 0.040 |
| BAV | 0.109 | 0.380 | 0.701 | 0.568 | 1.890 | 0.059 | − 0.060 | − 0.180 | 0.854 |
| Trip | |||||||||
| TRD | 0.011 | 1.050 | 0.294 | − 0.019 | − 7.020 | 0.000 | − 0.027 | − 7.890 | 0.000 |
| TRT | 0.008 | 1.200 | 0.230 | − 0.009 | − 2.190 | 0.029 | − 0.015 | − 3.040 | 0.002 |
| PUR_ 1 | 0.684 | 2.430 | 0.015 | 0.321 | 1.130 | 0.257 | 0.390 | 1.280 | 0.199 |
| PUR_ 2 | 0.014 | 0.040 | 0.972 | − 0.281 | − 0.820 | 0.413 | − 0.227 | − 0.620 | 0.532 |
| Scale parameter | |||||||||
| Wald | 19.960 | P = 0.276 | 235.710 | P = 0.000 | |||||
| AIC | 1955.980 | 1855.239 | |||||||
| BIC | 2103.529 | 2113.450 | |||||||
Bold numbers represent significant at the 10.000% level, Coeff. represents the estimation coefficient of the model
Looking first at the individual attributes in Model 2, the age has a negative association with the travel mode. That is, the probabilities of cycling and public transit for the elderly decrease as the age increases. The positive sign of education level parameter shows the elderly with an education at college are more prone to choose the bus than other elderly. The high income shows negative association with the public transit mode. The positive number of free buses card indicates that the elderly with a free bus card are greater prone to choose the public transit than others. From the horizontal comparison of the three models, the significance indices of different indicators have obvious marginal distribution characteristics. This is clearly different from the results of existing research. There are both facilitation and constraints between different models. From the perspective of multiple regression, the overall credibility of the significant results is strong.
The opposite sign is shown in different household size. The elderly from the household size of the two generations cohabit are less likely to choose the mode of public transit, while the elderly from the household size of the three generations cohabit are more likely for it. Due to impacts of corona virus disease 19 (COVID-19), the elderly from the household size of the two generations cohabit are less likely to choose the bus of high population density. However, the elderly from the three generations cohabit have to face more travel purposes, such as shopping for their families and picking up their grandchildren. In this case, the bus mode can be more convenient for the above purpose.
The access to bicycle has a positive effect on the choice of cycling, and the access to EPS has a negative effect on the choice of public transit. It means that a transportation tool has a highly probability to be used if the elderly have access. Therefore, the elderly with bicycles are more likely to choose the cycling mode and the elderly with EPS are less probability to choose the public transit mode. Finally, the coefficient of trip distance and trip time is also significant for the travel mode choice of the elderly.
For non-central urban areas
To make the decision order of the elderly in non-central urban areas clear, the results of two NL models with diverse nesting forms are calculated and the results are shown in Table 4. Comparing the values of Wald, AIC and BIC, the better-fitting model is Model 1' which nests the trip chains earlier than travel mode. Model 2' has the scale parameters less than zero, making this nesting form intolerable. The results show that the elderly in non-central urban areas prefer to choose trip chains pattern first. After that, they would take the choice on travel mode.
Table 4.
NL mode estimates for non-central urban areas
| Variables | Model 1': complex trip chains | Model 2': cycling | Model 2': public transit | ||||||
|---|---|---|---|---|---|---|---|---|---|
| Coeff | z | P | Coeff | z | P | Coeff | z | P | |
| Individual | |||||||||
| AGE_ 2 | − 0.066 | − 0.380 | 0.704 | 0.136 | 0.360 | 0.718 | − 0.063 | − 0.160 | 0.876 |
| AGE_ 3 | − 0.750 | − 2.260 | 0.024 | − 0.541 | − 1.570 | 0.117 | − 0.096 | − 0.260 | 0.794 |
| GEN | − 0.347 | − 1.530 | 0.127 | − 0.002 | − 0.010 | 0.992 | − 0.400 | − 1.860 | 0.063 |
| EDU_ 2 | − 0.216 | − 0.820 | 0.415 | 0.039 | 0.160 | 0.870 | 0.284 | 1.110 | 0.267 |
| EDU_ 3 | − 0.050 | − 0.230 | 0.820 | − 0.322 | − 1.250 | 0.211 | − 0.095 | − 0.350 | 0.729 |
| AIN_ 2 | 0.093 | 0.440 | 0.659 | − 0.290 | − 1.160 | 0.248 | − 0.042 | − 0.160 | 0.875 |
| AIN_ 3 | − 0.484 | − 2.390 | 0.017 | − 0.029 | − 0.100 | 0.921 | 0.150 | 0.480 | 0.634 |
| FBC | 0.752 | 3.320 | 0.001 | − 0.014 | − 0.040 | 0.968 | 0.163 | 0.430 | 0.665 |
| Household | |||||||||
| HTY_ 2 | − 0.270 | − 1.210 | 0.226 | 0.090 | 0.230 | 0.821 | 0.222 | 0.510 | 0.613 |
| HTY_ 3 | 0.517 | 2.090 | 0.036 | − 0.141 | − 0.220 | 0.825 | 0.529 | 0.860 | 0.389 |
| CAV | 0.019 | 0.970 | 0.330 | − 0.353 | − 1.060 | 0.287 | − 0.117 | − 0.320 | 0.748 |
| EAV | 0.810 | 3.520 | 0.000 | 0.082 | 0.380 | 0.701 | 0.078 | 0.350 | 0.726 |
| BAV | 0.003 | 0.860 | 0.388 | − 0.387 | − 0.870 | 0.385 | − 0.360 | − 0.710 | 0.478 |
| Trip | |||||||||
| TRD | − 0.005 | − 2.020 | 0.044 | − 0.003 | − 0.180 | 0.855 | − 0.003 | − 0.180 | 0.855 |
| TRT | − 0.012 | − 2.450 | 0.014 | 0.006 | 0.040 | 0.967 | 0.006 | 0.040 | 0.967 |
| PUR_ 1 | 0.565 | 2.620 | 0.009 | 0.213 | 0.630 | 0.529 | − 0.293 | − 0.710 | 0.480 |
| PUR_ 2 | − 0.338 | − 1.120 | 0.262 | − 0.234 | − 0.330 | 0.739 | 1.311 | 2.610 | 0.009 |
| Scale parameter | |||||||||
| Wald | 41.300 | P = 0.000 | 28.300 | P = 0.654 | |||||
| AIC | 2094.941 | 2149.682 | |||||||
| BIC | 2243.708 | 2397.627 | |||||||
Bold numbers represent significant at the 10.000% level, Coeff. represents the estimation coefficient of the model
Regarding individual attributes in Model 1', the coefficients of age are negative, implying that the elderly aged ≥ 80 are less likely to choose the complex trip chains. The reason is that the physical ability decline inhibits the elderly to combine more activities in a trip. The negative sign of income level indicates that the elderly with high-income have a lower probability to take a complex trip chains than the others. The positive number of free buses card demonstrates that there is a high possibility that buses will be adopted as the travel model if the elderly have the access to free buses. In each model, the key parameters and the significance index are generally consistent in the result trend. Individual results have prominent “variation” characteristics. This does not violate the actual situation. When the weight of the indicator becomes larger, a small error in the data can lead to a significant deviation of the results.
As expected, the positive effect of household type is found, which implies the elderly from household with the multi-generations are more likely to choose the complex trip chains. This is because these ones often need to take their grandchildren to school. Moreover, they will buy daily necessities for their families. In this case, the complex trip chains is common. Moreover, the elderly with EPS are more inclined to choose the complex trip chains than the others.
Both trip distance and trip time have a negative value in connection with the complex trip chains. It can also be explained that the elderly are not willing to choose multiple travel purposes in a long-distance trip due to the decline in physical ability. The coefficient of trip purpose is rather significant, indicating the complex trip chains are more likely to be adopted for trip purposes related to shopping and picking up children. The reason is similar to the household one.
Scenario analysis
It is acknowledged that the many policies on constructing an age-friendly society in Beijing. The policies include free buses, restriction on EPS and income improvement. They have been implemented to accomplish an inclusive, safe and healthy living environment for the elderly. However, a lot of efforts still need to be considered in these policies. Therefore, the changes of travel behaviours of the elderly in the study areas of Beijing are analysed as examples here by the proposed method for different policies.
Free buses
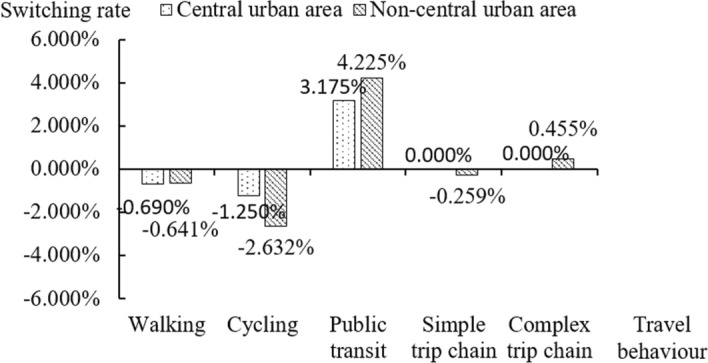
Buses play an important role in the motorized travel of the elderly. Furthermore, free buses are able to improve the welfare for the elderly (Mah & Mitra, 2017; Zhang et al., 2019). Thus, it is rather meaningful to estimate the effectiveness of free buses. It can also provide some opinions to establish a preferable travel environment for the elderly after implementing the free buses. This study assumes that all the elderly have free bus cards. The effect of free buses on the travel behaviours of the elderly in different locations is predicted using the two NL models above. The change of travel behaviours under free buses is shown in Fig. 3.
Fig. 3.
Switching of travel behaviours owing to free bus
For central urban areas, the free bus policy will increase the number of people on public transport by about 3%. For non-central urban areas, the result is about 4%. Influenced by China’s traditional cost values, such free fees make the elderly significantly inclined to choose public transportation. For non-central urban areas, the elderly travel a relatively long distance, and their willingness to choose walking and cycling is weaker. As a result, the elderly in this category are more motivated by the free bus policy.
As shown in Fig. 3, for central urban areas, free buses mainly affect the choice of travel mode of the elderly, rather than the choice of trip chains. However, for non-central urban areas, this policy simultaneously impacts the choice of travel mode and trip chains of the elderly. From the perspective of travel mode, free buses have an impact on increasing the elderly to public transit. Meanwhile, it decreases the elderly to travel by walking and cycling. Moreover, the change of travel mode of the elderly in central urban areas is greater than that in non-central urban areas.
Restrictions on EPS
In recent years, the EPS has gradually become an important travel mode for the elderly in Beijing owing to convenient to driving, easy to parking and lack of relevant policy restriction, which brings severe challenges to urban road traffic safety. At present, Beijing Traffic Management Bureau is working out rules to strengthen the management of the EPS. Assuming the restrictions on all the illegal EPS, this study predicts the travel behaviours of the elderly in different locations using the two NL models above. The change of travel behaviours of the elder people under restrictions on EPS is displayed in Fig. 4.
Fig. 4.
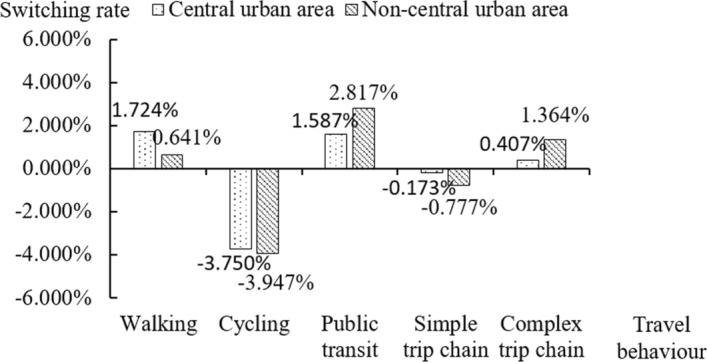
Switching of travel behaviours due to restrictions on EPS
Figure 4 indicates that for central urban areas, the application of the restrictions on EPS is able to significantly change the choice of travel mode of the elderly. Moreover, its effect on changing the choice of trip chains of the elderly is comparatively weak. However, for non-central urban areas, the change of the choice of travel mode and trip chains of the elderly both are found on account of the policy. From the travel mode standpoint, the policy leads some of the elderly to abandon travel by cycling. After giving up cycling, the elderly are obviously likely to travel by walking in central urban areas. Meanwhile, some trend to travel by public transit.
Income improvement
In order to improve the living quality of the elderly, the government department has implemented a series of related policies in China, such as increasing the basic pension and providing the allowance for the high-aged. At present, in Table 1, the ratio of income class of the elderly is approximately 0.2, 0.5 and 0.3 where the numbers represent the share of the low-income, mid-income and high-income in the elderly, respectively. Assuming four different income improvement policies of the elderly in the future, this study predicts the travel behaviours of the elderly under different income class using the two NL models above. The change of travel behaviours of the elder people under different income improvements is shown in Fig. 5.
Fig. 5.

Switching of travel behaviours owing to income improvement
How the travel behaviours of the elderly switch owing to income improvement is shown in Fig. 5. In central urban areas, a tiny change of trip chains is observed at the ratio of income class of 0.0, 0.5 and 0.5. In non-central urban areas, the choice proportion of trip chains first switches from complex trip chains to simple trip chains. When the ratio of high-income group increases, the choice proportion of trip chains switches from the simple trip chains to complex ones. From the standpoint of travel modes, it is straightforward that for either central urban areas or non-central urban areas, as income improves, the number of the elderly to travel by walking increases, while the amount of the elderly to travel by cycling decreases. This is not unusual for cultural reasons. In China, when the income of the elderly increases, they are more willing to pursue a leisurely slower pace of life. Therefore, they prefer to choose walking rather than cycling. Another observation from Fig. 5 is that in central urban areas, the number of the elderly to travel by public transit first ascends and then descends owing to income improvement. In non-central urban areas, when the ratio of low-income group decreases, the number of the elderly to travel by public transit keeps constant. However, when the ratio of high-income group increases, the number of the elderly travelling by public transit decreases.
Conclusions
Based on the data from the travel survey of the elderly in Beijing, two NL models with diverse nesting forms are established to investigate the travel decision processes of the elderly in central urban areas and non-central urban areas. We try to forecast the change of their travel behaviours by implementing the policy of age-friendly society. The results demonstrate that there are four findings between central urban areas and non-central urban areas. First, the elderly in central urban areas are inclined to decide travel modes in advanced of determining the trip chains, while trip chains are first determined in non-central urban areas. Second, the application of free buses induces the number of the elderly to travel by public transit. Meanwhile, the percentage of trip chains switching from simple to complex is observed in non-central urban areas. Third, the elderly are more likely to travel by walking and public transit because of restrictions on EPS. And the percentage of trip chains switching from simple to complex is also predicted in non-central urban areas. Fourth, in central urban areas, the choice probability of travelling by public transit increases with the improvement of mid-income, while the relationship becomes inverse when the high-income group is increasing. In addition, there is a similar relationship between the trip chains and the income improvement in non-central urban areas.
The novelty of this study is reflected in the content, data, methods and conclusions. First, we present an original comprehensive analysis of the mobility challenges of urban elderly. Secondly, in the collected data on the elderly, the indicators are accurate and representative. Third, we integrate the application of parallel clustering with the NL model to obtain precise computational results. Finally, this study yields valuable insights into the travel analysis of the elderly, which can be used to support government policymaking.
In order to achieve an age-friendly travel environment, it is necessary to consider certain helpful measures. Some supplementary opinions can be derived from this research. It is meaningful to establish a friendly neighbourhood to meet the walking needs of the elderly. The commercial, medical and entertainment facilities are reasonably planned and constructed near the residential areas, especially in non-central urban areas. In addition, it is necessary to enrich the diversity of public transport service to meet the needs of the elderly to travel by public transit. For example, in central urban areas, some measures can be taken as reference, such as increasing the special buses for the elderly and providing micro-circulation bus to meet the travel needs of the elderly. These services contribute to ensure the travel safety and comfort. In non-central urban areas, we can consider providing some bus loops to meet the long-distance and multi-purpose travel for the elderly. The research results are helpful to understand the travel behaviours of the elderly in China. It also provides valuable reference for urban management departments to build an age-friendly society. Finally, the data of this research are collected during the period of COVID-19. This study can offer comprehensive information for understanding the current travel behaviours of the elderly.
As described in the literature review, the salient implications of this paper are the following: (1) the first survey of elderly travel in China since the popularity of COVID-19; (2) the travel decision process of elderly people in central and non-central urban areas; (3) the study of the relationship between social policies and travel habits of ageing in China; and (4) the multi-category differences in travel between elderly people in central and non-central urban areas. However, with the improvement of the epidemic situation, it is necessary to validate this modelling results. Moreover, we should clearly compare the travel behaviours of elder people in central urban areas and non-central urban areas. This condition is an important future research work. This study can also be combined with panel data methods for multiple regression calibration. This can try to ensure the accuracy of the results. In addition, data-driven deep learning methods can be used in the travel analysis of the elderly. Also, more seasonal factors can be studied comprehensively.
Acknowledgements
This study is supported by the National Natural Science Foundation of China [Grant Number 71571011].
Footnotes
Publisher's Note
Springer Nature remains neutral with regard to jurisdictional claims in published maps and institutional affiliations.
References
- Ariane S, Connors R, Vitia F. Trip chaining impact on within-day mode choice dynamics: Evidences from a multi-day travel survey. Transportation Research Procedia. 2021;52:684–691. doi: 10.1016/j.trpro.2021.01.082. [DOI] [Google Scholar]
- Bierlaire M. A theoretical analysis of the cross-nested logit model. Annals of Operations Research. 2006;144:287–300. doi: 10.1007/s10479-006-0015-x. [DOI] [Google Scholar]
- Cheng L, Bi X, Chen X, Li L. Travel behavior of the urban low-income in China: Case study of Huzhou city. Procedia Social and Behavioral Sciences. 2013;96:231–242. doi: 10.1016/j.sbspro.2013.08.030. [DOI] [Google Scholar]
- Daisy NS, Millward H, Liu L. Trip chaining and tour mode choice of non-workers grouped by daily activity patterns. Journal of Transport Geography. 2018;69:150–162. doi: 10.1016/j.jtrangeo.2018.04.016. [DOI] [Google Scholar]
- de Campos CP, Scanagatta M, Corani G, Zaffalon M. Entropy-based pruning for learning Bayesian networks using BIC. Artificial Intelligence. 2018;260:42–50. doi: 10.1016/j.artint.2018.04.002. [DOI] [Google Scholar]
- Feng J. The influence of built environment on travel behavior of the elderly in urban China. Transportation Research Part d: Transport and Environment. 2017;52:619–633. doi: 10.1016/j.trd.2016.11.003. [DOI] [Google Scholar]
- Golob TF, Hensher DA. The trip chaining activity of sydney residents: A cross-section assessment by age group with a focus on seniors. Journal of Transport Geography. 2007;15(4):298–312. doi: 10.1016/j.jtrangeo.2006.09.005. [DOI] [Google Scholar]
- Hensher DA, Reyes AJ. Trip chaining as a barrier to the propensity to use public transport. Transportation. 2000;27(4):341–361. doi: 10.1023/A:1005246916731. [DOI] [Google Scholar]
- Islam MT, Habib KMN. Unraveling the relationship between trip chaining and mode choice: Evidence from a multi-week travel diary. Transportation Planning and Technology. 2012;35(4):409–426. doi: 10.1080/03081060.2012.680812. [DOI] [Google Scholar]
- Kim H-C, Alan N, Kusumastuti D. Analysing freight shippers’ mode choice preference heterogeneity using latent class modelling. Transportation Research Procedia. 2017;25:1109–1125. doi: 10.1016/j.trpro.2017.05.123. [DOI] [Google Scholar]
- Kitamura R, Susilo YO. Is travel demand insatiable? A study of changes in structural relationships underlying travel. Transportmetrica. 2005;1(1):23–45. doi: 10.1080/18128600508685640. [DOI] [Google Scholar]
- Krygsman S, Arentze T, Timmermans H. Capturing tour mode and activity choice interdependencies: A co-evolutionary logit modelling approach. Transportation Research Part a: Policy and Practice. 2007;41(10):913–933. doi: 10.1016/j.tra.2006.03.006. [DOI] [Google Scholar]
- Li Z, Wang W, Yang C, Jiang G. Exploring the causal relationship between bicycle choice and trip chain pattern. Transport Policy. 2013;29:170–177. doi: 10.1016/j.tranpol.2013.06.001. [DOI] [Google Scholar]
- Mackett R. Has the policy of concessionary bus travel for older people in Britain been successful? Case Studies on Transport Policy. 2014;2(2):81–88. doi: 10.1016/j.cstp.2014.05.001. [DOI] [Google Scholar]
- Mah S, Mitra R. The effects of a free bus program on older adults travel behaviour: A case study of a Canadian suburban municipality. Case Studies on Transport Policy. 2017;5(3):460–466. doi: 10.1016/j.cstp.2017.05.003. [DOI] [Google Scholar]
- Petterssona P, Schmöckerb J-D. Active ageing in developing countries?—Trip generation and tour complexity of older people in Metro Manila. Journal of Transport Geography. 2010;18(5):613–623. doi: 10.1016/j.jtrangeo.2010.03.015. [DOI] [Google Scholar]
- Qin H, Gao J, Zhang G, Chen Y, Wu S. Nested logit model formation to analyze airport parking behavior based on stated preference survey studies. Journal of Air Transport Management. 2017;58:164–175. doi: 10.1016/j.jairtraman.2016.10.011. [DOI] [Google Scholar]
- Rafiq R, McNally MG. An empirical analysis and policy implications of work tours utilizing public transit. Transportation Research Part a: Policy and Practice. 2020;142:237–259. doi: 10.1016/j.tra.2020.10.018. [DOI] [Google Scholar]
- Su F, Bell MGH. Transport for older people: Characteristics and solutions. Research in Transportation Economics. 2009;25(1):46–55. doi: 10.1016/j.retrec.2009.08.006. [DOI] [Google Scholar]
- Subbarao SSV, Swaroop SNV, Shekhar RS. Interrelationships between mode choice and trip-chain choice decisions: A case of Mumbai metropolitan region. Transportation Research Procedia. 2020;48:3049–3061. doi: 10.1016/j.trpro.2020.08.182. [DOI] [Google Scholar]
- Susilo YO, Kitamura R. Structural changes in commuters’ daily travel: The case of auto and transit commuters in the Osaka metropolitan area of Japan, 1980–2000. Transportation Research Part a: Policy and Practice. 2008;42(1):95–115. doi: 10.1016/j.tra.2007.06.009. [DOI] [Google Scholar]
- Tao Y, Shen Y. Spatial difference of medical facility accessibility and influencing factors: A comparative study of registered and floating populations in Shanghai. Progress in Geography. 2018;37(8):1075–1085. [Google Scholar]
- van den Berg P, Arentze T, Timmermans H. Estimating social travel demand of senior citizens in the Netherlands. Journal of Transport Geography. 2011;19(2):323–331. doi: 10.1016/j.jtrangeo.2010.03.018. [DOI] [Google Scholar]
- Wen C-H, Koppelman FS. A conceptual and methdological framework for the generation of activity-travel patterns. Transportation. 2000;27(1):5–23. doi: 10.1023/A:1005234603206. [DOI] [Google Scholar]
- Winters M, Voss C, Ashe MC, Gutteridge K, McKay H, Sims-Gould J. Where do they go and how do they get there? Older adults' travel behaviour in a highly walkable environment. Social Science & Medicine. 2015;133:304–312. doi: 10.1016/j.socscimed.2014.07.006. [DOI] [PubMed] [Google Scholar]
- Yang L, Shen Q, Li Z. Comparing travel mode and trip chain choices between holidays and weekdays. Transportation Research Part a: Policy and Practice. 2016;91:273–285. doi: 10.1016/j.tra.2016.07.001. [DOI] [Google Scholar]
- Zhang T, Ramakrishnan R, Livny M. BIRCH: An efficient data clustering method for very large databases. ACM Sigmod Record. 1996;15(2):103–114. doi: 10.1145/235968.233324. [DOI] [Google Scholar]
- Zhang Y, Yao E, Zhang R, Xu H. Analysis of elderly people's travel behaviours during the morning peak hours in the context of the free bus programme in Beijing, China. Journal of Transport Geography. 2019;76:191–199. doi: 10.1016/j.jtrangeo.2019.04.002. [DOI] [Google Scholar]
- Zhang Z, Mao B, Liu M, Chen J, Guo J. Analysis of travel characteristics of elders in Beijing. Journal of Transportation Systems Engineering and Information Technology. 2007;7(6):11–20. doi: 10.1016/S1570-6672(08)60001-X. [DOI] [Google Scholar]
- Zhou H, Norman R, Xia JC, Hughes B, Kelobonye K, Nikolova G, Falkmer T. Analysing travel mode and airline choice using latent class modelling: A case study in Western Australia. Transportation Research Part a: Policy and Practice. 2020;137:187–205. doi: 10.1016/j.tra.2020.04.020. [DOI] [Google Scholar]