Abstract
Medical databases usually contain a significant volume of images, therefore search engines based on low-level features frequently used to retrieve similar images are necessary for a fast operation. Color, texture, and shape are the most common features used to characterize an image, however extracting the proper features for image retrievals in a similar manner with the human cognition remains a constant challenge. These algorithms work by sorting the images based on a similarity index that defines how different two or more images are, and histograms are one of the most employed methods for image comparison. In this paper, we have extended the concept of image database to the set of frames acquired following wireless capsule endoscopy (from a unique patient). Then, we have used color and texture histograms to identify very similar images (considered duplicates) and removed one of them for each pair of two successive frames. The volume reduction represented an average of 20% from the initial data set, only by removing frames with very similar informational content.
Keywords: Image similarity, Histograms, Wireless capsule endoscopy, Image analysis
Introduction
Medical imaging is essential in clinical and scientific research; it has a great value in diagnosis and differential diagnosis, representing an important basis for treatment and survival improvement. Due to the recent progress in the technological field, the volume of informational visual content is significant, and presents an almost continuous increasing trend [1].
Medical databases may contain hundreds of thousands of images, therefore the need for image retrieval methods is more than obvious. The generic Content-Based Image Retrieval (CBIR) process provides a framework allowing a search engine for images, generally based on low-level features frequently used to retrieve similar images from the image databases (like color [2], texture [3,4], or shape [5,6,7]).
The common element in all image retrieval processes resides in sorting the images which present a high level of similarity with regard to the visual appearance.
Multiple studies in the medical field demonstrated that CBIR and similarity analysis prove to be very useful in clinical diagnosis [8,9,10,11].
Medical databases may be viewed from several different perspectives: an ensemble of annotated medical images presenting either various medical aspects, or the same anatomical element or disease, with images belonging to different patients (e.g. following dental orthopantomography, mammography, etc.). However, the concept of medical database may be extended to the collection of images belonging to a single patient when he/she was subject to an “image-rich” medical investigation. Since feature extraction is commonly associated to the color space [12,13], a proper example of single-patient database may be represented by an image collection acquired following the wireless capsule endoscopy (WCE). This procedure is now a consecrated method for the investigation of the small bowel, being the only one that defines an almost complete perspective of the inner intestinal walls and potential lesions [14,15,16,17].
Starting with the moment of activation, the endoscopic video capsule begins its journey inside the patient's esophagus, stomach, small intestine, during which it constantly acquires, at specific moments of time (according to its settings defined by the producer), a snapshot of the location where it is at that moment. During this investigation, the capsule usually acquires around 50000 individual frames. The analysis process of all acquired images is time consuming, and it may be performed manually, by experienced physicians, or by employing software applications based on artificial intelligence and image processing techniques, that extract frames with unusual content and determine, with a specific probability, whether a lesion is present in that image.
The contents of the acquired images reflect the movement of the capsule. The rate of image acquisition, expressed in frames per second, is usually enough to capture clear and sufficient images for each area, and varies slightly between producers. There is no motion control, as the capsule does not have a propulsion system, nor the capacity to steer in a specific direction; it is simply moved forward by the natural peristaltic movements of the small bowel [14].
If the capsule’s motion is characterized by a high speed, then the informational content between two successive frames varies, as the distance between the two locations corresponding to image acquisition actions, is greater. Conversely, a slower speed emphasizes an almost identical content of two or more successive frames since the capsule resides more in the same area of the digestive tract.
Image similarity expresses the measure of how similar two different images are, by quantifying the degree of similarity between intensity patterns present in those two images. For WCE, high motion speed is associated with a small degree of similarity for successive frames, while slow speed increases the degree of similarity.
Even though there are many research teams trying to improve the functionality of capsules with the ability to move independently, to perform biopsies, or for local drug administration [18,19,20], its current use is purely imagistic, as it provides an impressive set of images acquired from the patient’s digestive tract. To reduce the analysis time of the entire acquired film, a frame similar to the previous one may be removed from the processing activity, considering that they have the same characteristics, so it cannot bring new information or other benefits, both in manual and automatic analysis process. So, similarity analysis may be useful for reducing the volume of analyzed frames, allowing an efficient usage of resources, and an optimization in the global processing time.
The aim of this study was to test the use of color histograms and Local Binary Patterns (LBP) techniques in the assessment of the similarity level between two successive WCE frames, to remove similar frames and to assess the volume of the remaining images.
Material and Methods
This study was performed on a set of images previously acquired from 54 patients investigated with Olympus EndoCapsules EC® within the Research Center of Gastroenterology and Hepatology, University of Medicine and Pharmacy of Craiova.
All investigations took place during a research study conducted in accordance with the Declaration of Helsinki and approved by the Ethics Committee of the University of Medicine and Pharmacy of Craiova.
All patients included in the study lot provided an informed consent regarding the use of their data for future analysis.
The global dataset comprised 54 movies, each one composed by more than 50000 individual frames.
A team of gastroenterologists analyzed all images and provided a diagnostic for each patient, according to imagistic and clinical data. Images containing lesions (polyps, telangiectasia, ulcerations) were labeled as lesion frames, while the others were defined as normal frames.
Both types of frames may be identified in sequences of successive similar images.
To study the similarity between two different images, many techniques use histograms that numerically quantify the content of an image based on color or textures.
Histograms
In the field of image processing, an image may be considered a matrix of individual elements named pixels, each one defining a certain level of intensity, expressed numerically. The number of pixels belonging to an image is a measure of resolution. A high resolution implies a higher number of pixels. The histogram of a specific image refers to the histogram of the pixel intensity values, which is a graph reflecting the number of pixels defining each different intensity value identified in that image [21].
In case the image contains a relatively small number of different intensity values, the normalization technique may be used to distribute the frequencies of the initial histogram over a wider range, compared to the current range, leading to an enhancement of contrast.
Normalized histograms are also used to determine the degree of similarity between two different images, by calculating the sum of the squares of the differences between pixel intensity categories.
Histograms are a graphical representation of the quantitative distribution of pixels in an image, based on a specific criterion, including the number of pixels for each color aspect, so both colors and textures can be represented by histograms [22].
The color histogram represents the color distribution of an image. For each shade which is related to the global color space of the image (representing the ensemble of all colors that appear in that image), the number of pixels with the same color defines the histogram value for that shade. The texture histogram requires a quantitative way of expressing the texture. An optimal way is to use the LBP operator-Local Binary Pattern. For each pixel, LBP is calculated based on the appropriate values for neighborhood and radius. If this value reflects a uniform pattern, then the number of pixels falling in that category is increased; there is a similar approach for non-uniform detected patterns. These categories represent the basic classes for constructing the associated texture histogram. Basically, the purpose of using histograms is not to identify a similar image with a given one, nor to identify the duplicate image in a set of images; the goal is to establish the true measure of equivalence between two successive frames composing the same sequence.
Color and texture analysis, histogram creation followed by normalization, and similarity computation were performed using the framework C# AForge.NET and Matlab.
Results
From the initial set of 54 WCE movies, a sample set of 100 sequences from various parts of the digestive tract, was selected. Each sequence comprised 5001 successive images. Those images have been grouped into successive image pairs; thus, 1000 pairs were created in each set. This value ensures a diversity of images in each sample set, as the capsule usually covers a significant distance within the patient’s digestive tract.
For all pairs from a set, the color histograms and LBP histograms were determined for each individual image, then the differences between them were computed. Normally, a value close to 0 reflects a higher degree of similarity, meaning very small differences, mostly at pixel level, between images.
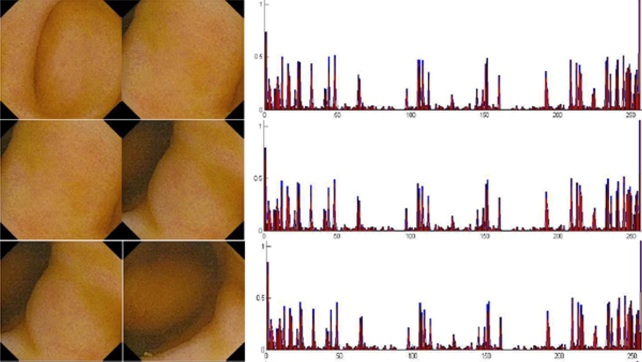
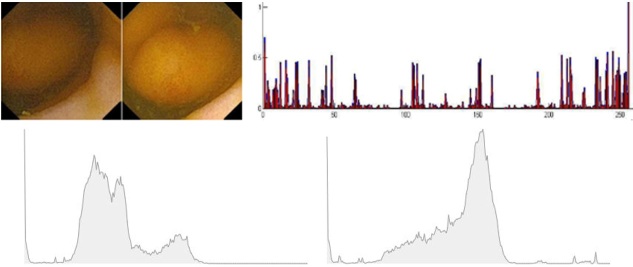
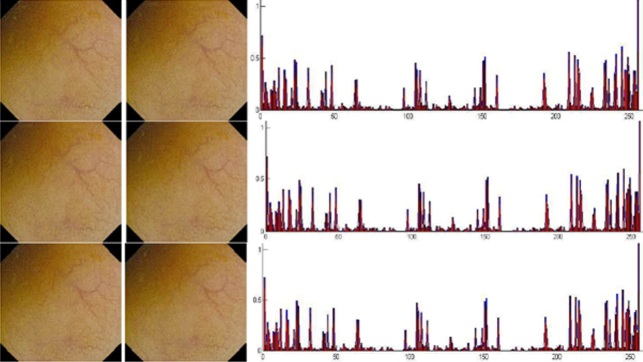
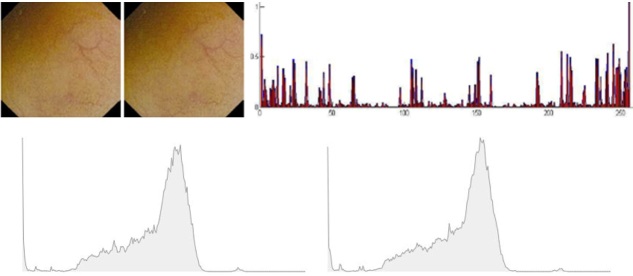
For visual purposes, two extra sets of 4 pairs of frames were selected: set A contains 5 relatively different images (Figure 1 and Figure 2) and set B contains 5 relatively similar images (Figure 3 and Figure 4), thus forming 4 pairs of images for each set. For a rapid visual comparison, Figure 5 reflects two dental panoramic x-rays belonging to different patients, and their associated histograms, for grayscale images, that are plotted in different images, to better visualize the differences between them.
Figure 1.
Comparison of histograms for WCE images with a low level of similarity
Figure 2.
Comparison of histograms for WCE images with a low level of similarity and individual individual histogram chart
Figure 3.
Comparison of histograms for WCE images with a high level of similarity
Figure 4.
Comparison of histograms for WCE images with a high level of similarity and individual histogram chart
Figure 5.
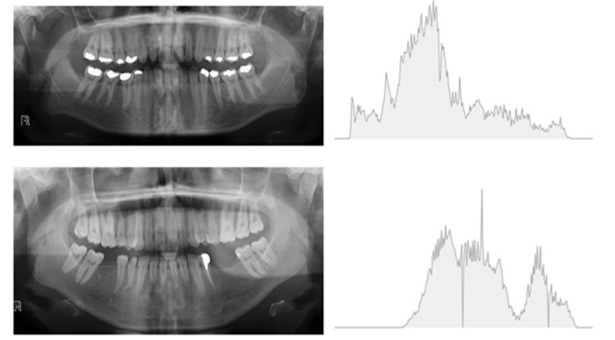
Comparison of histograms for two dental images belonging to different patients
They were chosen to emphasize the fact that, even if they seem similar in terms of color groups and elements’ location, still there are major differences between them.
Table 1 and Table 2 reflect the differences between the color histograms and LBP histograms for two sets of 10 WCE images. The values were normalized for easy visual comparison. According to the data in Table 1 and Table 2, the color histogram better reflected the differences and visual similarities in the two sets of images extracted from the study set (the values highlighted on a gray background represent the smallest differences between the histograms). Similar results were obtained for the sample set of sequences extracted from the original WCE films.
Table 1.
Comparative values of color and texture histograms for an image set with 10 frames (the first 5 belong to set A), computed by pairs of two successive images
|
|
Im1 |
Im2 |
Im2 |
Im3 |
Im3 |
Im4 |
Im4 |
Im5 |
|
Color histogram |
0.9919 |
3.2641 |
0.9593 |
2.0079 |
||||
|
LBP histogram |
6.4161 |
3.7259 |
3.9483 |
2.9303 |
||||
|
|
Im5 |
Im6 |
Im6 |
Im7 |
Im7 |
Im8 |
Im8 |
Im9 |
|
Color histogram |
2.2877 |
2.4491 |
2.1063 |
0.2500 |
||||
|
LBP histogram |
3.5144 |
4.9807 |
10.5369 |
3.4821 |
||||
Table 2.
Comparative values of color and texture histograms for an image set with 10 frames (the first 5 belong to set B), computed by pairs of two successive images
|
|
Im1 |
Im2 |
Im2 |
Im3 |
Im3 |
Im4 |
Im4 |
Im5 |
|
Color histogram |
0.0177 |
0.0149 |
0.0166 |
0.0249 |
||||
|
LBP histogram |
1.9779 |
1.8429 |
1.7467 |
2.5116 |
||||
|
|
Im5 |
Im6 |
Im6 |
Im7 |
Im7 |
Im8 |
Im8 |
Im9 |
|
Color histogram |
0.0217 |
0.0897 |
0.0173 |
0.0278 |
||||
|
LBP histogram |
1.6216 |
2.2091 |
1.8100 |
1.4185 |
||||
With a threshold of 1.5, the similarity analysis between the frames included in these sequences reflected an average of 24.81% similar frames, based on color histograms, and an average of 19.74% similar frames, based on texture histograms. So, almost a quarter of similar frames could potentially be eliminated before the analysis of the global WCE film. It is worth mentioning that similarity between lesion frames was also identified, leading thus to an elimination of a lesion frame. However, no lesion was completely removed from any sequence.
Discussions
For a generic domain, image similarity may be defined as the result of comparing the contents of two or more images, in the attempt to determine equivalence related to objects (the same object presented from different perspectives, when captured under different conditions), or to categories (different objects or scenes that fall under the same category). Techniques for determining the similarity between images may be based either on image representation or on defining an appropriate way of comparing images in a particular representation space [23].
For a database composed by WCE images belonging to a single patient, the similarity of two sequential frames is determined using the same techniques, but for different purposes. The goal of this approach is not to retrieve, from the entire dataset, that image which is almost identical with the original one. If the capsule does not move, then the following image will surely be equal with the previous one. The goal is to find duplicates and remove one of each two identical pairs of images, thus reducing the entire volume of informative frames, useful for the examining physician. Since the informational content of the frames is represented mostly by the mucosa of the intestinal wall, and potential lesions that extend beyond the mucosa level (like pedunculated polyps, grown tumors, blood inside the intestine), similarity definition is based on object equivalence. All frames basically contain the same informational context as the frames before the current one, but from different perspectives, and potential different acquisition conditions (the capsule may be positioned closer or farther from the intestinal wall, which might include a change in the luminosity or contrast levels).
For sequential WCE images, similarity may be considered a measure of the capsule’s motion, expressed as imagistic differences between the two locations of the capsule inside the patient’s digestive tract. If the capsule moves in slow motion, the two different locations may be considered as almost identical, in which case the differences between them would be minimal, so the similarity degree would be high. In contrast, when the peristaltic movements induce a faster speed for the capsule, it covers a greater distance between two successive acquired images (even with a high acquisition rate, there are still changes between the two locations’ visual characteristics), so the differences regarding the context are greater, therefore the degree of similarity would be smaller. In fact, there is an inverse proportionality relationship between imagistic differences and similarity degree, associated to the distance travelled by the capsule between acquiring two different snapshots.
Similarity measurements were tested on 50.000 individual frames, grouped in sequences, extracted from all 54 video files, with or without lesions, to demonstrate the applied processing techniques and volume reduction method. The color palette of the digestive tract is quite constant for large distances, so color and texture histograms were successfully employed to determine the similarity degree. Still, histograms may present disadvantages, too, when the two images included in the comparison pair have the same distribution of colors and textures, but their physical distribution is completely different. In this case, since this method does not rely on a content-based image retrieval approach, but on an imagistic equivalence approach, further analysis of WCE frames and applicability of histograms will help reduce the global processing time.
The purpose of our study was to perform an initial reduction of the volume of imagistic data that the physician must analyze, by removing very similar images (that may be considered duplicates). Given the fact that the capsule may have moments when it moves quite slow, the chances of acquiring very similar images are increased. Those images do not present any interesting informational content and may be, therefore, removed from the subsequent analysis, reducing the overall image volume.
Most studies in current literature are based on an informational content analysis, and a removal of all non-informative frames [24,25,26,27,28].
This increases the risk of removing lesion frames from the final dataset, since the decision of informative or non-informative frame is taken by various machine learning algorithms, not by physicians. But at the same time, a comparison of results cannot be performed since the purposes were different.
After the initial removal of duplicates, the natural following phases of a global WCE movie analysis concern the removal of images with no relevant content (images with debris, bubbles, low brightness, or contrast, etc.), identification of images with and without lesions and classification of encountered lesions; all these phases represent future directions of study.
Conclusion
Similarity analysis between successive WCE frames helps reducing the volume of images to be analyzed by the physician or software application. In both cases, a lower number of frames signifies a lower analysis time spent with a single WCE movie.
Conflict of interests
None to declare.
Acknowledgments
Acknowledgements
Mihaela Ionescu and Alin Gabriel Ionescu have equally contributed to this paper, therefore they share the first authorship.
References
- 1.Ashraf R, Ahmed M, Jabbar S, Khalid S, Ahmad A, Din S, Jeon G. Content Based Image Retrieval by Using Color Descriptor and Discrete Wavelet Transform. J Med Syst. 2018;42(3):44–44. doi: 10.1007/s10916-017-0880-7. [DOI] [PubMed] [Google Scholar]
- 2.Zhao Z, Tian Q, Sun H, Jin X, Guo J. Content based image retrieval scheme using color, texture and shape features. Int. J. Signal Processing. 2016;9(1):203–212. [Google Scholar]
- 3.Suresh M, Naik BM. Content based image retrieval using texture structure histogram and texture features. Int J Comput Intell Res. 2017;13(9):2237–2245. [Google Scholar]
- 4.Kumar TS, Rajinikanth T, Reddy BE. Image information retrieval based on edge responses, shape and texture features using datamining techniques. Global Journal of Computer Science and Technology. 2016;16(3):20–20. [Google Scholar]
- 5.Jamil U, Sajid A, Alam A. Shafiq U. Melanoma segmentation using bio-medical image analysis for smarter mobile healthcare. J Ambient Intell Human Comput. 2019;10:4099–4120. [Google Scholar]
- 6.Dhara AK, Mukhopadhyay S, Dutta A, Garg M, Khandelwal N. Content-Based Image Retrieval System for Pulmonary Nodules: Assisting Radiologists in Self-Learning and Diagnosis of Lung Cancer. J Digit Imaging. 2017;30(1):63–77. doi: 10.1007/s10278-016-9904-y. [DOI] [PMC free article] [PubMed] [Google Scholar]
- 7.Elsheh MM, Eltomi SA. Content Based Image Retrieval using Color Histogram and Discrete Cosine Transform. Int. Journal of Computer Trends and Technology. 2019;67(9):25–31. [Google Scholar]
- 8.Tsuchida T, Negishi T, Takahashi Y, Nishimura R. Dense-breast classification using image similarity. Radiol Phys Technol. 2020;13(2):177–186. doi: 10.1007/s12194-020-00566-3. [DOI] [PubMed] [Google Scholar]
- 9.Napel SA, Beaulieu CF, Rodriguez C, Cui J, Xu J, Gupta A, Korenblum D, Greenspan H, Ma Y, Rubin DL. Automated retrieval of CT images of liver lesions on the basis of image similarity: method and preliminary results. Radiology. 2010;256(1):243–52. doi: 10.1148/radiol.10091694. [DOI] [PMC free article] [PubMed] [Google Scholar]
- 10.Hwang KH, Lee H, Choi D. Medical image retrieval: past and present. Healthcare informatics research. 2012;18(1):3–9. doi: 10.4258/hir.2012.18.1.3. [DOI] [PMC free article] [PubMed] [Google Scholar]
- 11.Wang Z, Xin J, Huang Y, Li C, Xu L, Li Y, Zhang H, Gu H, Qian W. A similarity measure method combining location feature for mammogram retrieval. J Xray Sci Technol. 2018;26(4):553–571. doi: 10.3233/XST-18374. [DOI] [PubMed] [Google Scholar]
- 12.Liu GH, Wei Z. Image Retrieval Using the Fused Perceptual Color Histogram. Comput Intell Neurosci. 2020;2020:8876480–8876480. doi: 10.1155/2020/8876480. [DOI] [PMC free article] [PubMed] [Google Scholar]
- 13.Feng Q, Hao Q, Chen Y, Yi Y, Wei Y, Dai J. Hybrid Histogram Descriptor: A Fusion Feature Representation for Image Retrieval. Sensors (Basel) 2018;18(6):1943–1943. doi: 10.3390/s18061943. [DOI] [PMC free article] [PubMed] [Google Scholar]
- 14.Chetcuti Zammit S, Sidhu R. Capsule endoscopy - Recent developments and future directions. Expert Rev Gastroenterol Hepatol. 2021;15(2):127–137. doi: 10.1080/17474124.2021.1840351. [DOI] [PubMed] [Google Scholar]
- 15.Liaqat A, Khan MA, Sharif M, Mittal M, Saba T, Manic KS, Al Attar FNH. Gastric Tract Infections Detection and Classification from Wireless Capsule Endoscopy using Computer Vision Techniques: A Review. Curr Med Imaging. 2020;16(10):1229–1242. doi: 10.2174/1573405616666200425220513. [DOI] [PubMed] [Google Scholar]
- 16.Bang CS, Lee JJ, Baik GH. Computer-Aided Diagnosis of Gastrointestinal Ulcer and Hemorrhage Using Wireless Capsule Endoscopy: Systematic Review and Diagnostic Test Accuracy Meta-analysis. J Med Internet Res. 2021;23(12):e33267–e33267. doi: 10.2196/33267. [DOI] [PMC free article] [PubMed] [Google Scholar]
- 17.McCarty TR, Afinogenova Y, Njei B. Use of Wireless Capsule Endoscopy for the Diagnosis and Grading of Esophageal Varices in Patients With Portal Hypertension: A Systematic Review and Meta-Analysis. J Clin Gastroenterol. 2017;51(2):174–182. doi: 10.1097/MCG.0000000000000589. [DOI] [PMC free article] [PubMed] [Google Scholar]
- 18.Kwack WG, Lim YJ. Current Status and Research into Overcoming Limitations of Capsule Endoscopy. Clin Endosc. 2016;49(1):8–15. doi: 10.5946/ce.2016.49.1.8. [DOI] [PMC free article] [PubMed] [Google Scholar]
- 19.Yim S, Gultepe E, Gracias DH, Sitti M. Biopsy using a magnetic capsule endoscope carrying, releasing, and retrieving untethered microgrippers. IEEE Trans Biomed Eng. 2014;61(2):513–21. doi: 10.1109/TBME.2013.2283369. [DOI] [PMC free article] [PubMed] [Google Scholar]
- 20.Woods SP, Constandinou TG. A compact targeted drug delivery mechanism for a next generation wireless capsule endoscope. J Microbio Robot. 2016;11(1):19–34. doi: 10.1007/s12213-016-0088-9. [DOI] [PMC free article] [PubMed] [Google Scholar]
- 21.Zhou H, Shen Y, Zhu X, Liu B, Fu Z, Fan N. Digital image modification detection using color information and its histograms. Forensic Science International. 2016;266:379–388. doi: 10.1016/j.forsciint.2016.06.005. [DOI] [PubMed] [Google Scholar]
- 22.Balasubramani R, Kannan V. Efficient use of MPEG-7 Color Layout and Edge Histogram Descriptors in CBIR Systems. Global Journal of Computer Science and Technology. 2009;9(4):157–163. [Google Scholar]
- 23.Karakus S, Avci E. A new image steganography method with optimum pixel similarity for data hiding in medical images. Med Hypotheses. 2020;139:109691–109691. doi: 10.1016/j.mehy.2020.109691. [DOI] [PubMed] [Google Scholar]
- 24.Nakamura M, Murino A, O'Rourke A, Fraser C. A critical analysis of the effect of view mode and frame rate on reading time and lesion detection during capsule endoscopy. Dig Dis Sci. 2015;60(6):1743–1747. doi: 10.1007/s10620-014-3496-5. [DOI] [PubMed] [Google Scholar]
- 25.Liu H, Pan N, Lu H, Song E, Wang Q, Hung CC. Wireless capsule endoscopy video reduction based on camera motion estimation. J Digit Imaging. 2013;26(2):287–301. doi: 10.1007/s10278-012-9519-x. [DOI] [PMC free article] [PubMed] [Google Scholar]
- 26.Iakovidis DK, Tsevas S, Polydorou A. Reduction of capsule endoscopy reading times by unsupervised image mining. Comput Med Imaging Graph. 2010;34:471–478. doi: 10.1016/j.compmedimag.2009.11.005. [DOI] [PubMed] [Google Scholar]
- 27.Mehmood I, Sajjad M, Baik SW. Video summarization based tele-endoscopy: a service to efficiently manage visual data generated during wireless capsule endoscopy procedure. J Med Syst. 2014;38(9):109–109. doi: 10.1007/s10916-014-0109-y. [DOI] [PubMed] [Google Scholar]
- 28.Liu H, Pan N, Lu H, Song E, Wang Q, Hung CC. Wireless capsule endoscopy video reduction based on camera motion estimation. J Digit Imaging. 2013;26(2):287–301. doi: 10.1007/s10278-012-9519-x. [DOI] [PMC free article] [PubMed] [Google Scholar]


