Abstract
Myelodysplastic syndromes (MDS) are hematopoietic stem cell disorders, the pathogenesis of which involves enhanced immune signaling that promotes or selects for mutant hematopoietic stem and progenitor cells (HSPCs). In particular, toll-like receptor (TLR) expression and signaling are enhanced in MDS, and their inhibition is an attractive therapeutic strategy. Although prior studies have reported increased expression of TLR2 and its binding partners TLR1 and TLR6 in the CD34+ cells of patients with MDS (especially those with low-risk disease), TLR expression in other cell types throughout the bone marrow is largely unknown. To address this, we used mass cytometry to assess the expression of TLR1, TLR2, and TLR6 and cytokines in the bone marrow hematopoietic cells of six low/intermediate-risk and six high-risk unmatched MDS bone marrow samples, as well as healthy controls, both at baseline and in response to TLR agonists. We observed several consistent differences between the groups. Most notably, TLR expression was upregulated in multiple cell populations in the low/intermediate-risk, but not high-risk, patients. In addition, many cytokines, including interleukin-6, interleukin-8, tumor necrosis factor α, transforming growth factor β, macrophage inflammatory protein 1β, and granzyme B, were highly expressed from various cell types in low/intermediate-risk patients. However, these same cytokines, with the exception of transforming growth factor β, were expressed at lower levels in high-risk MDS. Together, these findings highlight the differential role of inflammation, and specifically TLR expression, in low/intermediate- versus high-risk MDS, and suggest that elevated TLR expression and cytokine production in multiple cell types likely influences the pathogenesis of MDS in lower-risk patients.
Affecting up to 20,000 people per year in the United States, the myelodysplastic syndromes (MDS) are a heterogeneous group of hematopoietic stem cell disorders characterized by ineffective hematopoiesis and a high risk of transformation to acute leukemia [1,2]. The pathogenesis of MDS involves enhanced innate immune signaling that promotes or selects for mutant hematopoietic stem and progenitor cells (HSPCs). In particular, the expression of multiple toll-like receptors (TLRs), especially TLR2, is increased in the CD34+ HSPCs of patients with MDS [3–7]. TLRs are a family of pattern recognition receptors that recognize pathogens as well as endogenous byproducts of cellular damage, and signaling through the TLRs leads to the production of proinflammatory cytokines. Exposure to TLR ligands influences the differentiation, cycling, and survival of HSPCs, and chronic TLR signaling impairs normal HSPC function [8–13]. We and others have reported that TLR signaling regulates these processes in HSPCs via both cell autonomous and cell non-autonomous mechanisms [14,15]. The association between elevated TLR2 and low-risk MDS has prompted enthusiasm for targeting TLR2 signaling therapeutically, with a TLR2 inhibitory antibody (Tomaralimab, Opsona Therapeutics, Dublin, Ireland) now having completed a phase I/II trial for the treatment of low-risk MDS patients that have failed front-line therapy [16].
Although multiple prior studies have found increased expression of TLRs, particularly TLR2 and its binding partners, TLR1 and TLR6, in the CD34+ cells of patients with MDS [3,5–7], the expression of these TLRs in other cell types throughout the bone marrow is largely unknown. TLRs are normally expressed in a variety of hematopoietic cells [11,17–19], and their expression can be upregulated by inflammatory cytokines and TLR ligands [20–22]. Given that circulating levels of inflammatory cytokines and TLR ligands are enhanced in patients with MDS [23,24]. and inflammatory stimuli can upregulate TLR expression on various bone marrow cell types, we hypothesized that TLR expression may be broadly increased throughout the bone marrow of patients with MDS. Further, studies have found that MDS-driving mutations may involve both myeloid and lymphoid cell lineages [25–27]. Next, as TLR expression in CD34+ cells is generally more robust in lower-risk patients [3,7], we predicted that the expression of TLRs throughout the marrow would similarly differ in lower-risk versus high-risk patients. Finally, TLR signaling promotes the production of pro-inflammatory cytokines [28], and we thus predicted that such cytokines would be produced by multiple cell types throughout the marrow in patients with MDS, particularly those with lower-risk disease.
Herein, we used mass cytometry by time of flight (CyTOF) to assess the expression of TLR1, TLR2, TLR6, and cytokines in bone marrow hematopoietic cells, both at baseline and in response to TLR agonists, of patients with low/intermediate- or high-risk MDS compared with healthy controls. As predicted, TLR expression was widely upregulated in multiple bone marrow populations in the low/intermediate-risk patients, including monocytes, granulocytes, B cells, T cells, natural killer (NK) cells, and stem and progenitor cells. In contrast, TLR expression was relatively low throughout the marrow in high-risk patients. Furthermore, multiple cytokines, including interleukin (IL)-6, IL-8, tumor necrosis factor α (TNFα), transforming growth factor β (TGFβ), macrophage inflammatory protein 1β (MIP1β), and granzyme B, were highly expressed from various cell types in low/intermediate-risk patients. These same cytokines, however, with the exception of TGFβ, were generally expressed at lower levels in patients with high-risk MDS. Given that TLR signaling regulates HSPCs via both cell autonomous and cell non-autonomous mechanisms, these new data suggest that elevated TLR expression and cytokine production in multiple cell types likely influence the pathogenesis of MDS in low/intermediate-risk patients.
METHODS
Patient Samples
Patient and healthy donor bone marrow samples were obtained with written informed consent per protocols approved by the Washington University Human Studies Committee. Samples from six high-risk MDS patients, six low- or intermediate-risk (based on the Revised International Prognostic Scoring System [IPSS-R] score) MDS patients, and five controls (healthy adult volunteers) were analyzed (Supplementary Table E1, online only, available at www.exphem.org). MDS samples were selected based on having not had prior treatment and availability of sufficient cells for CyTOF analysis. Bone marrow mononuclear cells were obtained by Ficoll gradient extraction and cryopreserved before analysis. Plasma was obtained from the same MDS patients. Healthy donor plasma was obtained from different donors than those used for mass cytometry (Supplementary Table E1).
Mass Cytometry
Samples were processed for surface staining and intracellular staining as described previously [29–31]. EQ Four Element Calibration Beads were used during collection, according to the manufacturer’s instructions (Fluidigm, South San Francisco, CA). Metal-tagged antibodies were purchased from Fluidigm or custom conjugated using the Max-par X8 Antibody Labeling Kit (Fluidigm), according to the manufacturer’s instructions. All custom antibodies were titrated with primary human bone marrow cells. Three million whole bone marrow cells from healthy donors and MDS patients were incubated with PAM2CSK4 (1 μg/mL, InvivoGen, San Diego, CA), PAM3CSK4 (1 μg/mL, InvivoGen), or vehicle control for 4 hours at 37°C in a 5% CO2 incubator, adding a 500 × secretion inhibitor after 2 hours of stimulation. For staining, 3 × 10⁶ bone marrow cells were stained with surface antibodies (Supplementary Table E2, online only, available at www.exphem.org) for 1 hour at 4°C in CyFACS buffer (0.1% bovine serum albumin [BSA], 0.02% NaN2, 2 mmol/L ethylenediaminetetraacetic acid [EDTA] in CyPBS; Rockland Immunochemicals, Gibertsville, PA). After surface staining, cells were washed with CyPBS before staining for viability with 2.5 μmol/L cisplatin (Sigma-Aldrich, Burlington, MA), followed by a wash with CyFACS, and fixed in 2% paraformaldehyde for 15 minutes at room temperature. For intracellular staining, cells were washed and resuspended with 1 × eBioscience Perm Buffer (0.1% saponin and 0.009% sodium azide) followed by intracellular staining for 1 hour at 4°C. Cells were washed and stained with a Cell-ID intercalator according to the manufacturer’s directions (Fluidigm). Samples were analyzed on a CyTOF2 mass cytometer (Fluidigm) and data were analyzed using Cytobank (cytobank.org) for both conventional cell population gating and viSNE analysis.
Cytokine Analysis by Proteome Profiler Human Cytokine Array
Peripheral blood plasma collected under standard protocols, from one healthy donor, three low/intermediate-risk MDS patients, and six high-risk MDS patients, was stored at −80°C. Plasma from the same MDS patients as analyzed with CyTOF were used. Samples were assessed using the Proteome Profiler Human Cytokine Array (R&D Systems, Minneapolis, MN), according to the manufacturer’s instructions. Densitometry was performed using ImageJ (National Institutes of Health [NIH], Bethesda, MD).
Cytokine Analysis by ELISA
Peripheral blood plasma from four healthy donors, as well as the same six low/intermediate-risk and six high-risk MDS patients from the CyTOF studies, was stored at −80°C. IL-6 (Human IL-6 DuoSet ELISA), IL-8 (DuoSet ELISA [enzyme-linked immunosorbent assay] Human IL-8/CXCL8), TGFβ (human TGFβ1), and TNFα (Quantikine ELISA human TNFα) were measured according to kit instructions (R&D Systems, Minneapolis, MN) and read at 450 nm with a SpectraMax 340PC plate reader (Molecular Devices, Sunnyvale, CA).
Statistical Analysis
Data are expressed as the mean ± SEM, unless stated otherwise. Statistical significance was assessed using an unpaired, two-tailed Student t test or two-way analysis of variance (ANOVA). GraphPad Prism (GraphPad Software, La Jolla, CA) was used for all analyses. In all cases, *p < 0.05, **p < 0.01, ***p < 0.001, and ****p < 0.0001.
RESULTS
Bone Marrow Population Frequencies Differ Between Low-Risk and High-Risk MDS
To assess TLR and cytokine expression, we performed single-cell CyTOF on six low/intermediate-risk and six high-risk MDS bone marrow samples, as well as five healthy adult control marrow samples (Supplementary Table E1). A 38-parameter panel including TLR1, TLR2, TLR6, other surface markers for immunophenotyping, and intracellular cytokines (Supplementary Table E2) was used to identify hematopoietic populations, TLR expression, and cytokine production. Both conventional gating (Figure 1A; Supplementary Figure E1, online only, available at www.exphem.org) and viSNE (Figure 1B) were used to identify T cells, B cells, CD14+ monocytes, CD16+ granulocytes, CD56high NK cells, CD34+CD38− HSPCs, CD34+CD61+ megakaryoblasts, and both early and late erythroblasts. Comparing the frequency of these populations using manual gating (Figure 1A; Supplementary Figure E1), we noted several differences between the MDS and healthy control samples. Most notably, CD14+ monocytes were significantly reduced in high-risk MDS patients compared with controls, and CD19+ B cells and CD71+CD235− early erythroblasts trended lower in low/intermediate-risk patients compared with healthy controls. In addition, CD34+CD38− HSPCs trended higher in high-risk patients with MDS compared with controls. viSNE plots of individual samples from each group illustrating the main differences in the populations are provided in Figure 1B.
Figure 1.
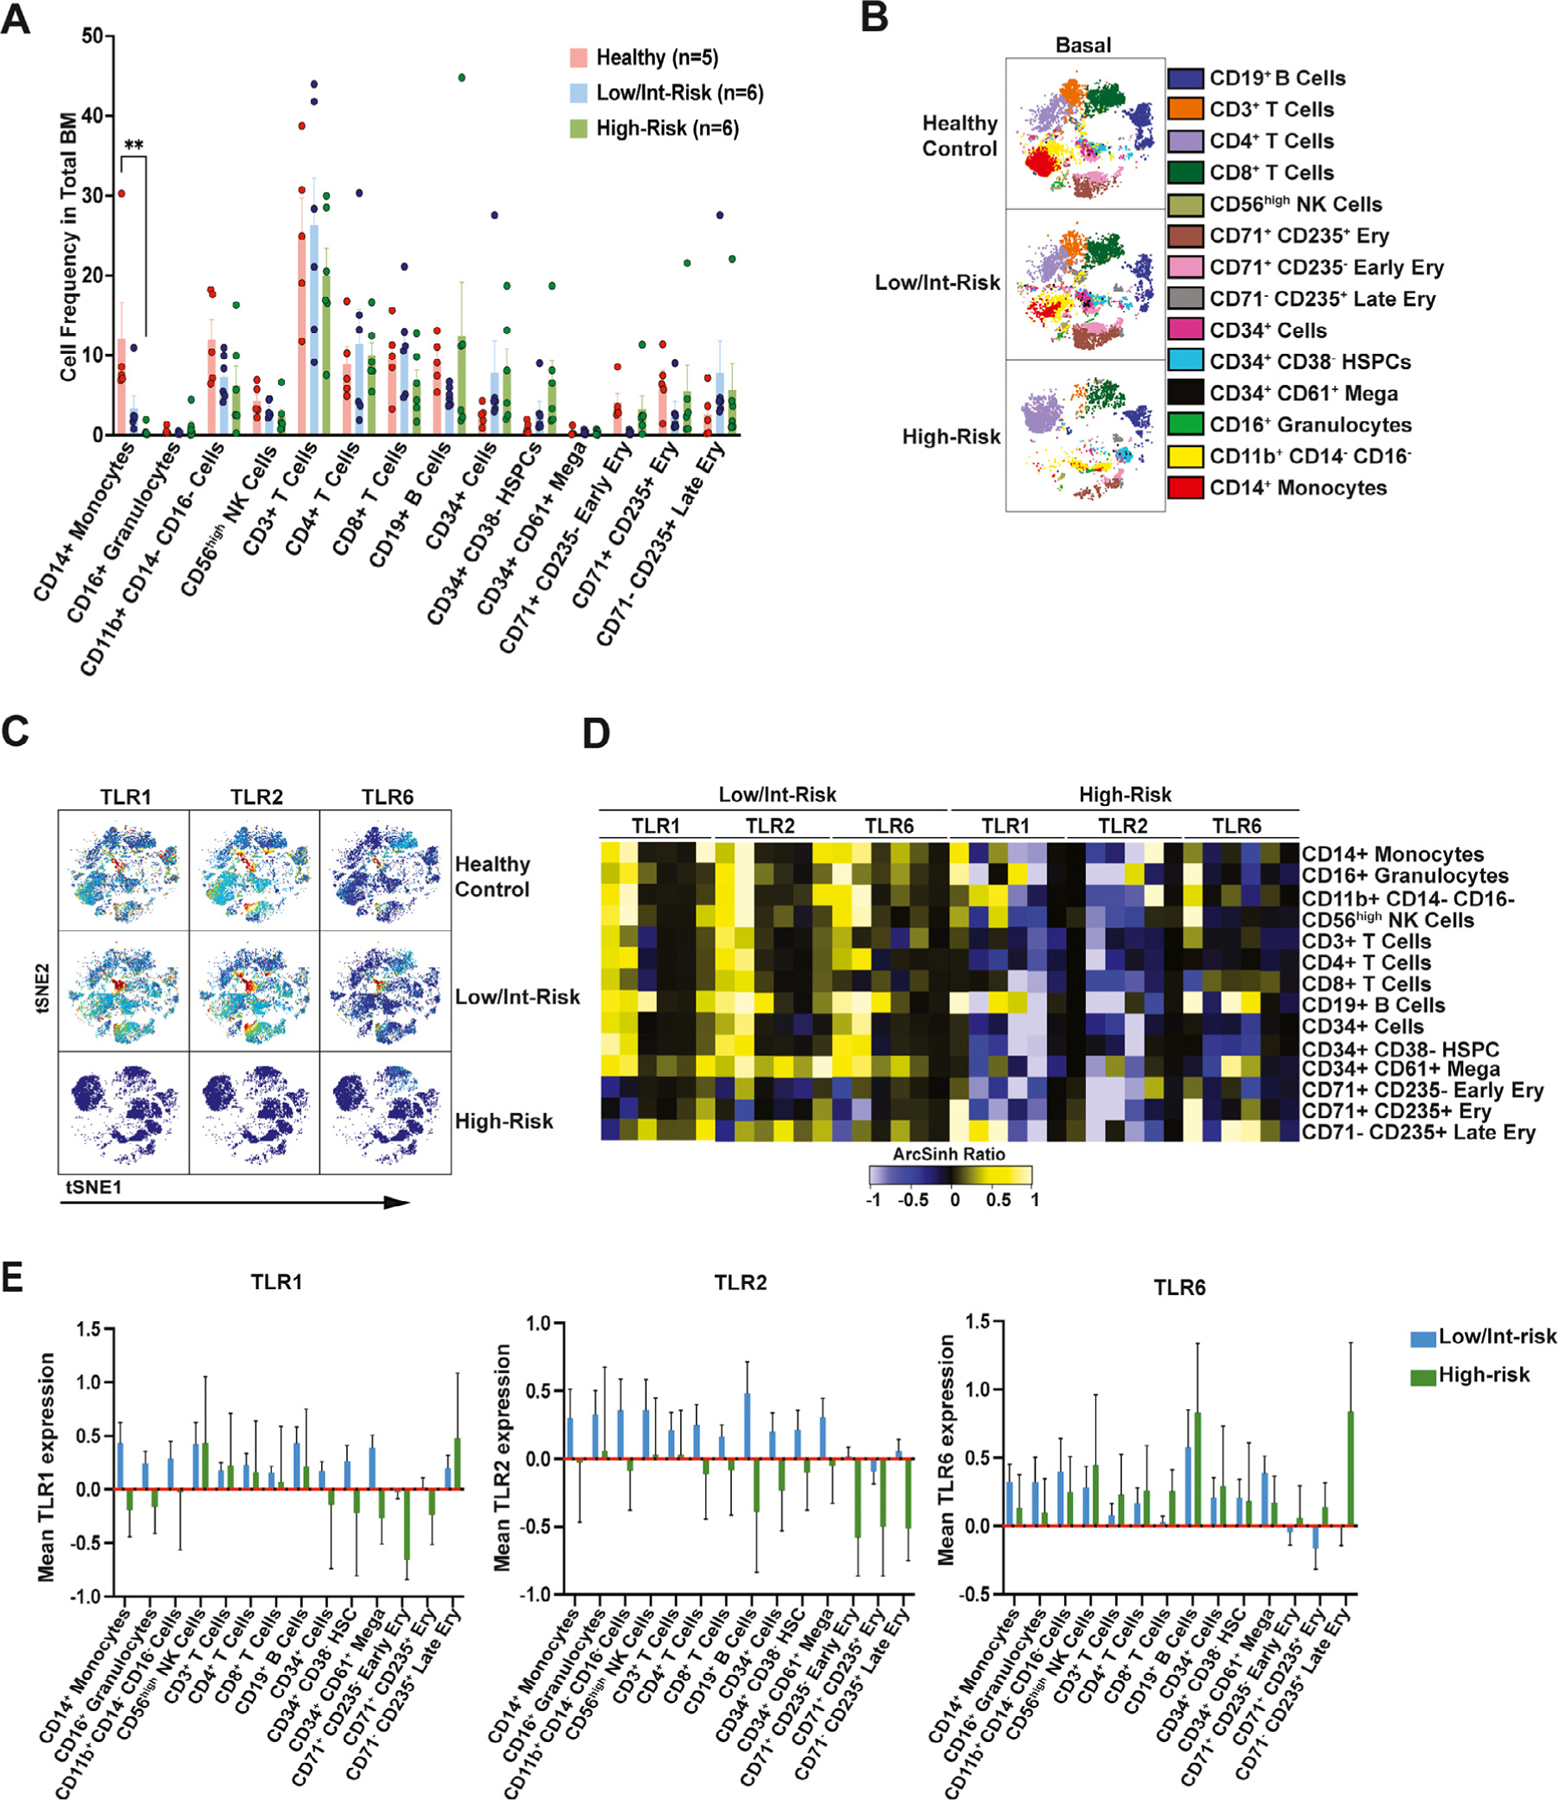
Bone marrow population frequencies and toll-like receptor (TLR0 expression differ between low/intermediate- and high-risk myelodysplastic syndromes (MDS). (A) Frequency of populations as manually gated in the bone marrow of patients with low/intermediate-risk MDS, high-risk MDS, and healthy controls. (B) viSNE map of single representative control and low/intermediate-risk and high-risk MDS bone marrow with different populations as indicated. (C) viSNE analysis of single representative samples from each cohort, revealing the expression of TLR1, TLR2, and TL6 in healthy donors and low/intermediate-risk and high-risk MDS bone marrow. (D) Heatmap of TLR1, TLR2, and TLR6 mean staining in the indicated populations in the bone marrow of low/intermediate-versus high-risk MDS. Tile colors represent the arcsinh ratio of the mean signal intensity normalized to healthy controls. Note that the samples in all heatmaps throughout the study are organized as follows, in order from left to right: patients low/intermediate-risk (LR) 1–6 and high-risk (HR) 1–6. The same data as in (D) are represented as bar graphs in (E), with the healthy control samples set at zero. Statistical significance was determined by a two-way analysis of variance followed by Tukey’s multiple comparison test. **p < 0.01.
TLR Expression Is Increased in Multiple Cell Types in Low/Intermediate-Risk MDS
Next, we evaluated the expression of TLR1, TLR2, and TLR6 in the aforementioned populations. Overall, expression of all three TLRs was increased in multiple cell types in low/intermediate-risk patients compared with controls, including CD14+ monocytes, CD16+ granulocytes, B cells, T cells, CD56high NK cells, CD34+CD38− HSPCs, erythroblasts, and CD34+CD61+ megakaryoblasts (Figure 1C–E). In contrast, TLR expression was relatively low in high-risk patients, with the exception of elevated TLR1 or TLR6 in various populations in some of the high-risk samples (Figure 1C–E).
Cytokine production differs between low- and high-risk MDS
Signaling through the TLRs leads to the production of pro-inflammatory cytokines, which have been reported to be dysregulated in patients with MDS compared with healthy controls [32]. We therefore next assessed cytokine production throughout the aforementioned bone marrow populations, both at baseline and in response to TLR agonists. Our panel limitations did not allow for assessment of all potentially relevant cytokines, but included many that have been previously implicated in MDS (Supplementary Table E2) [32]. Specifically, we divided each of the patient and control samples into three different conditions, and incubated them with the TLR2/6 agonist PAM2CSK4, the TLR1/2 agonist PAM3CSK4, or vehicle control for 4 hours at 37°C before preparation for mass cytometry analysis. Overall, baseline cytokine expression was higher in low/intermediate-risk MDS compared with high-risk patients, with multiple cell types throughout the marrow producing elevated levels of IL-6, IL-8, TNFα, MIP1β, and granzyme B compared with healthy controls (Figure 2A,B; Supplementary Figure E2, online only, available at www.exphem.org). One exception to this finding is TGFβ, which was produced at high levels by multiple cell types throughout the marrow in high-risk patients (Figure 2A,B). Notably, in most cases, cytokine production in the MDS samples was not further enhanced by treatment with TLR agonists (Figure 2B).
Figure 2.
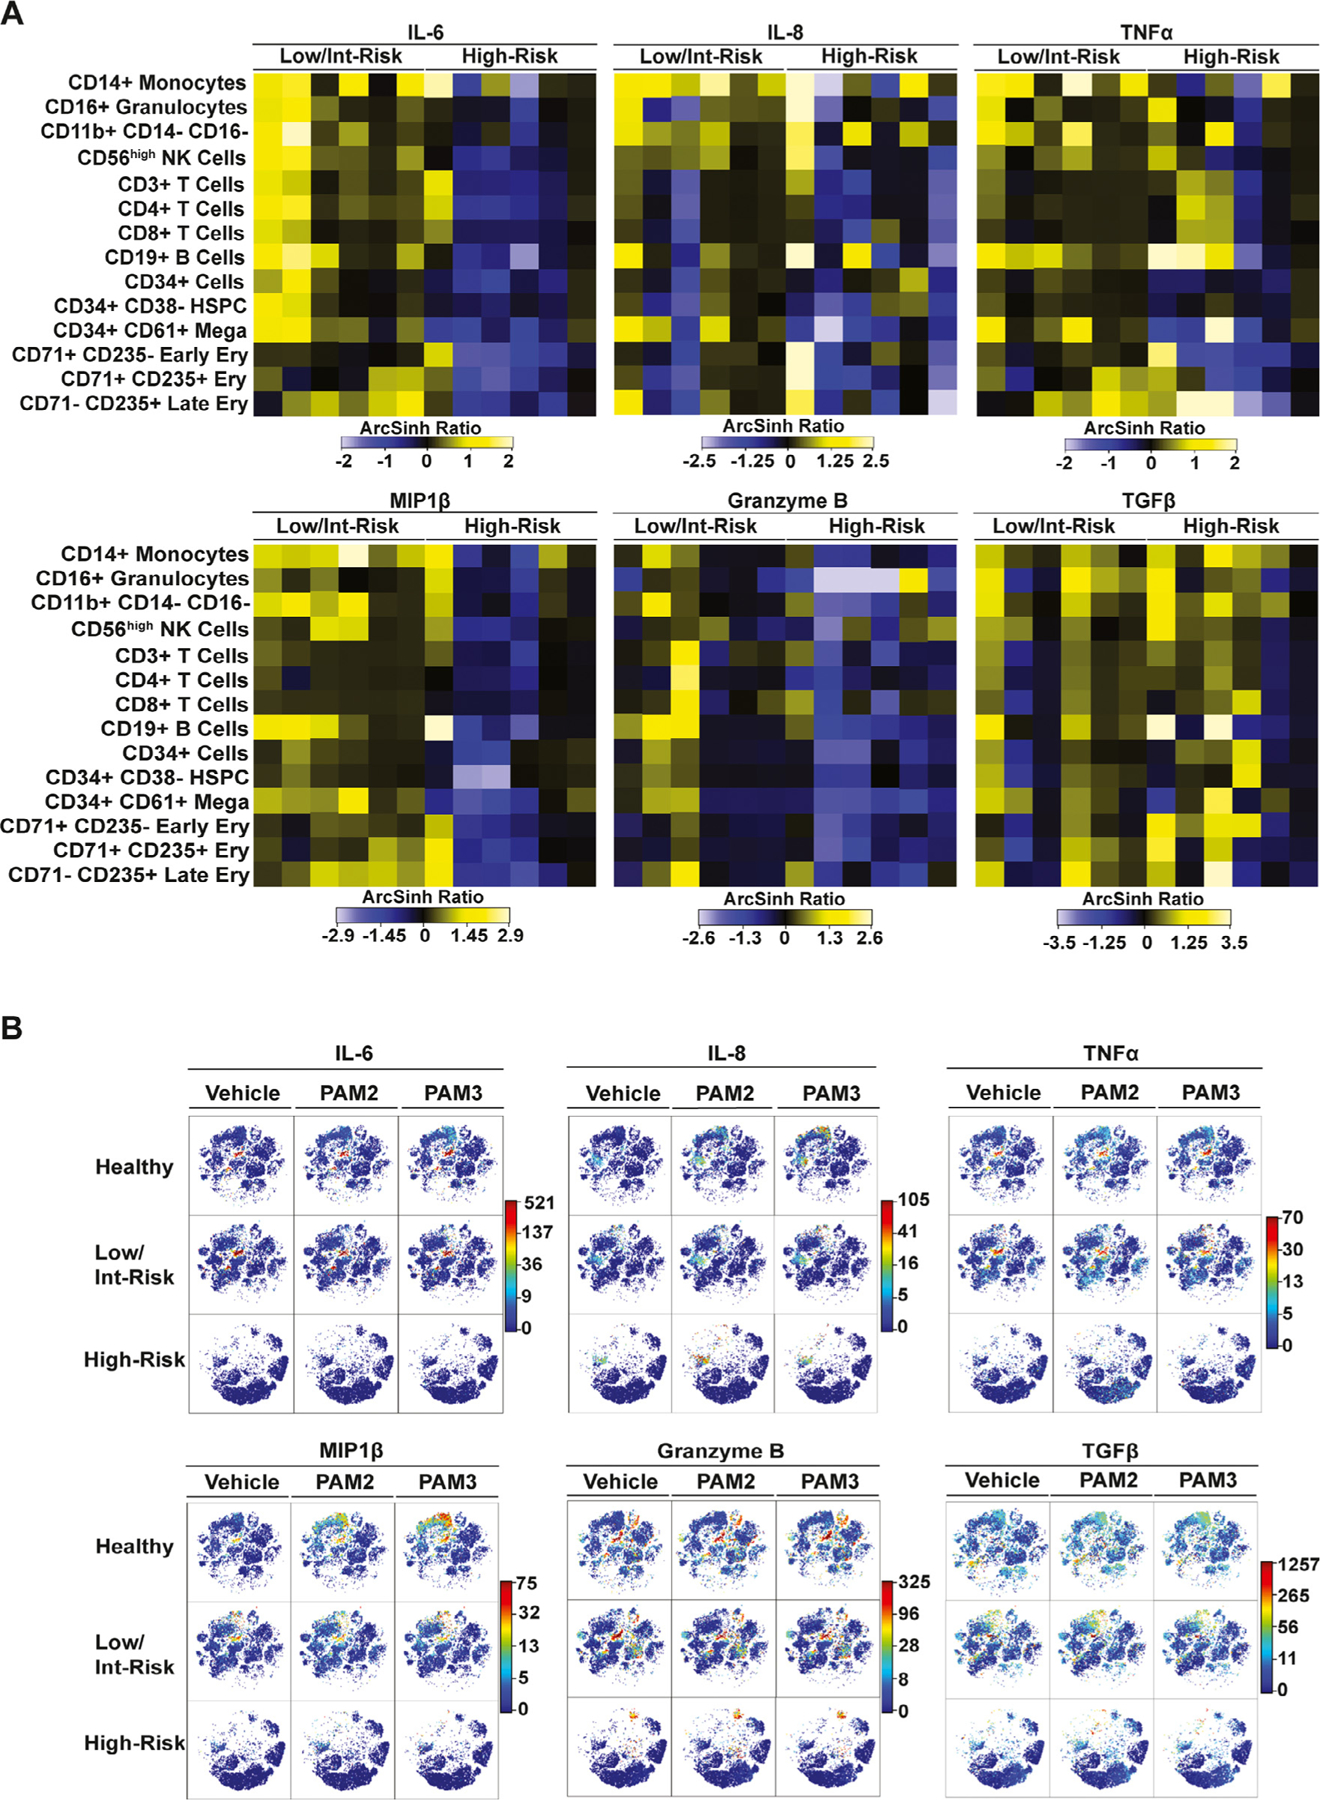
Cytokine production differs between patients with low/intermediate-risk and those with high-risk myelodysplastic syndromes (MDS). Shown are results for cytokines with consistent differences in multiple cell types between low/intermediate- and high-risk MDS and controls. (A) Heatmaps of the mean staining of the indicated proinflammatory cytokines in the indicated populations in bone marrow of low/intermediate- and high-risk MDS patients. Tile colors represent the arcsinh ratio of the mean signal intensity normalized to healthy controls. (B) viSNE analysis of single representative samples from each cohort indicating populations expressing the proinflammatory cytokines at baseline (vehicle) and in response to the TLR2/6 agonist PAM2CSK4 or the TLR1/2 agonist PAM3CSK4.
Focusing on individual cell types, CD14+ monocytes produced multiple cytokines, with mean expression higher than that of controls (Figure 3A) and a trend toward a greater percentage of cells producing IL-6, IL-8, and MIP1β at baseline in low/intermediate-risk patients compared with healthy controls (Figures 3B–E). Although production of these same cytokines (IL-6, IL-8, and MIP1β) increased in CD14+ cells in the control samples in response to the TLR agonists (Figure 3B–G), cytokine production did not change significantly overall in the MDS samples in response to treatment (Figure 3B–G; Supplementary Figure E3, online only, available at www.exphem.org). This is further illustrated in Supplementary Figure E3A–C, where patient and control samples are color-coded. An increased percentage of CD14+ cells produced IL-6, IL-8, and MIP1β in response to PAM2CSK4 or PAM3CSK4 among all of the healthy controls; however, this response was blunted in the majority of the low/intermediate-risk patient samples (with the exception of LR5, purple square) and the majority of the high-risk patient samples (with the exception of HR1, red dot). Finally, although CD14+ cells are reduced in patients with high-risk MDS (Figure 1A,B), they are a source of TGFβ in these patients (Figure 3F).
Figure 3.
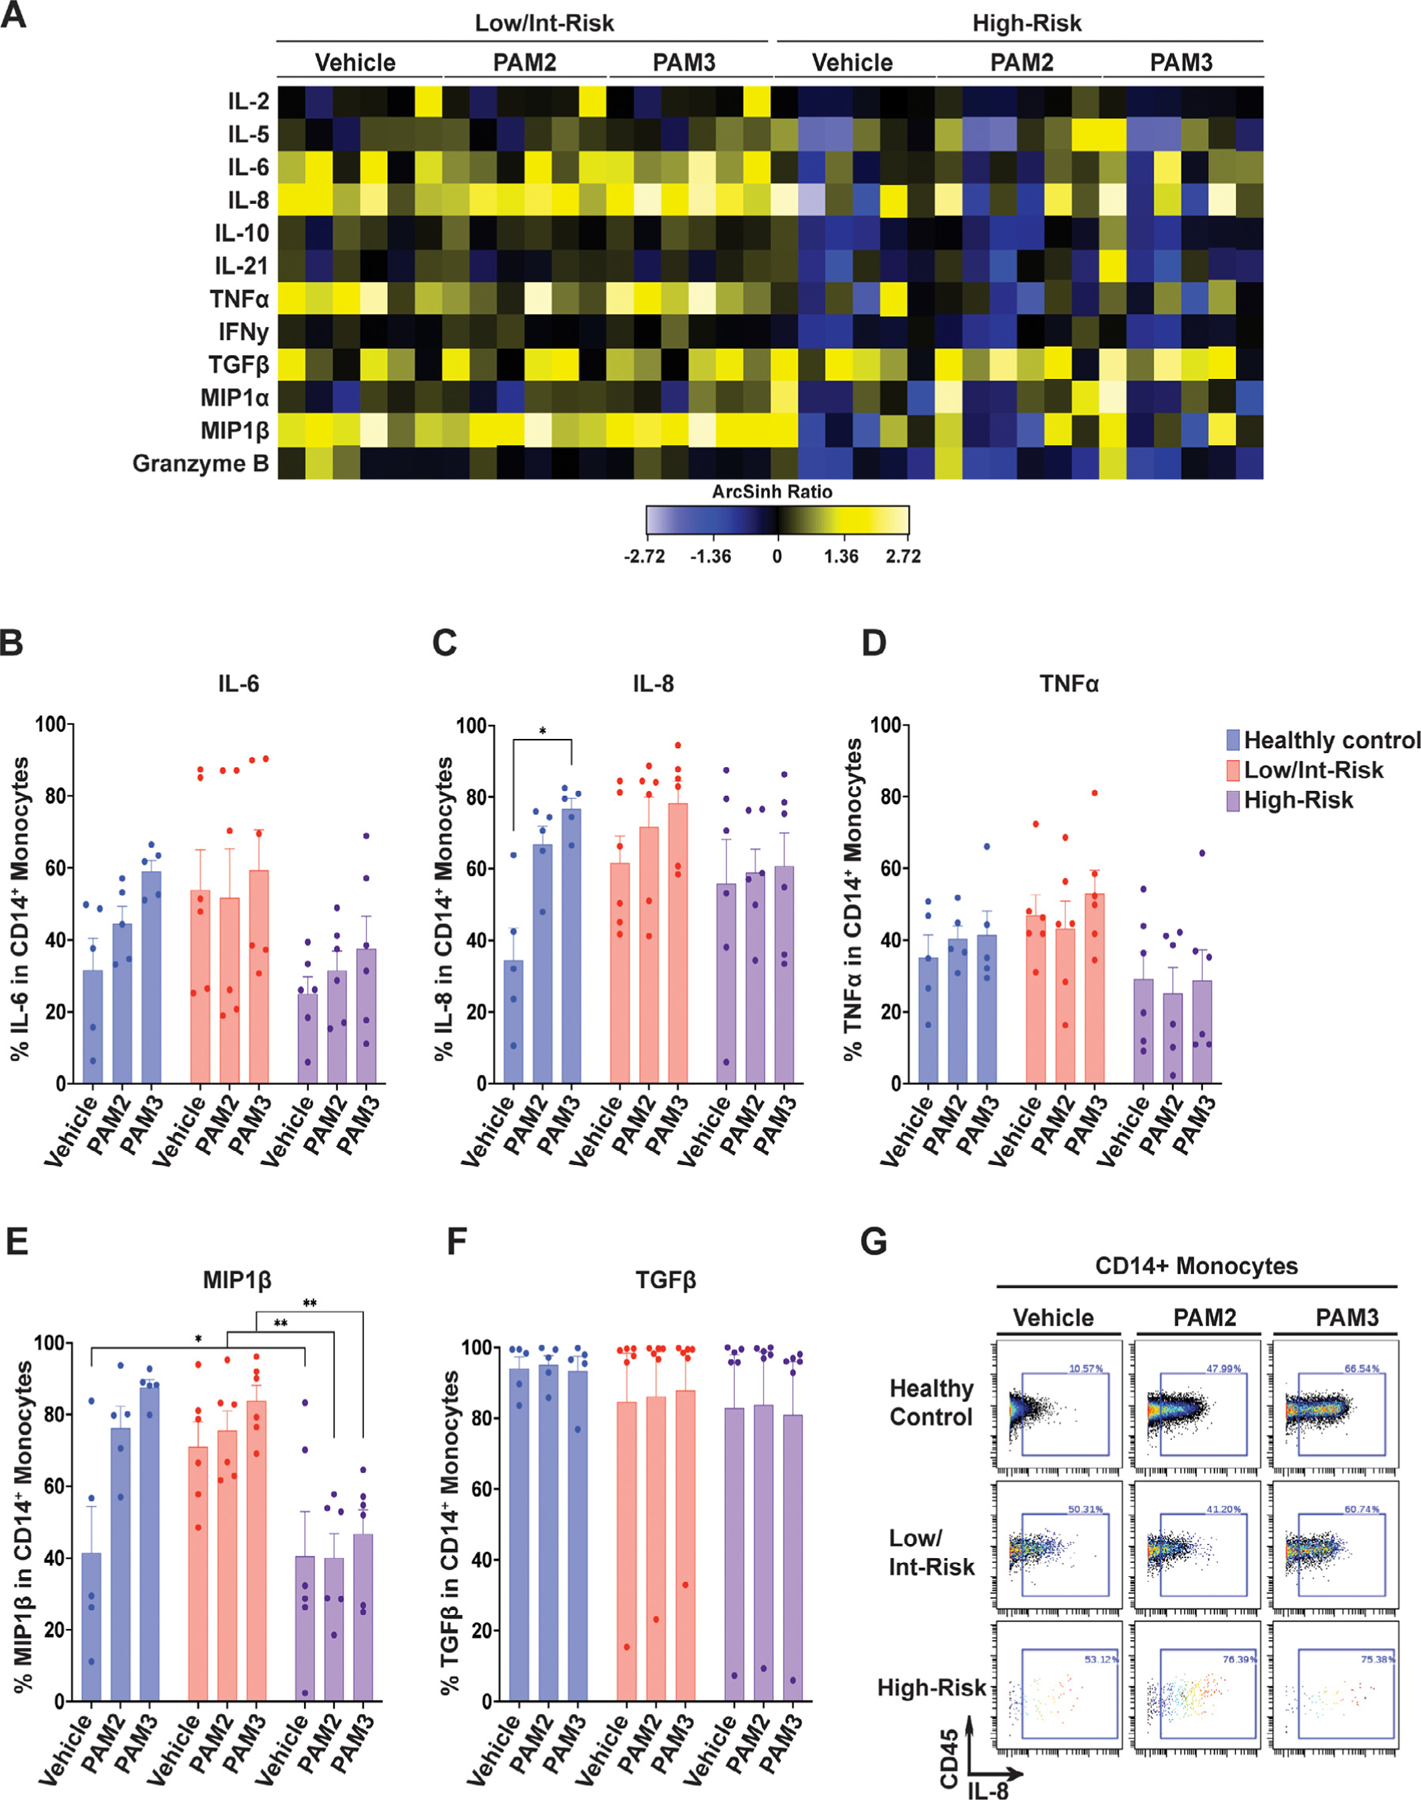
Cytokine expression in CD14+ monocytes. (A) Heatmap of mean staining of the indicated cytokines in CD14+ monocytes in low/intermediate-risk and high-risk patients stimulated with PAM2CSK4 (TLR2/6 agonist), PAM3CSK4 (TLR1/2 agonist), or vehicle controls. Tile colors represent the arcsinh ratio of the mean signal intensity normalized to healthy controls. (B-F) Quantification of the percentage of CD14+ cells expressing the indicated cytokines from the indicated groups, including (B) interleukin (IL)-6, (C) IL-8, (D) tumor necrosis factor α (TNFα), (E) macrophage inflammatory protein 1β (MIP1β), and (F) transforming growth factor β (TGFβ). (G) Biaxial plot illustrating gating for IL-8 in CD14+ monocytes with PAM2CSK4 and PAM3CSK4 in representative healthy control and low/intermediate- and high-risk MDS samples. Statistical significance was determined by two-way analysis of variance followed by Tukey’s multiple comparison test. *p < 0.05; **p < 0.01.
CD8+ T cells from low/intermediate-risk patients produced significantly higher baseline levels of IL-6 than those from high-risk patients (Figure 4A,B). CD19+ B cells from low/intermediate-risk patients produced higher mean baseline levels of multiple cytokines than those from healthy controls (Figure 5A), and had a higher percentage of cells producing TNFα, IL-6, IL-21, and MIP1β, than high-risk MDS or healthy controls (Figure 5B–G). CD56high NK cells from low/intermediate-risk patients also had elevated mean expression values for multiple cytokines (Supplementary Figure E4A, online only, available at www.exphem.org), as well as a higher percentage of cells producing IL-6, TNFα, MIP1β, and interferon γ (IFNγ) than high-risk patients (Supplementary Figure E4B–H). Again, cytokine production in MDS patients was generally not increased in CD8+ T cells, CD19+ B cells, or NK cells with TLR agonist exposure.
Figure 4.
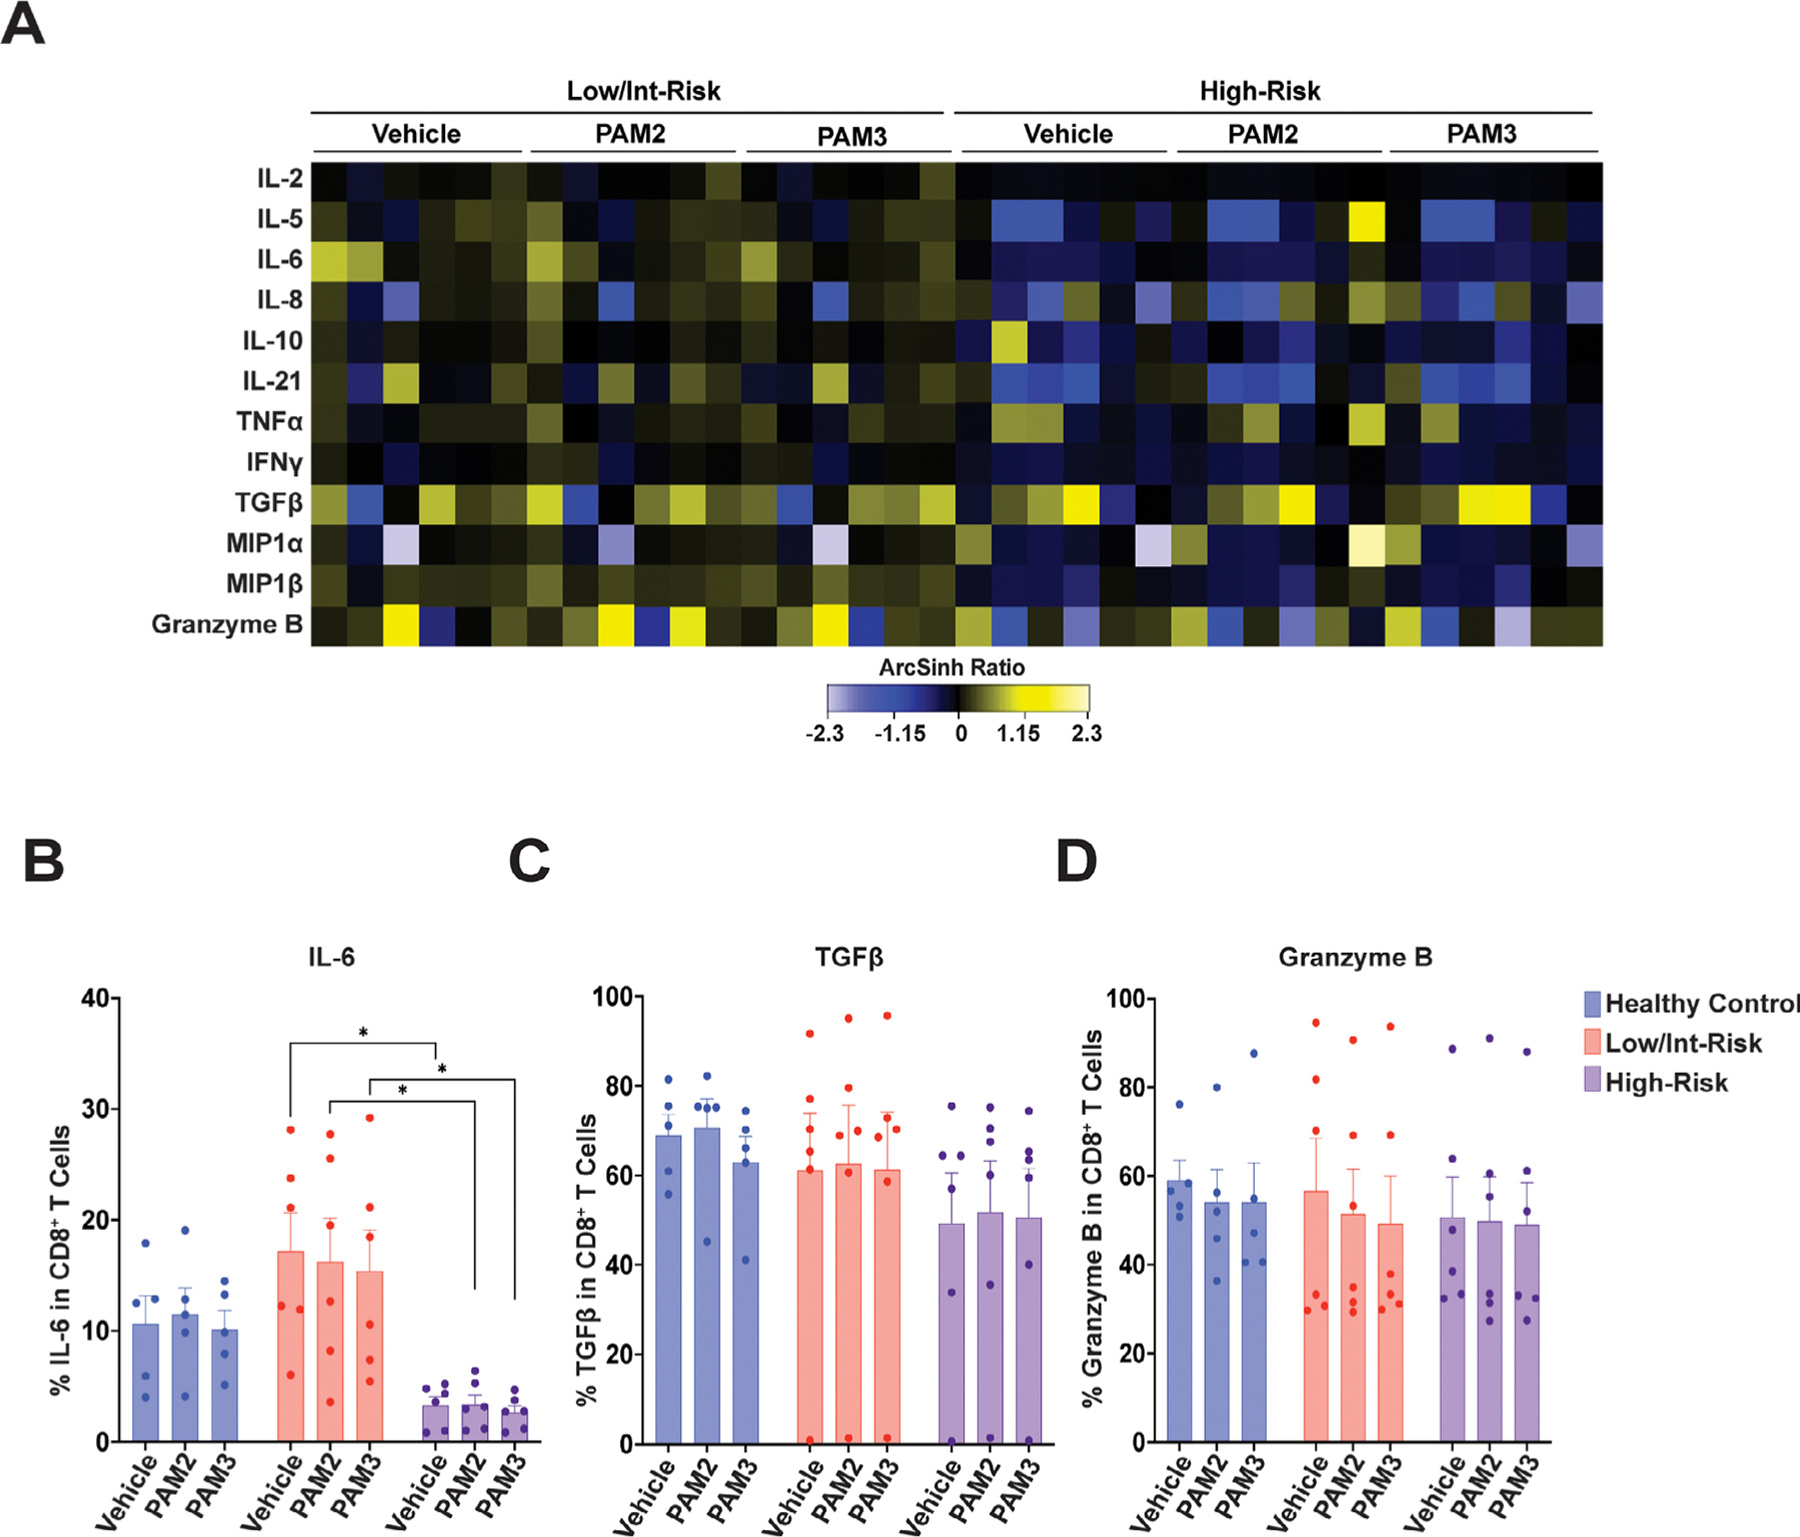
Cytokine expression in CD8+ T cells. (A) Heatmap of mean staining of the indicated cytokines in CD8+ T cells in low/intermediate-risk and high-risk myelodysplastic syndrome (MDS) patients stimulated with PAM2CSK4 (TLR2/6 agonist), PAM3CSK4 (TLR1/2 agonist), or vehicle controls. Tile colors represent the arcsinh ratio of the mean signal intensity normalized to healthy controls. (B–D) Quantification of the percentage of CD8+ T cells expressing the indicated cytokines from the indicated groups, including (B) interleukin (IL-6), (C) transforming growth factor β (TGFβ), and (D) Granzyme B. Statistical significance was determined by two-way analysis of variance followed by Tukey’s multiple comparison test. *p < 0.05. TLR=toll-like receptor.
Figure 5.
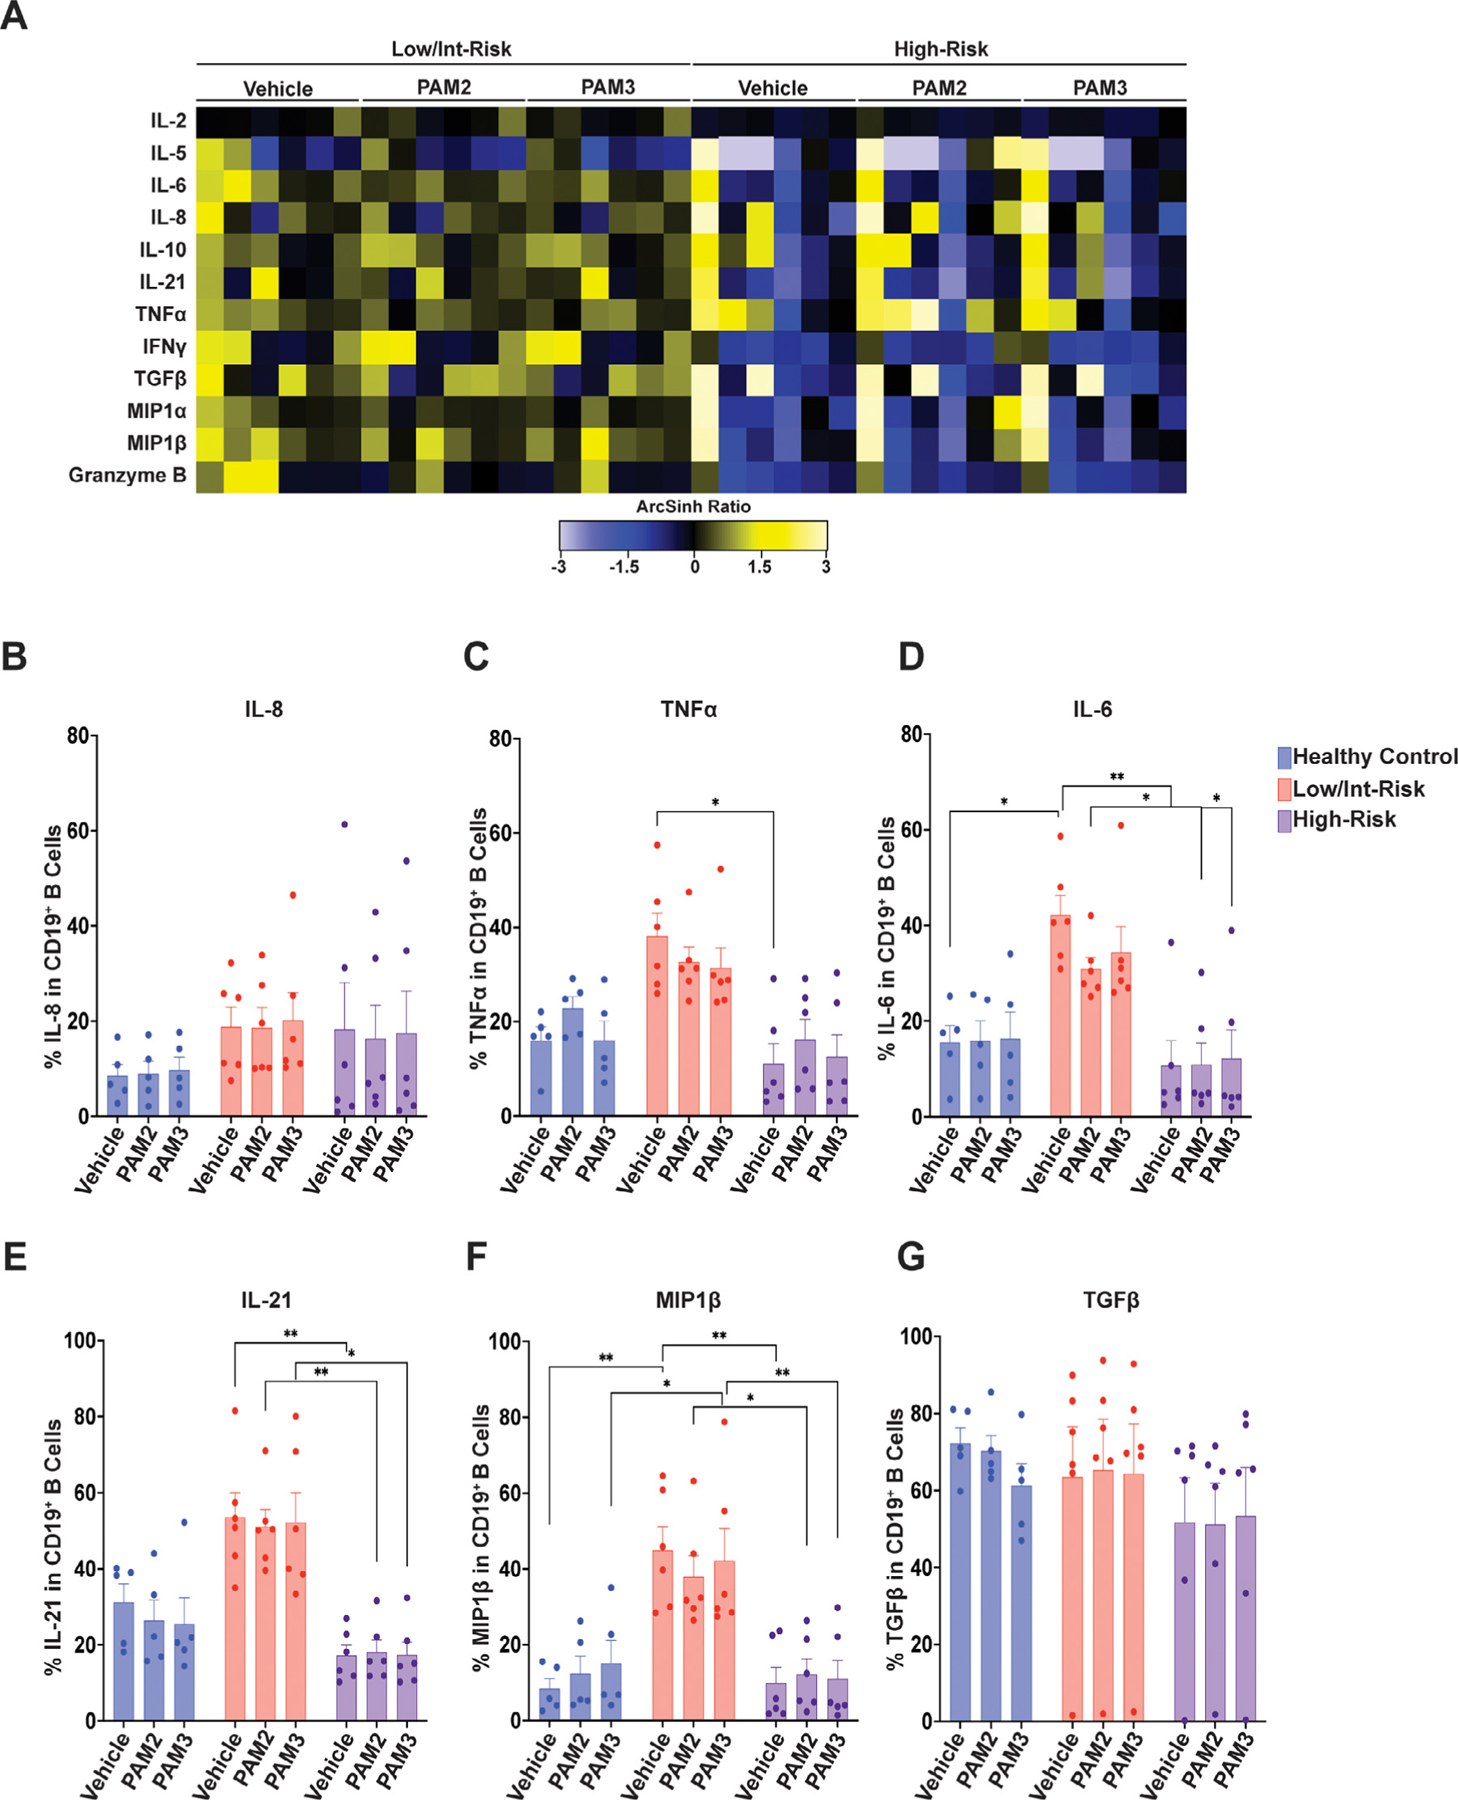
Cytokine expression in CD19+ B cells. (A) Heatmap of mean staining of the indicated cytokines in CD19+ B cells in low/intermediate-risk and high-risk myelodysplastic syndrome (MDS) patients stimulated with PAM2CSK4 (TLR2/6 agonist), PAM3CSK4 (TLR1/2 agonist), or vehicle controls. Tile colors represent the arcsinh ratio of the mean signal intensity normalized to healthy controls. (B-G) Quantification of the percentage of CD19+ B cells expressing the indicated cytokines from the indicated groups, including (B) interleukin (IL)-8, (C) tumor necrosis factor α (TNFα), (D) IL-6, (E) IL-21, (F) macrophage inflammatory protein 1β (MIP1β), and (G) transforming growth factor β (TGFβ). Statistical significance was determined by two-way analysis of variance followed by Tukey’s multiple comparison test. *p < 0.05; **p < 0.01. TLR=toll-like receptor.
Both CD34+CD61+ megakaryoblasts and CD71+CD235+ erythroblasts from low/intermediate-risk patients generated multiple cytokines at higher mean expression values than healthy controls (Supplementary Figure E5A,F, online only, available at www.exphem.org), with significantly more megakaryoblasts from low/intermediate-risk patients WITH MDS producing IL-6, TNFα, and MIP1β than those from high-risk patients (Supplementary Figure E5B–E), and more erythroblasts from low/intermediate-risk patients producing IL-6 and MIP1β than those from high-risk patients (Supplementary Figure E5G–J, online only).
CD16+ granulocytes from low/intermediate-risk patients produced multiple cytokines at higher mean expression values than healthy controls (Supplementary Figure E6A, online only, available at www.exphem.org). Again, cytokine production was not significantly enhanced with TLR agonist treatment (Supplementary Figure E6A–D). Another gated population, CD11b+HLA-DR+CD14−CD16− myeloid cells from low/intermediate-risk patients, similarly generated multiple cytokines (Supplementary Figure E6E), with trends toward more cells producing IL-6 and TNFα than in healthy controls or high-risk patients (Supplementary Figure E6F–H).
Finally, CD34+CD38− cells were notable for robust baseline production of TGFβ in most of the high-risk patients (Figure 6A,H). Also, unlike most of the other cells studied, production of IL-8 and MIP1β trended higher overall with TLR agonist treatment in both controls and MDS samples (including high-risk patients in which TLR2 expression was relatively low; Figure 1D), as seen in Figure 6B, D, and F. This is further illustrated with color coding of individual patients in Supplementary Figure E3D–F. Most of the LR patients and two of the HR patients (HR2, blue dot; HR5, purple dot) produced IL-8 and MIP1β in response to PAM2CSK4 or PAM3CSK4 exposure (Supplementary Figure E3D–F). Overall, the percentage of CD34+CD38− cells expressing IL-6 and MIP1β was higher in the low/intermediate-risk MDS patients than in the high-risk patients with MDS (Figure 6C–H).
Figure 6.
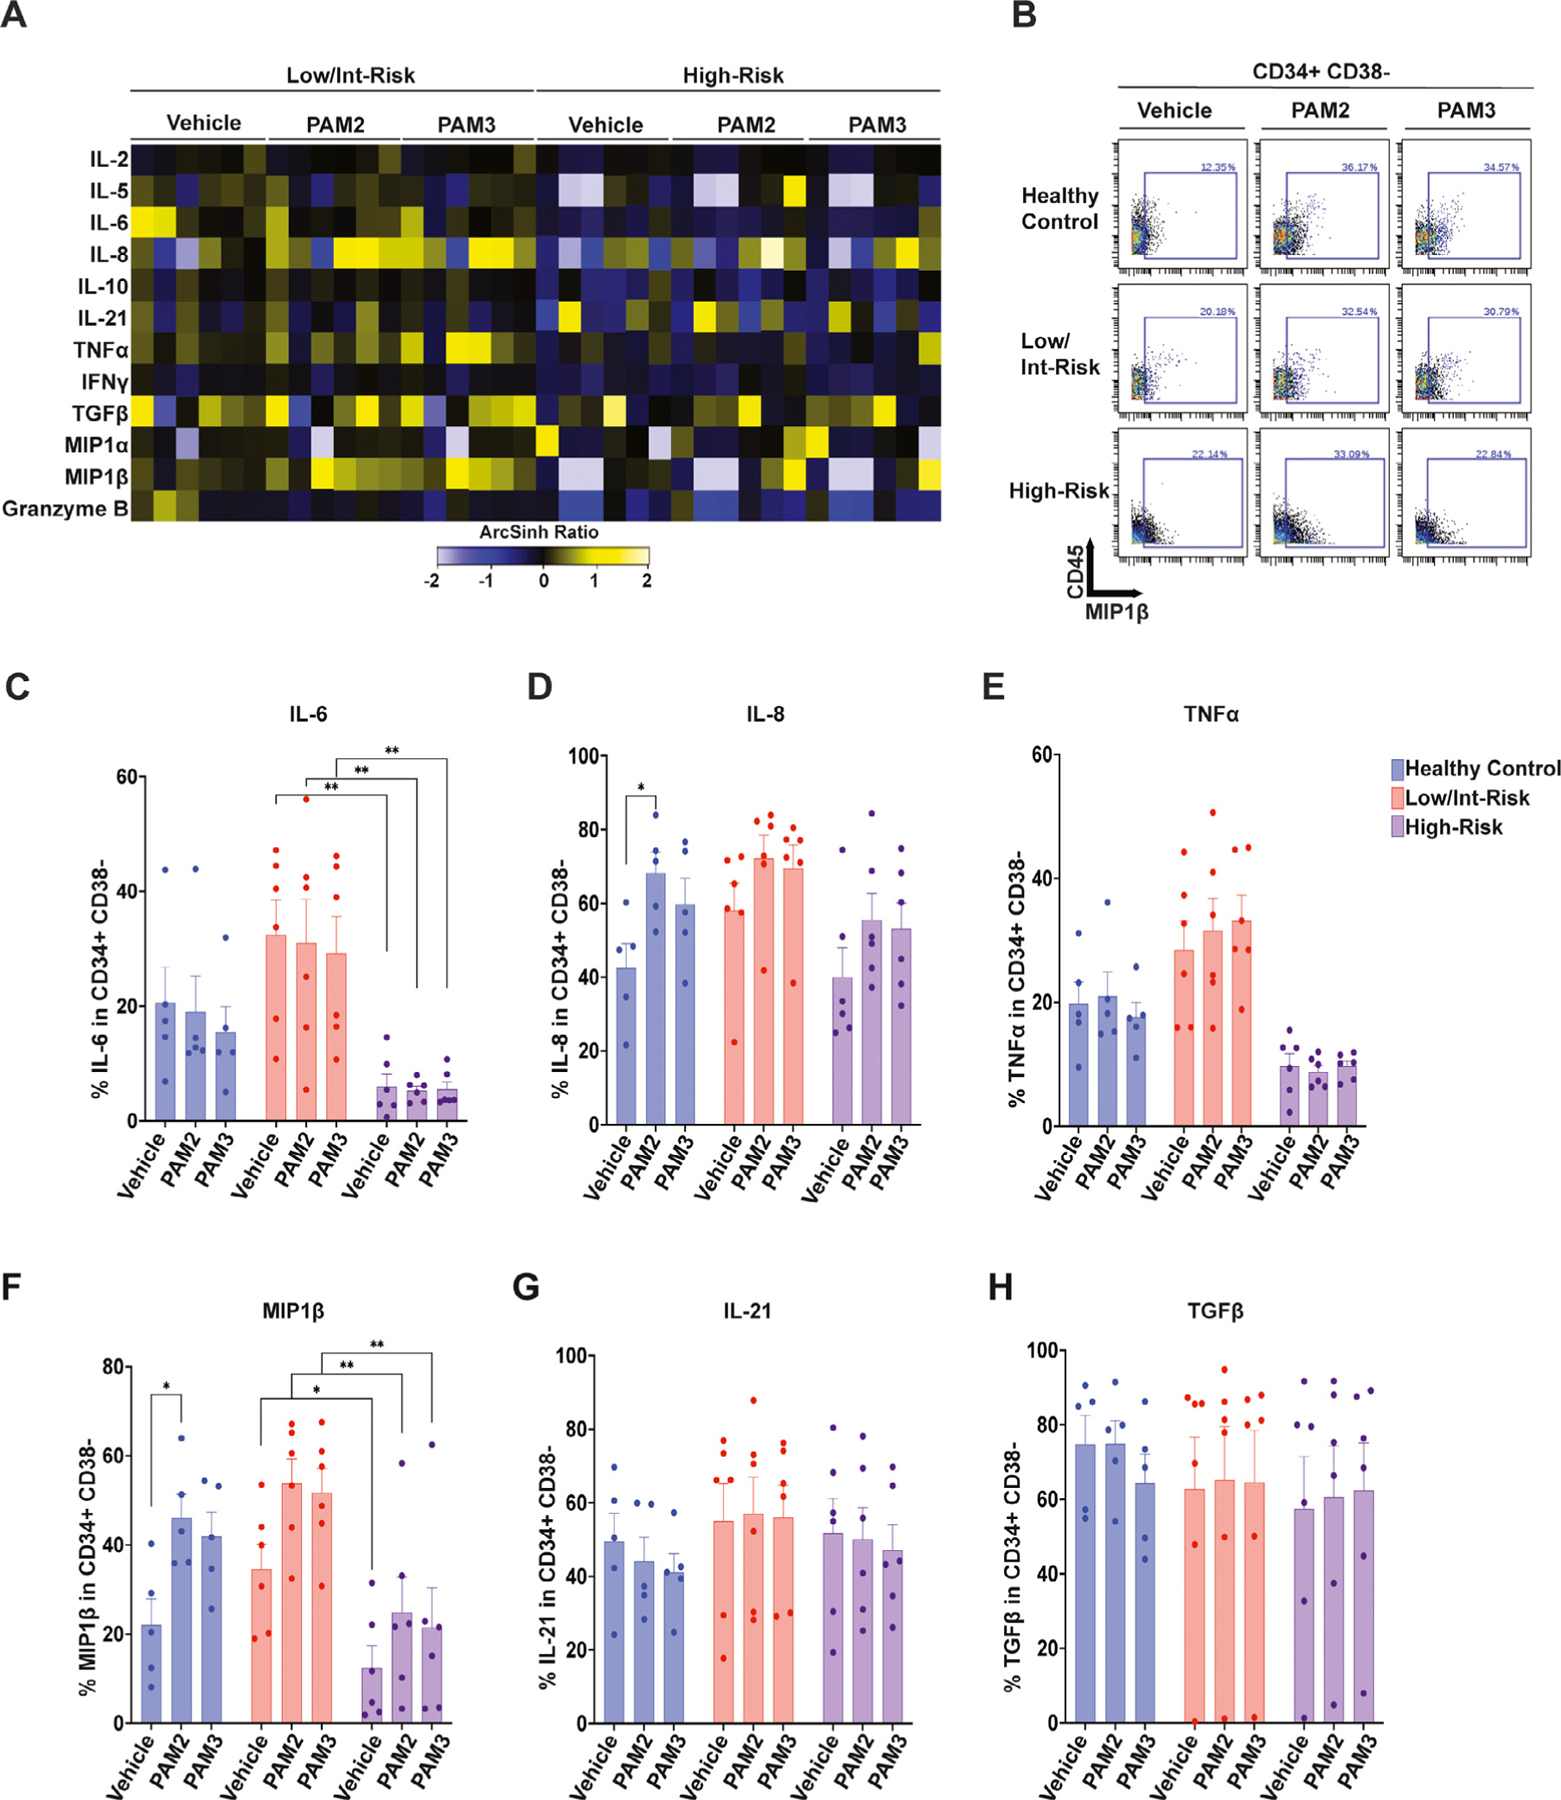
Cytokine expression in CD34+CD38− hematopoietic stem and progenitor cells (HSPCs). (A) Heatmap of mean staining of the indicated cytokines in CD34+CD38− HSPCs in low/intermediate-risk and high-risk myelodysplastic syndrome (MDS) patients stimulated with PAM2CSK4 (TLR2/6 agonist), PAM3CSK4 (TLR1/2 agonist), or vehicle controls. Tile colors represent the arcsinh ratio of the mean signal intensity normalized to healthy controls. (B) Biaxial plot illustrating macrophage inflammatory protein 1β (MIP1 β) expression with PAM2CSK4 and PAM3CSK4 stimulation in representative samples from each cohort. (C–H) Quantification of the percentage of CD34+CD38− cells expressing the indicated cytokines from the indicated groups, including (C) interleukin (IL)-6, (D) IL-8, (E) tumor necrosis factor α (TNFα), (F) macrophage inflammatory protein 1β (MIP1β), (G) IL-21, and (H) transforming growth factor β (TGFβ). Statistical significance was determined by two-way analysis of variance followed by Tukey’s multiple comparison test. *p < 0.05; **p < 0.01. TLR=toll-like receptor.
In addition to analyzing bone marrow cytokine production, we assessed peripheral blood plasma cytokine levels in the same patients with MDS compared with different healthy controls. Using a membrane-based antibody array on a subset of these samples, we detected several different chemokines and proteins in the MDS samples (Figure 7A; Supplementary Figure E7, online only, available at www.exphem.org). CCL5 and SerpinE1 were both significantly increased in low/intermediate-risk patients compared with high-risk patients (Figure 7A). In addition, we performed ELISAs for TGFβ, IL-8, TNFα, and IL-6. Plasma levels of TGFβ were higher in both low/intermediate-risk and high-risk patients with MDS compared with healthy controls, consistent with the higher levels throughout the marrow seen by CyTOF (Figures 2A and 7B). IL-8 levels trended higher in low/intermediate-risk patients than high-risk patients or controls (Figure 7C), and TNFα was significantly increased in low/intermediate-risk patients with MDS compared with high-risk patients (with high-risk patients having a small but significant increase over healthy controls; Figure 7D). IL-6 plasma levels were undetectable by our assays (Figure 7E). As illustrated for several of the patients using viSNE analysis, these cytokines were produced by multiple bone marrow populations (Figure 7F; Supplementary Figure E8, online only, available at www.exphem.org). Of note, plasma and bone marrow cytokine production often did not correlate, with high (or low) plasma levels often corresponding to more restricted (or broad) marrow population production. This is illustrated using color coding for individual patients in Figure 7F, with each patient sample label’s color correlating with the same color dots as in Figure 7B–D. One patient (LR5), for example, who had higher plasma levels of TNFα by ELISA (Figure 7D, red dot) exhibited more restricted expression of TNFα in the bone marrow as analyzed in viSNE (Figure 7F), whereas a patient with lower plasma levels of TNFα (LR1; Figure 7D, dark blue dot) exhibited production more broadly throughout the bone marrow (Figure 7F). As another example, patient LR1 had high plasma IL-8 levels (Figure 7C), but more restricted marrow production than patient LR2 (orange dot), who had low plasma levels of IL-8 but broad expression in the marrow (Figure 7C,F).
Figure 7.
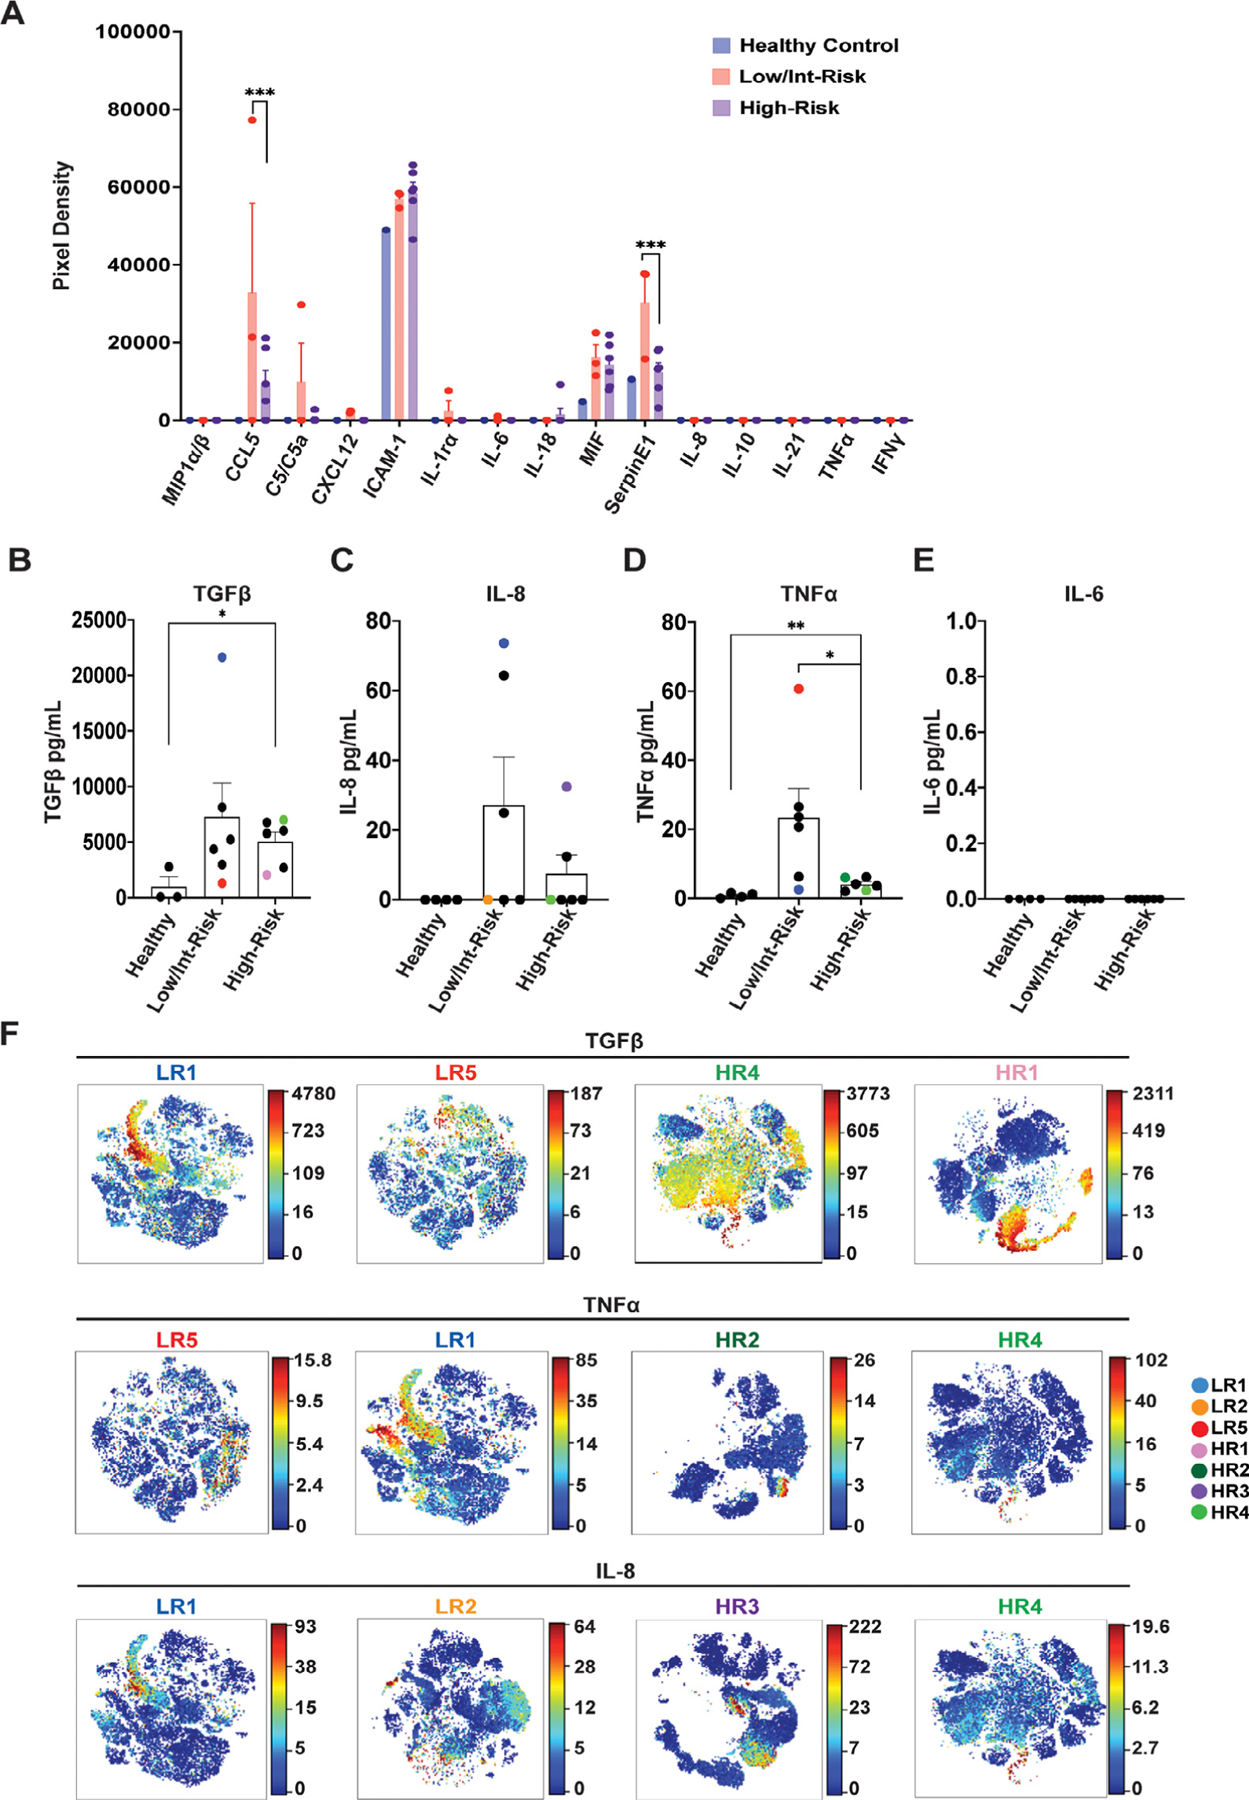
Plasma cytokine levels differ between low- and high-risk myelodysplastic syndromes (MDS). (A) Plasma was analyzed with a membrane cytokine array (Proteome Profiler Human Cytokine Array). Shown are mean pixel densities for each of the indicated cytokines (see also Supplementary Figure E7 [online only] for source blots and full data). (B–E) Peripheral blood plasma from healthy control and low- and high-risk MDS were analyzed for (B) transforming growth factor β (TGFβ), (C) interleukin (IL)-8, (D) tumor necrosis factor α (TNFα), and (E) IL-6. (F) viSNE analysis of the indicated patients showing intracellular production of TGFβ, TNFα, and IL-8. Each patient is represented with a different color, which coordinates with the same color dots in (B–E). See Supplementary Figure E8 (online only) for population legends. Statistical significance was determined with an unpaired t test and two-way analysis of variance followed by Tukey multiple comparison test. *p < 0.05, ***p = 0.0001. LR= low/intermediate-risk; HR= high-risk.
DISCUSSION
To our knowledge, this is the first study to comprehensively evaluate the expression of TLRs and cytokines with single-cell resolution in MDS. Although this study is limited by small sample sizes, we observed several significant and consistent differences between the MDS samples and healthy controls. First, bone marrow cell population frequencies differ between low/ intermediate- and high-risk MDS patients. Second, TLR1, TLR2, and TLR6 are highly expressed in multiple cell types in low/intermediate-risk, but not high-risk, MDS. Third, elevated levels of cytokines were produced by these same cell types in low/intermediate-risk MDS, and further ex vivo exposure to TLR1/2 or TLR2/6 agonists did not enhance cytokine production in most cases. We acknowledge that our healthy controls were younger than the MDS patients, and thus, we cannot rule out the possibility that some of the elevations in TLR or cytokine production in the MDS samples are not age related. However, the low/intermediate- and high-risk MDS patients were of similar age, and therefore, differences between risk groups are not related to age.
Our findings of different cell population frequencies between different MDS risk groups is largely in accordance with a recent study by Behbehani and colleagues showing an increase in HSPCs, B cells, T cells and erythroblasts, and decreased monocytes and neutrophils, in high-risk patients compared with low-risk patients and healthy controls [33]. We similarly detected a trend toward increased CD34+CD38− HSPCs in high-risk patients, as well as a decrease in CD14+ monocytes.
Also consistent with prior reports [3,7], we detected relatively higher expression of TLR1, TLR2, and TLR6 in the CD34+ cells of patients with low/intermediate-risk MDS compared with those with high-risk MDS and healthy controls. As predicted, we also observed elevated expression of these TLRs in multiple other cell populations throughout the bone marrow, including monocytes, granulocytes, B cells, T cells, NK cells, erythroblasts, and megakaryoblasts. Several of the high-risk MDS samples had increased TLR1 and/or TLR6 in some cell populations; however, they were largely unresponsive to TLR agonist treatment, and the relevance of increased expression of either of these TLRs is unclear given that both TLR1 and TLR6 require heterodimerization (primarily with TLR2) to function [34]. Of note, although other TLRs (e.g., TLR4 and TLR9) [4,6] have been implicated in MDS as well, we focused the present study on TLR2 and its binding partners given their known abundance in the CD34+ cells of patients with MDS [3,7] and the interest in targeting TLR2 therapeutically in MDS [16]. Further studies are necessary to determine the expression and ligand responsiveness of other TLRs throughout the bone marrow in MDS.
Interestingly, although control bone marrow cells upregulated multiple cytokines in response to TLR agonist exposure, the cells from patients with MDS were largely unaffected. This finding included low/intermediate-risk MDS cells that exhibited robust expression of TLRs. Chronic exposure to TLR agonists has been reported to induce multiple inhibitory mechanisms to prevent sustained signaling and attenuate the inflammatory response [35,36]. Furthermore, recent studies have indicated that HSPCs bearing mutations associated with MDS employ mechanisms to resist the deleterious effects of inflammation on stem cell function to help them gain a clonal advantage over healthy HSPCs [37–39]. Thus, the lack of enhanced cytokine production in response to TLR agonists could be due to prior chronic exposure (in low/intermediate-risk patients), low TLR expression (in high-risk patients), and/or other cell-intrinsic changes related to the MDS clone. Importantly, CD34+ cells from MDS patients were a notable exception to this rule, with trends toward upregulation of IL-8 and MIP1β in response to TLR stimulation. The reason for the responsiveness of this particular cell type is not clear, but suggests that the regulation of TLR signaling in HSPCs may be distinct from that of other cell types.
A number of studies have identified elevated circulating cytokine levels in patients with MDS compared with healthy controls [24,40–43]. A recent meta-analysis of these data in patients with MDS (including a combination of studies of peripheral blood serum levels and bone marrow plasma levels) found a trend toward increased levels of TNFα and IFNγ in low-risk compared with high-risk patients and a trend toward higher IL-6 in high-risk compared with low-risk patients [32]. We similarly observed higher plasma TNFα in patients with low/intermediate-risk MDS, as well as several other cytokines, compared with high-risk MDS and controls. Notably, the individual cytokines studied were identified in multiple cell types in the bone marrow samples, and the plasma levels of a given cytokine did not necessarily correlate with the breadth of expression in the marrow (e. g., the patient with the highest plasma levels of TNFα had relatively few cell types expressing high levels in the bone marrow, while a patient with lower plasma levels exhibited broad expression in multiple cell types in the marrow). Thus, the plasma levels of cytokines may not accurately represent their local production in the bone marrow niches where they may influence hematopoiesis.
Finally, we found that unlike most cytokines, TGFβ was expressed at high levels in multiple cell types throughout the bone marrow of high-risk MDS patients. Aberrant TGFβ signaling has been implicated in the pathogenesis of MDS, with enhanced signaling contributing to myelosuppression and ineffective erythropoiesis [44]. In fact, several clinical trials have tested the efficacy of TGFβ pathway inhibitors in patients with low- and intermediate-risk MDS, with promising results toward improving anemia in these patients [45–47]. Although the role of TGFβ signaling in high-risk patients is not clear, our data suggest that elevated TGFβ is not exclusive to patients with low-risk disease.
Together, the findings in this study highlight the differential role of inflammation, and specifically TLR expression, in low/intermediate-versus high-risk MDS. These differences in TLR expression and cytokine production should be considered when selecting patients for TLR signaling-directed therapies. Inhibition of TLR2, for example, may only provide benefit to lower-risk patients in whom this TLR is highly expressed by multiple cell types throughout the marrow. That said, further studies are needed to determine the consequences of elevated TLR expression and cytokine production in various cell types throughout the marrow to the pathogenesis of lower-risk MDS, as well as the role of TGFβ in patients with high-risk MDS. Cell type-specific loss of TLRs in mouse models of MDS may help to illuminate the contribution of TLR signaling from different cell populations to the suppression of normal hematopoiesis and progression of the disease. In addition, the mechanisms contributing to elevated TLR and cytokine expression in low/intermediate-risk MDS, as well as the reduced expression in high-risk patients, are not clear and require additional study. Finally, our study was restricted to hematopoietic cells, and thus, further studies are required to address the TLR expression and cytokine production of nonhematopoietic cells within the bone marrow microenvironment (e.g., endothelial cells and mesenchymal stromal cells) that could contribute cell nonautonomously to ineffective hematopoiesis in MDS [48].
Supplementary Material
HIGHLIGHTS.
Bone marrow cell populations differ between low/intermediate- and high-risk MDS.
TLRs are highly expressed in multiple cell types in low/intermediate-risk MDS.
Cytokines were produced by these same cell types in low/intermediate-risk MDS.
Further exposure to TLR agonists did not enhance cytokine production in most MDS.
Acknowledgments
We thank Jin Shao for assistance with sample acquisition. This work was supported, in part, by the Bursky Center for Human Immunology and Immunotherapy Programs at Washington University, Immunomonitoring Laboratory (IML). We thank the Alvin J. Siteman Cancer Center at Washington University School of Medicine and Barnes-Jewish Hospital, St. Louis, Missouri, for the use of the IML, which provided the mass cytometry service. The Siteman Cancer Center is supported in part by National Cancer Institute (NCI) Cancer Center Support Grant No. P30 CA091842. Support for procurement of human MDS samples was provided by the Genomics of AML Program Project of the NCI (P01 CA101937) and the Specialized Program of Research Excellence in AML (P50 CA171963). In addition, this work was supported by grants from the American Cancer Society (RSG-17-166-01-DCC, LGS), the Edward P. Evans Foundation (LGS and MJW), and the NHLBI (1R01 HL134896-01, LGS; 5R01 HL134952-04, STO).
Footnotes
Conflict of Interest Disclosure
The authors declare that they have no competing interests.
REFERENCES
- 1.Jacobs A Myelodysplastic syndromes: pathogenesis, functional abnormalities, and clinical implications. J Clin Pathol 1985;38:1201–17. [DOI] [PMC free article] [PubMed] [Google Scholar]
- 2.Galton DA. The myelodysplastic syndromes. Clin Lab Haematol 1984;6:99–112. [DOI] [PubMed] [Google Scholar]
- 3.Wei Y, Dimicoli S, Bueso-Ramos C, et al. Toll-like receptor alterations in myelodysplastic syndrome. Leukemia 2013;27:1832–40. [DOI] [PMC free article] [PubMed] [Google Scholar]
- 4.Kuninaka N, Kurata M, Yamamoto K, et al. Expression of Toll-like receptor 9 in bone marrow cells of myelodysplastic syndromes is down-regulated during transformation to overt leukemia. Exp Mol Pathol 2010;88:293–8. [DOI] [PubMed] [Google Scholar]
- 5.Dimicoli S, Wei Y, Bueso-Ramos C, et al. Overexpression of the Toll-like receptor (TLR) signaling adaptor MYD88, but lack of genetic mutation, in myelodysplastic syndromes. PloS one 2013;8:e71120. [DOI] [PMC free article] [PubMed] [Google Scholar]
- 6.Maratheftis CI, Andreakos E, Moutsopoulos HM, Voulgarelis M. Toll-like receptor-4 is up-regulated in hematopoietic progenitor cells and contributes to increased apoptosis in myelodysplastic syndromes. Clin Cancer Res 2007;13(4):1154–60. [DOI] [PubMed] [Google Scholar]
- 7.Zeng Q, Shu J, Hu Q, et al. Apoptosis in human myelodysplastic syndrome CD34+ cells is modulated by the upregulation of TLRs and histone H4 acetylation via a beta-arrestin 1 dependent mechanism. Exp Cell Res 2016;340:22–31. [DOI] [PubMed] [Google Scholar]
- 8.Takizawa H, Fritsch K, Kovtonyuk LV, et al. Pathogen-induced TLR4-TRIF innate immune signaling in hematopoietic stem cells promotes proliferation but reduces competitive fitness. Cell Stem Cell 2017;21:225–40. e225. [DOI] [PubMed] [Google Scholar]
- 9.Zhang H, Rodriguez S, Wang L, et al. Sepsis induces hematopoietic stem cell exhaustion and myelosuppression through distinct contributions of TRIF and MYD88. Stem Cell Rep 2016;6:940–56. [DOI] [PMC free article] [PubMed] [Google Scholar]
- 10.Esplin BL, Shimazu T, Welner RS, et al. Chronic exposure to a TLR ligand injures hematopoietic stem cells. J Immunol 2011;186:5367–75. [DOI] [PMC free article] [PubMed] [Google Scholar]
- 11.Nagai Y, Garrett KP, Ohta S, et al. Toll-like receptors on hematopoietic progenitor cells stimulate innate immune system replenishment. Immunity 2006;24:8013812. [DOI] [PMC free article] [PubMed] [Google Scholar]
- 12.Ichii M, Shimazu T, Welner RS, et al. Functional diversity of stem and progenitor cells with B-lymphopoietic potential. Immunol Rev 2010;237: 10–21. [DOI] [PMC free article] [PubMed] [Google Scholar]
- 13.Schuettpelz LG, Borgerding JN, Christopher MJ, et al. G-CSF regulates hematopoietic stem cell activity, in part, through activation of Toll-like receptor signaling. Leukemia 2014;28:1851–60. [DOI] [PMC free article] [PubMed] [Google Scholar]
- 14.Herman AC, Monlish DA, Romine MP, Bhatt ST, Zippel S, Schuettpelz LG. Systemic TLR2 agonist exposure regulates hematopoietic stem cells via cell-autonomous and cell-non-autonomous mechanisms. Blood Cancer J 2016;6:e437. [DOI] [PMC free article] [PubMed] [Google Scholar]
- 15.Megias J, Yanez A, Moriano S, O’Connor JE, Gozalbo D, Gil ML. Direct Toll-like receptor-mediated stimulation of hematopoietic stem and progenitor cells occurs in vivo and promotes differentiation toward macrophages. Stem Cells 2012;30:1486–95. [DOI] [PubMed] [Google Scholar]
- 16.Gil-Perez A, Montalban-Bravo G. Management of myelodysplastic syndromes after failure of response to hypomethylating agents. Ther Adv Hematol 2019;10:2040620719847059. [DOI] [PMC free article] [PubMed] [Google Scholar]
- 17.Zarember KA, Godowski PJ. Tissue expression of human Toll-like receptors and differential regulation of Toll-like receptor mRNAs in leukocytes in response to microbes, their products, and cytokines. J Immunol 2002;168:554–61. [DOI] [PubMed] [Google Scholar]
- 18.Schmid MA, Takizawa H, Baumjohann DR, Saito Y, Manz MG. Bone marrow dendritic cell progenitors sense pathogens via Toll-like receptors and subsequently migrate to inflamed lymph nodes. Blood 2011;118:4829–40. [DOI] [PubMed] [Google Scholar]
- 19.Welner RS, Pelayo R, Nagai Y, et al. Lymphoid precursors are directed to produce dendritic cells as a result of TLR9 ligation during herpes infection. Blood 2008;112:3753–61. [DOI] [PMC free article] [PubMed] [Google Scholar]
- 20.Diesel B, Ripoche N, Risch RT, Tierling S, Walter J, Kiemer AK. Inflammation-induced up-regulation of TLR2 expression in human endothelial cells is independent of differential methylation in the TLR2 promoter CpG island. Innate Immun 2012;18:112–23. [DOI] [PubMed] [Google Scholar]
- 21.Fan J, Frey RS, Malik AB. TLR4 signaling induces TLR2 expression in endothelial cells via neutrophil NADPH oxidase. J Clin Invest 2003;112: 1234–43. [DOI] [PMC free article] [PubMed] [Google Scholar]
- 22.O’Mahony DS, Pham U, Iyer R, Hawn TR, Liles WC. Differential constitutive and cytokine-modulated expression of human Toll-like receptors in primary neutrophils, monocytes, and macrophages. Int J Med Sci 2008;5:1–8. [DOI] [PMC free article] [PubMed] [Google Scholar]
- 23.Velegraki M, Papakonstanti E, Mavroudi I, et al. Impaired clearance of apoptotic cells leads to HMGB1 release in the bone marrow of patients with myelodysplastic syndromes and induces TLR4-mediated cytokine production. Haematologica 2013;98:1206–15. [DOI] [PMC free article] [PubMed] [Google Scholar]
- 24.Pardanani A, Finke C, Lasho TL, et al. IPSS-independent prognostic value of plasma CXCL10, IL-7 and IL-6 levels in myelodysplastic syndromes. Leukemia 2012;26:693–9. [DOI] [PMC free article] [PubMed] [Google Scholar]
- 25.Liu T, Ahmed T, Krysiak K, et al. Haploinsufficiency of multiple del(5q) genes induce B cell abnormalities in mice. Leuk Res 2020;96:106428. [DOI] [PMC free article] [PubMed] [Google Scholar]
- 26.Nilsson L, Astrand-Grundstrom I, Arvidsson I, et al. Isolation and characterization of hematopoietic progenitor/stem cells in 5q-deleted myelodysplastic syndromes: evidence for involvement at the hematopoietic stem cell level. Blood 2000;96:2012–21. [PubMed] [Google Scholar]
- 27.Mortera-Blanco T, Dimitriou M, Woll PS, et al. SF3B1-initiating mutations in MDS-RSs target lymphomyeloid hematopoietic stem cells. Blood 2017;130:881–90. [DOI] [PMC free article] [PubMed] [Google Scholar]
- 28.Ozato K, Tsujimura H, Tamura T. Toll-like receptor signaling and regulation of cytokine gene expression in the immune system. Biotechniques 2002(Suppl):66–8. 70, 72 passim. [PubMed] [Google Scholar]
- 29.Bendall SC, Simonds EF, Qiu P, et al. Single-cell mass cytometry of differential immune and drug responses across a human hematopoietic continuum. Science 2011;332:687–96. [DOI] [PMC free article] [PubMed] [Google Scholar]
- 30.Lin D, Gupta S, Maecker HT. Intracellular cytokine staining on PBMCs using CyTOF mass cytometry. Bio Protoc 2015;5:e1370. [DOI] [PMC free article] [PubMed] [Google Scholar]
- 31.Fisher DAC, Miner CA, Engle EK, et al. Cytokine production in myelofibrosis exhibits differential responsiveness to JAK-STAT, MAP kinase, and NFkappaB signaling. Leukemia 2019;33:1978–95. [DOI] [PMC free article] [PubMed] [Google Scholar]
- 32.Shi X, Zheng Y, Xu L, Cao C, Dong B, Chen X. The inflammatory cytokine profile of myelodysplastic syndromes: A meta-analysis. Medicine (Baltimore) 2019;98:e15844. [DOI] [PMC free article] [PubMed] [Google Scholar]
- 33.Behbehani GK, Finck R, Samusik N, et al. Profiling myelodysplastic syndromes by mass cytometry demonstrates abnormal progenitor cell phenotype and differentiation. Cytometry B Clin Cytom 2020;98:131–45. [DOI] [PMC free article] [PubMed] [Google Scholar]
- 34.Ozinsky A, Underhill DM, Fontenot JD, et al. The repertoire for pattern recognition of pathogens by the innate immune system is defined by cooperation between toll-like receptors. Proc Natl Acad Sci USA 2000;97:13766–71. [DOI] [PMC free article] [PubMed] [Google Scholar]
- 35.Anwar MA, Basith S, Choi S. Negative regulatory approaches to the attenuation of Toll-like receptor signaling. Exp Mol Med 2013;45:e11. [DOI] [PMC free article] [PubMed] [Google Scholar]
- 36.Kondo T, Kawai T, Akira S. Dissecting negative regulation of Toll-like receptor signaling. Trends Immunol 2012;33:449–58. [DOI] [PubMed] [Google Scholar]
- 37.Muto T, Walker CS, Choi K, et al. Adaptive response to inflammation contributes to sustained myelopoiesis and confers a competitive advantage in myelodysplastic syndrome HSCs. Nat Immunol 2020;21:535–45. [DOI] [PMC free article] [PubMed] [Google Scholar]
- 38.Avagyan S, Henninger JE, Mannherz WP, et al. Resistance to inflammation underlies enhanced fitness in clonal hematopoiesis. Science 2021;374:768–72. [DOI] [PubMed] [Google Scholar]
- 39.Hormaechea-Agulla D, Matatall KA, Le DT, et al. Chronic infection drives Dnmt3a-loss-of-function clonal hematopoiesis via IFNgamma signaling. Cell Stem Cell 2021;28:1428–42. e6. [DOI] [PMC free article] [PubMed] [Google Scholar]
- 40.de Matos AG, Ribeiro Junior HL, de Paula Borges D, et al. Interleukin-8 and nuclear factor kappa B are increased and positively correlated in myelodysplastic syndrome. Med Oncol 2017;34:168. [DOI] [PubMed] [Google Scholar]
- 41.Alexandrakis MG, Passam FH, Dambaki K, et al. The assessment of proliferating cell nuclear antigen immunostaining in myelodysplastic syndromes and its prognostic significance. Eur J Histochem 2005;49:27–32. [DOI] [PubMed] [Google Scholar]
- 42.Alexandrakis MG, Passam FH, Pappa CA, et al. Relation between bone marrow angiogenesis and serum levels of angiogenin in patients with myelodysplastic syndromes. Leuk Res 2005;29:41–6. [DOI] [PubMed] [Google Scholar]
- 43.Kittang AO, Sand K, Brenner AK, Rye KP, Bruserud O. The systemic profile of soluble immune mediators in patients with myelodysplastic syndromes. Int J Mol Sci 2016;17:1080. [DOI] [PMC free article] [PubMed] [Google Scholar]
- 44.Bewersdorf JP, Zeidan AM. Transforming growth factor (TGF)-beta pathway as a therapeutic target in lower risk myelodysplastic syndromes. Leukemia 2019;33:1303–12. [DOI] [PubMed] [Google Scholar]
- 45.Platzbecker U, Germing U, Gotze KS, et al. Luspatercept for the treatment of anaemia in patients with lower-risk myelodysplastic syndromes (PACE-MDS): A multicentre, open-label phase 2 dose-finding study with long-term extension study. Lancet Oncol 2017;18:1338–47. [DOI] [PubMed] [Google Scholar]
- 46.Komrokji R, Garcia-Manero G, Ades L, et al. Sotatercept with long-term extension for the treatment of anaemia in patients with lower-risk myelodysplastic syndromes: a phase 2, dose-ranging trial. Lancet Haematol 2018;5:e63–72. [DOI] [PubMed] [Google Scholar]
- 47.Fenaux P, Platzbecker U, Mufti GJ, et al. Luspatercept in patients with lower-risk myelodysplastic syndromes. N Engl J Med 2020;382:140–51. [DOI] [PubMed] [Google Scholar]
- 48.Li AJ, Calvi LM. The microenvironment in myelodysplastic syndromes: niche-mediated disease initiation and progression. Exp Hematol 2017;55:3–18. [DOI] [PMC free article] [PubMed] [Google Scholar]
Associated Data
This section collects any data citations, data availability statements, or supplementary materials included in this article.


