Abstract
The morphology and other phenotypic characteristics of erythrocytes in sickle cell disease (SCD) have been analyzed for decades in patient evaluation. This involves a variety of techniques, including microscopic analysis of stained blood films, flow cytometry, and cell counting. Here, we analyzed SCD blood using imaging flow cytometry (IFC), a technology that combines flow cytometry and microscopy to enable simultaneous rapid-throughput analysis of cellular morphology and cell-surface markers. With IFC, we were able to automate quantification of poikilocytes from SCD blood. An important subpopulation of poikilocytes represented dense cells, although these could not be distinguished from other poikilocytes without first centrifuging the blood through density gradients. In addition, CD71-positive RBCs from SCD patients had two subpopulations: one with high CD71 expression and a puckered morphology and another with lower CD71 expression and biconcave morphology and presumably representing a later stage of differentiation. Some RBCs with puckered morphologies that were strongly positive for DAPI and CD49d were in fact nucleated RBCs. IFC identified more phosphatidylserine-expressing red cells in SCD than did conventional flow cytometry and these could also be divided into two subpopulations. One population had diffuse PS expression and appeared to be composed primarily of RBC ghosts; the other had lower overall PS expression present in intense, punctate dots overlying Howell-Jolly bodies. This study demonstrates that IFC can rapidly reveal and quantify RBC features in SCD that require numerous tedious methods to identify conventionally. Thus, IFC is likely to be a useful technique for evaluating and monitoring SCD.
INTRODUCTION
Sickle cell disease (SCD) is an inherited hemoglobin disorder, typically manifested by vaso-occlusive crises and hemolysis. Sickle hemoglobin ― produced by a single amino acid substitution (Glu6Val) in β-globin (1) ― is prone to polymerization at low oxygen tension, which deforms the red blood cells (RBCs) and makes them more rigid, adhesive, and prone to lysis (2,3). Examination of RBC concentration, morphology, and surface markers is important for patient care, and this is usually accomplished by performing a complete blood count (CBC), examining the blood film microscopically, and analyzing the blood by flow cytometry. However, each of these methods has disadvantages. For example, RBC counters cannot detect surface markers and cell morphology; blood film preparation is laborious and its evaluation is highly subjective and requires extensive experience; and conventional flow cytometry (FC) can detect cell markers but yields little information about morphology. Most CBC machines can detect dense cells ― RBCs with high mean corpuscular hemoglobin concentration (MCHC), another pathologic characteristic of sickle RBCs ― by measuring the volume and hemoglobin concentration of RBCs after they are induced to swell into spheres using a hypotonic solution. Because most dense cells resist swelling, they are detected as cells with small volume and high hemoglobin concentration (4). However, some dense cells do swell, and CBC machines therefore underestimate the dense cell count.
Recently, a new technology called imaging flow cytometry (IFC) has been developed that allows the simultaneous analysis of cell morphology and surface markers. The technique is essentially high-throughput fluorescence and light microscopy, and it has the potential to be developed as a diagnostic tool for clinical use. Several groups had examined RBCs from patients or mice with SCD by IFC (5–8). However, none have successfully distinguished the abnormally shaped sickle RBCs from those with normal morphology, without first inducing RBC sickling by deoxygenation.
In this study, we used IFC to examine RBCs in blood from SCD patients for morphology, dense cells, reticulocytes, nucleated RBCs, phosphatidylserine (PS) exposure, and Howell-Jolly bodies (HJB).
METHODS
Patients and healthy donors.
Collection of blood samples and clinical data from SCD patients at disease baseline was approved by the Institutional Review Board of the University of Washington. All analyses were carried out blinded to the identity and clinical characteristics of the patients. Collection of blood samples from healthy donors was approved by the Western Institutional Review Board. The study was designed and approved in accordance with the ethical standards of the Helsinki Declaration. We analyzed 14 samples from 8 SCD patients and 13 samples from 13 healthy donors. Demographic information for the SCD patients and healthy donors is listed in Supplementary Tables 1 and 2, respectively. Three of the SCD patients donated more than once. The SCD patients were ambulatory outpatients, not suffering from acute disease exacerbation, and had not been transfused within 30 days of blood draw. For the analysis, blood was collected by venipuncture into vacutainer tubes containing 3.2% sodium citrate.
Immunostaining of whole blood
Detailed information about the antibodies and reagents used is listed in Supplementary Table 3.
RBC and reticulocyte detection.
Diluted whole blood [1:10 in phosphate-buffered saline (PBS)] was incubated with antibodies to glycophorin A (CD235a) and transferrin receptor (CD71) for 30 min at room temperature (RT) before the samples were fixed with paraformaldehyde (1% final concentration, eBioscience, San Diego, CA, USA) for 30 min.
Phosphatidylserine (PS) detection.
Diluted whole blood (1:100 in PBS), was incubated for 30 min at RT with an antibody to CD41a (platelet integrin chain αIIb) and with bovine lactadherin to detect PS before being fixed with paraformaldehyde (1% final concentration).
Howell-Jolly body (HJB) identification.
Diluted whole blood (1:10 in PBS) was incubated with antibodies to CD71 and CD45, and with bovine lactadherin for 30 min at RT. The samples were then fixed with paraformaldehyde (1% final concentration) and washed with 1% bovine serum albumin (BSA) in PBS. The samples were permeabilized with 0.1% Triton X-100 (Sigma-Aldrich, USA) for 10 min then washed with 1% BSA in PBS before being labeled with DAPI (4’–6 diamidino-2-phenylindole, Sigma-Aldrich, 3.3 μg/ml final concentration) for 30 min. Cells positive for CD71 and negative for CD45 were sorted by FACSAria (BD Biosciences, San Jose, CA, USA) for further analysis of PS and DAPI staining by IFC.
Nucleated RBCs in peripheral blood.
Diluted whole blood (1:10 in PBS) was incubated with bovine lactadherin and antibodies to CD71, CD45, band 3 (CD233), and α4 integrin (CD49d) for 30 min at RT and fixed with paraformaldehyde (1% final concentration). The samples were washed with PBS containing 1% BSA, permeabilized with 0.1% Triton X-100 (Sigma-Aldrich, USA) for 10 min and washed again before being labeled with DAPI for 30 min.
Dense cells isolation.
Dense cells were isolated by centrifugation of whole blood through a discontinuous Percoll density gradient at 900g for 45 min at 4°C as described previously (9). Dense cells were labeled with a CD235a antibody for IFC analysis.
All samples were analyzed using both an Amnis ImageStreamX Mark II imaging flow cytometer (Luminex Corporation, Seattle, WA, USA) as detailed below and an LSR II conventional flow cytometer (BD Biosciences, San Jose, CA, USA).
Imaging flow cytometry
Data acquisition.
Brightfield images were collected in channels 1 and 9. Fluorochromes were excited with a 405 nm laser at 50 mW, a 488 nm laser at 200 mW, and a 642 nm laser at 150 mW. Data were acquired at 60× magnification and debris were excluded during acquisition. A total of 10,000–50,000 events were collected for each sample. A compensation matrix was created by collecting single color controls to remove spectral overlap.
Image analysis.
ImageStream data were analyzed using IDEAS® software (Version 6.2, Luminex Corporation). Focused objects were initially identified on brightfield images for subsequent analysis by gating for the population with a Gradient RMS value (Gradient RMS_M01_Ch1) equal to or greater than 50. This parameter measures the quality of focus. Single RBCs were identified using the plot of area [Area_Erode (M01, 2)] vs aspect ratio [Aspect Ratio_Erode (M01, 2)] where the gate was defined based on the distinctiveness of the cell population and confirmed by examination of images of individual cells within the population (see Supplementary Figure 1). Amnis technology uses 1 μm polystyrene beads with a signal feedback system to achieve autofocus in flow as the beads are co-injected. As a result, the beads might appear in the images near single cells in a small subset of the population, potentially affecting morphological analysis. To reduce the possibility of this error, single-cell images containing beads were eliminated from analysis through a well-defined image analysis template. To better identify poikilocytes, we used Erode mask (Erode, M01, 2) to reconfigure the region of interest and tightly map the outline of each single cell based on brightfield images.
Identification and quantification of poikilocytes.
Poikilocytes appear elongated and less round when compared to RBCs with normal biconcave shape. They can be separated from the RBCs of normal shape using the features of circularity [Circularity_Erode (M01, 2)] and elongatedness [Elongatedness_Erode (M01, 2)] in the IDEAS® software. Circularity measures the variance in radius (R) of a cell to determine its roundness and elongatedness measures the ratio of length (L) over width (W) of the bounding box around a cell (Figure 1A). The RBCs with low circularity and high elongatedness scores were likely to be poikilocytes or RBCs in side view (orange box in Figure 1B). In addition, poikilocytes appeared larger with lower contrast on the brightfield images when compared to the normally shaped RBCs in side view or perspective angle and they can therefore be further separated using the features of cell area [Area_Erode (M01, 2)] and modulation [Modulation_Erode (M01, 2)] (Figure 1C). Modulation measures the contrast and texture (the change of intensity pattern across a single cell) of an image. Most of the poikilocytes were characterized by high cell area and low modulation values. Note that poikilocytes in side view were difficult to identify based on two-dimensional images. Therefore, only poikilocytes identified in frontal view were used for quantification.
Figure 1. Identification of poikilocytes in blood from SCD patients with imaging flow cytometry (IFC).
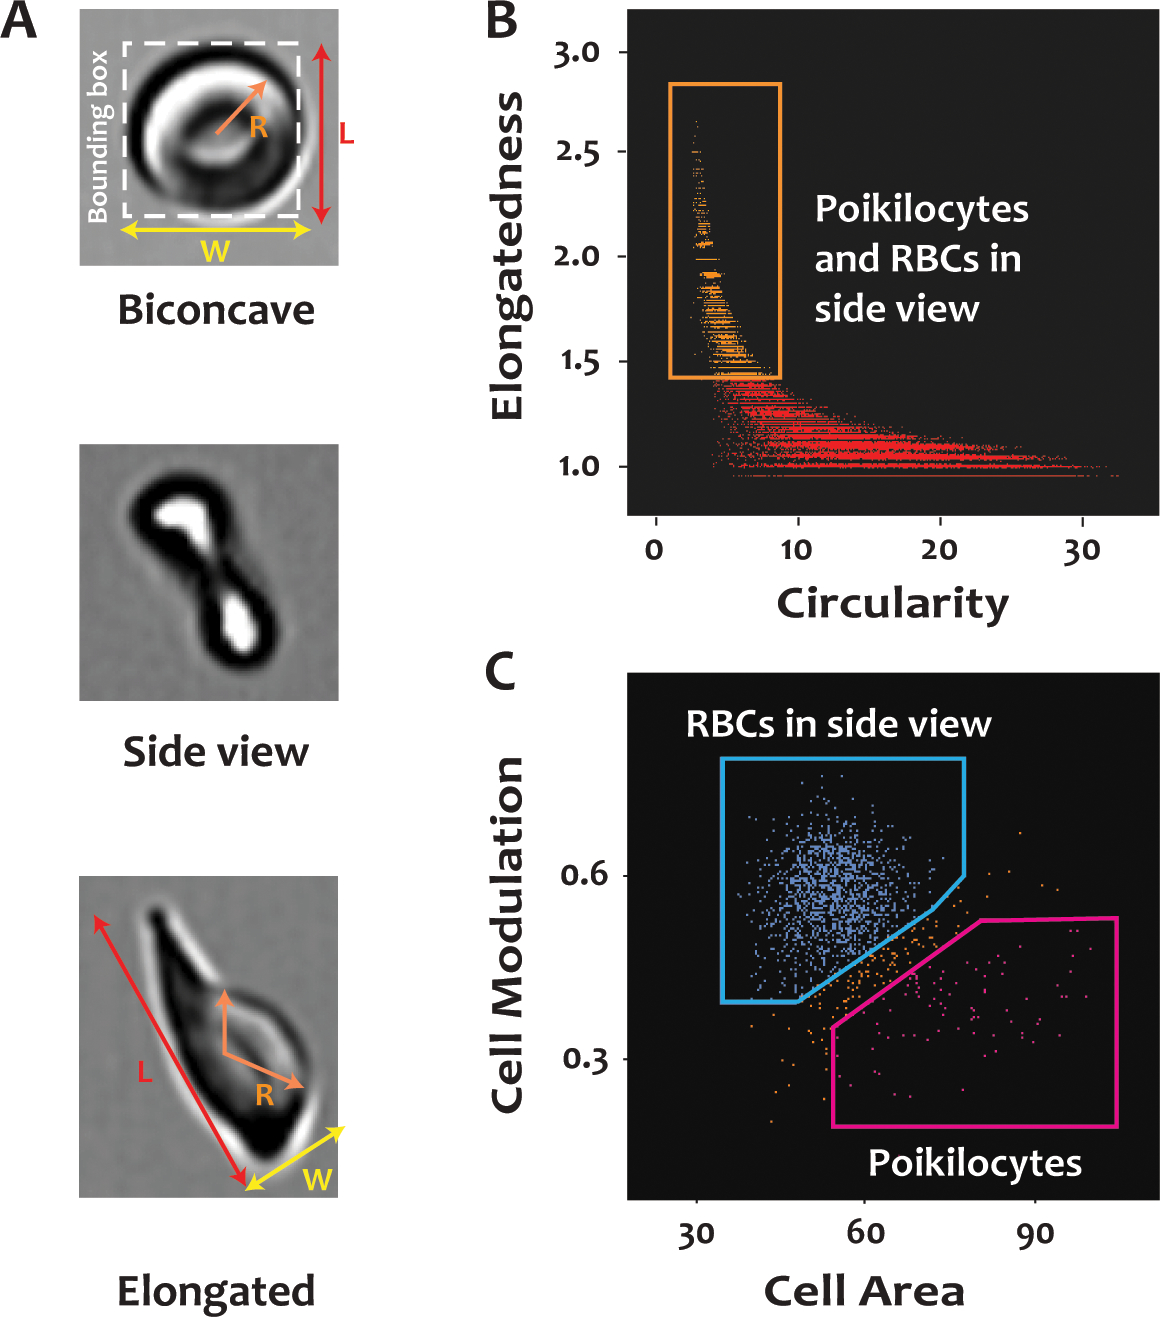
Citrated whole blood from SCD patients was labeled with a FITC-conjugated antibody to CD235a, fixed with paraformaldehyde, and analyzed by IFC. (A) Enlarged images of a normally shaped RBC, a normally shaped RBC in side view, and a poikilocyte. R represents the radius of the cell; L and W are the length and width, respectively, of the bounding box around a cell. (B) Poikilocytes and normally shaped RBCs in side view (in the orange rectangle) have higher scores for elongatedness and lower scores for circularity than the normally shaped RBCs in frontal view. Elongatedness is the ratio of L over W of the bounding box of a cell. Circularity is a measure related to the radial variance of the cells. Biconcave cells have high circularity (low radial variance) whereas poikilocytes have low circularity (high radial variance). (C) Poikilocytes and RBCs in side view (in the orange rectangle) in panel (B) can be distinguished from each other based on cell area and modulation. See more details in METHODS.
Identification and quantification of reticulocytes with different morphologies.
Reticulocytes were identified as CD71-positive RBCs. Two general morphologies characterized reticulocytes: biconcave and “puckered”. Puckered reticulocytes were defined as those in which the plasma membrane had several-to-many surface folds such that the surface-to-volume ratio of the cell was greatly increased. Biconcave reticulocytes, by contrast, had a smooth surface without folds.
Reticulocytes with puckered morphologies in the brightfield images were separated from the biconcave cells using the feature finder tool in the IDEAS® software. This requires users to identify the reticulocytes with different morphologies by tagging the images based on observation and then use the feature finder to rank the Fischer’s discriminant ratio of all combinations of masks and features to determine the best characteristics that distinguish the puckered cells from the biconcave ones. The top two ranked features (H_contrast mean and intensity object) were used to create a scatter plot, and the boundary between the gates of RBCs with puckered morphology and those with biconcave morphology was determined based on the clusters of populations and was verified by examination of the images. H_contrast mean measures the intensity variation in a cell image; intensity object measures the CD71 intensity per cell area.
Identification of PS-positive RBCs.
We used the feature of Bright Detail Intensity R3 (BDI) in IDEAS® software to examine the binding of FITC-conjugated lactadherin to erythrocytes. The BDI is designed specifically to calculate the intensity of bright spots after the local background around the spots is removed. The total fluorescence intensity was low for cells with punctate PS expression. The gated regions were defined and confirmed by examination of cell images.
Statistical Analysis
Before analyzing the data, we averaged values from samples collected on different dates from the same patient to prevent any one individual to be over-represented in the data set. Due to the skewness of our data, we summarized the data by median and interquartile range (IQR), and statistical comparisons were done by the Wilcoxon rank sum test.
RESULTS
Poikilocytes in SCD blood
In blood from healthy individuals, we observed almost exclusively RBCs of normal biconcave shape. In the SCD patients, we also identified RBCs with elongated and irregular shapes of low contrast and intensity in the brightfield images (Figure 2A). We define these cells as poikilocytes. Based on their morphological characteristics, we quantified these cells using the IDEAS® software (see details in METHODS). The percentage of poikilocytes was significantly higher in the SCD patients (median, IQR: 0.984%, 0.567–1.224%, 14 samples from 8 patients) than in healthy donors (0.04%, 0.015–0.055%, p<0.001, 13 samples from 13 donors) (Figure 2B). The RBCs identified as poikilocytes in healthy donors resembled acanthocytes or echinocytes and were probably an artifact of sample preparation (Supplementary Figure 2).
Figure 2. Poikilocytes in patients with SCD.
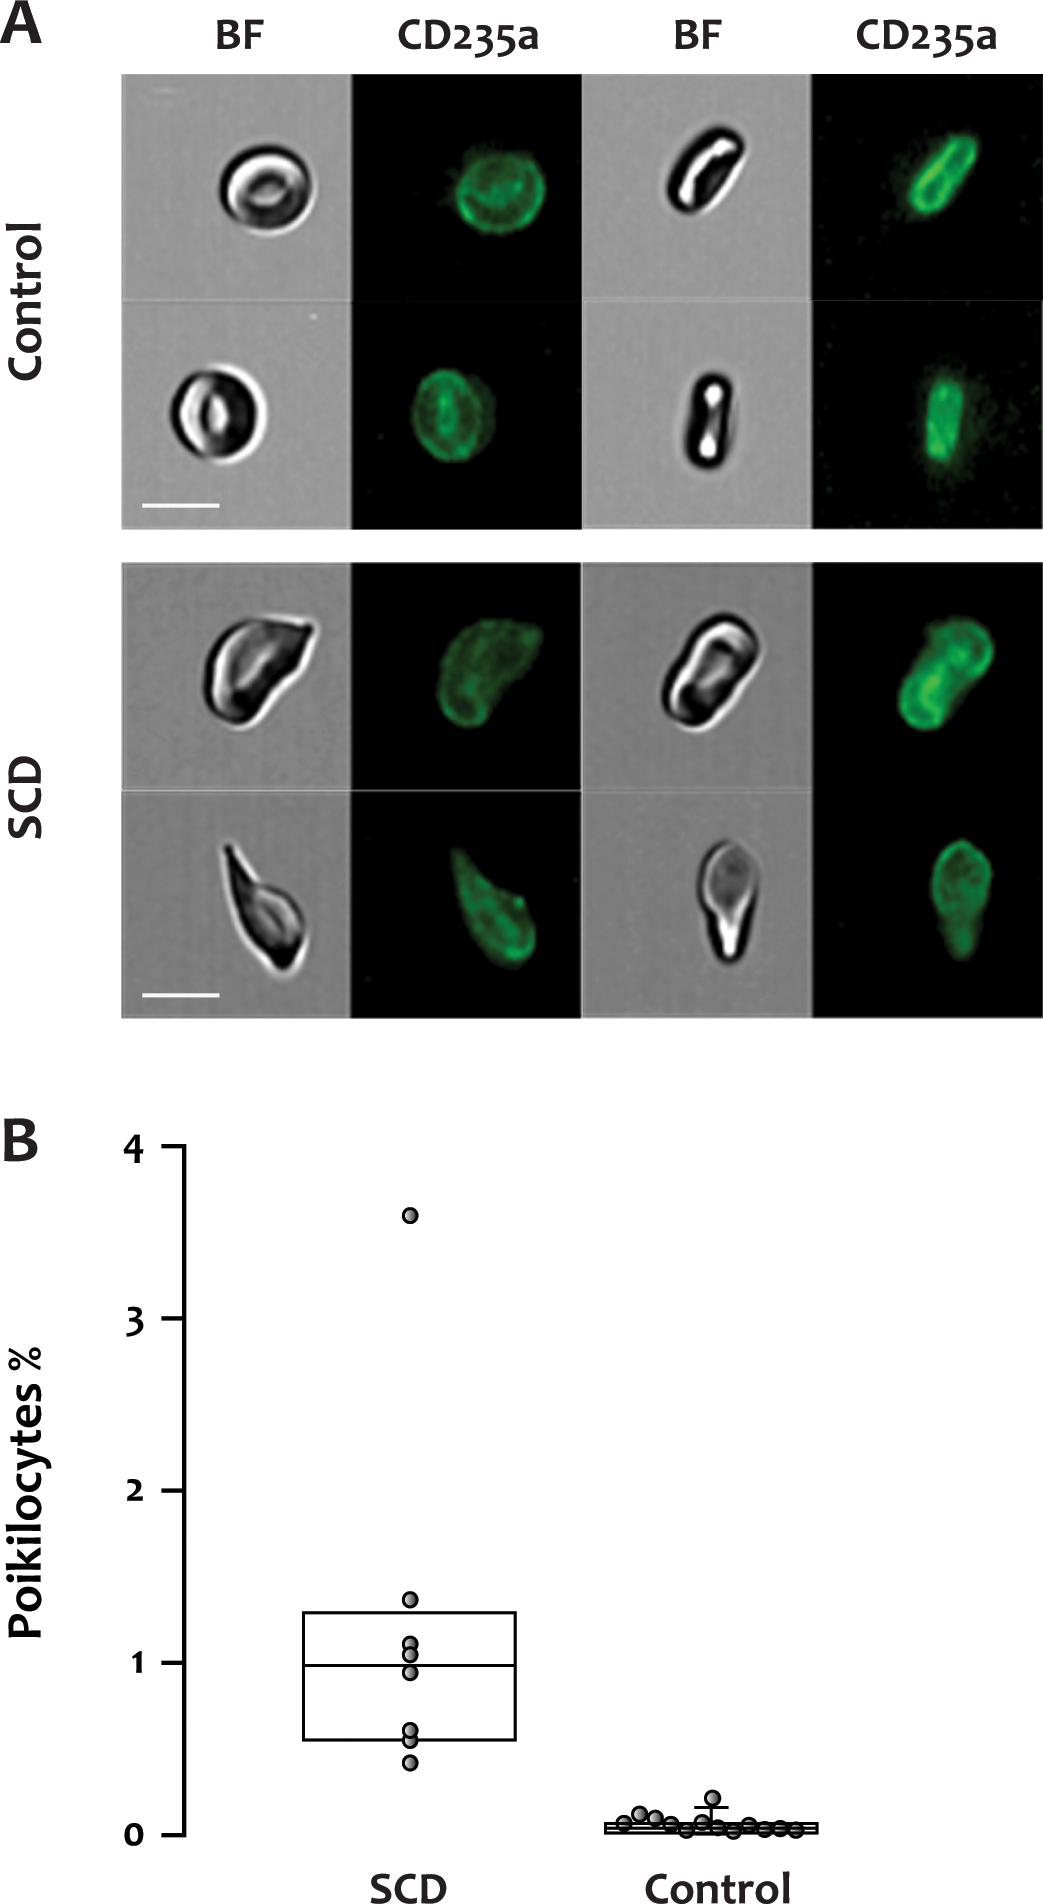
(A) Representative fluorescent and brightfield images of normally shaped RBCs from a healthy donor or poikilocytes from an SCD patient. BF: brightfield, CD235a: glycophorin A, scale bar: 7 μm. (B) The percentage of poikilocytes was significantly higher in the SCD patients (median, IQR: 0.984%, 0.567–1.224%, 14 samples from 8 patients) than in healthy donors (0.04%, 0.015–0.055%, p<0.001, 13 samples from 13 donors).
Morphology of dense cells
It is known that the Gárdos channel is more active in the RBCs of SCD patients, resulting in RBC dehydration and dense cell formation (10). In this study, we isolated the dense cells by centrifugation through Percoll density gradients as previously described (9) and examined their morphologies with IFC. As shown in Figure 3, the morphologies of the dense cells were similar to those of the poikilocytes shown in Figure 2A, but they appeared more contracted and flattened in the brightfield images. We were unable to determine whether every poikilocyte is a dense cell or if a separate population of non-dense poikilocytes exists.
Figure 3. Dense cell morphology.
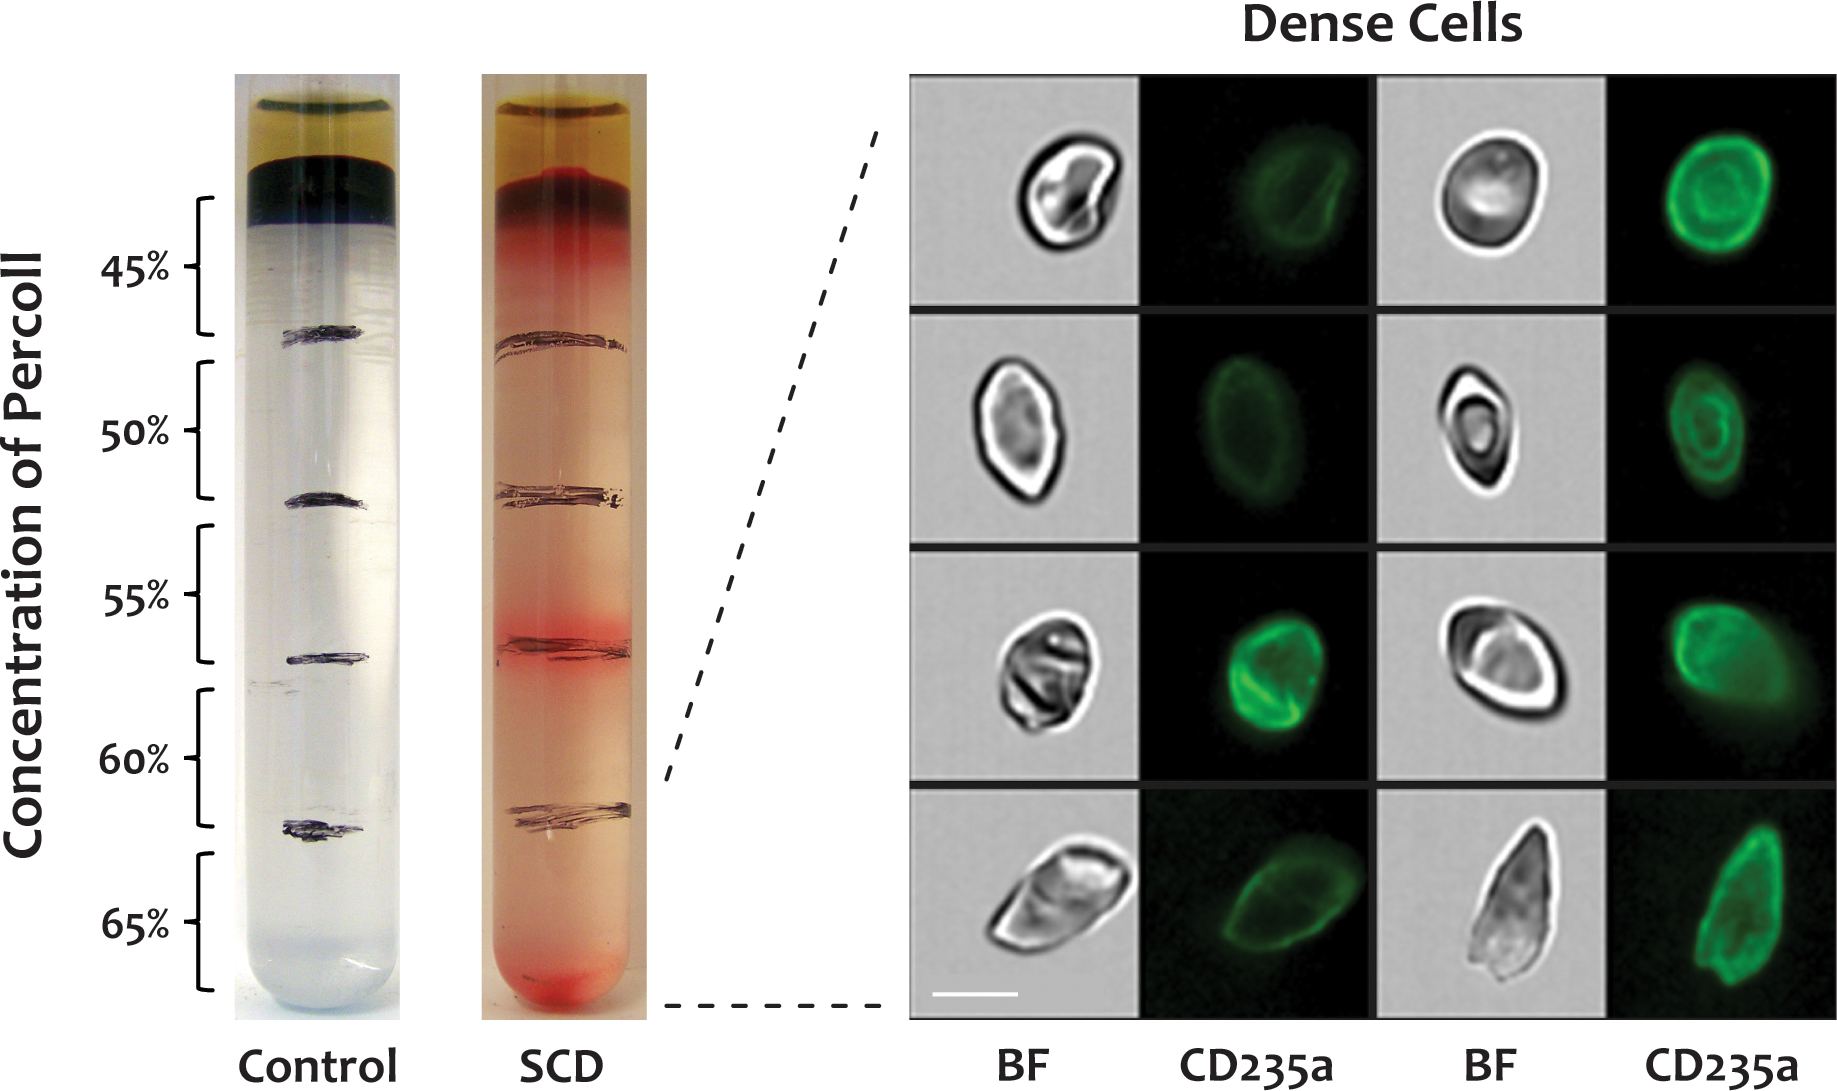
Dense cells were isolated by centrifuging whole blood from SCD patients through a discontinuous Percoll density gradient, labeled with a FITC-conjugated antibody to CD235a, and analyzed by IFC. The dense cells in the bottom fraction (65%) of the Percoll density gradient displayed diverse morphologies, similar to poikilocytes in whole blood. There were no dense cells in blood from healthy donors. BF: brightfield, CD235a: glycophorin A, scale bar: 7 μm.
Reticulocytes and nucleated RBCs in peripheral blood
Reticulocytes are immature RBCs newly released from the bone marrow that contain cytoplasmic nucleic acid, express transferrin receptor (CD71), and have excess cell membrane compared to mature RBCs (11–14). Here we used IFC to simultaneously examine the CD71 expression level and morphology of reticulocytes (Figure 4) in blood from SCD patients and healthy donors.
Figure 4. Morphologies of CD71-positive RBCs in SCD blood.
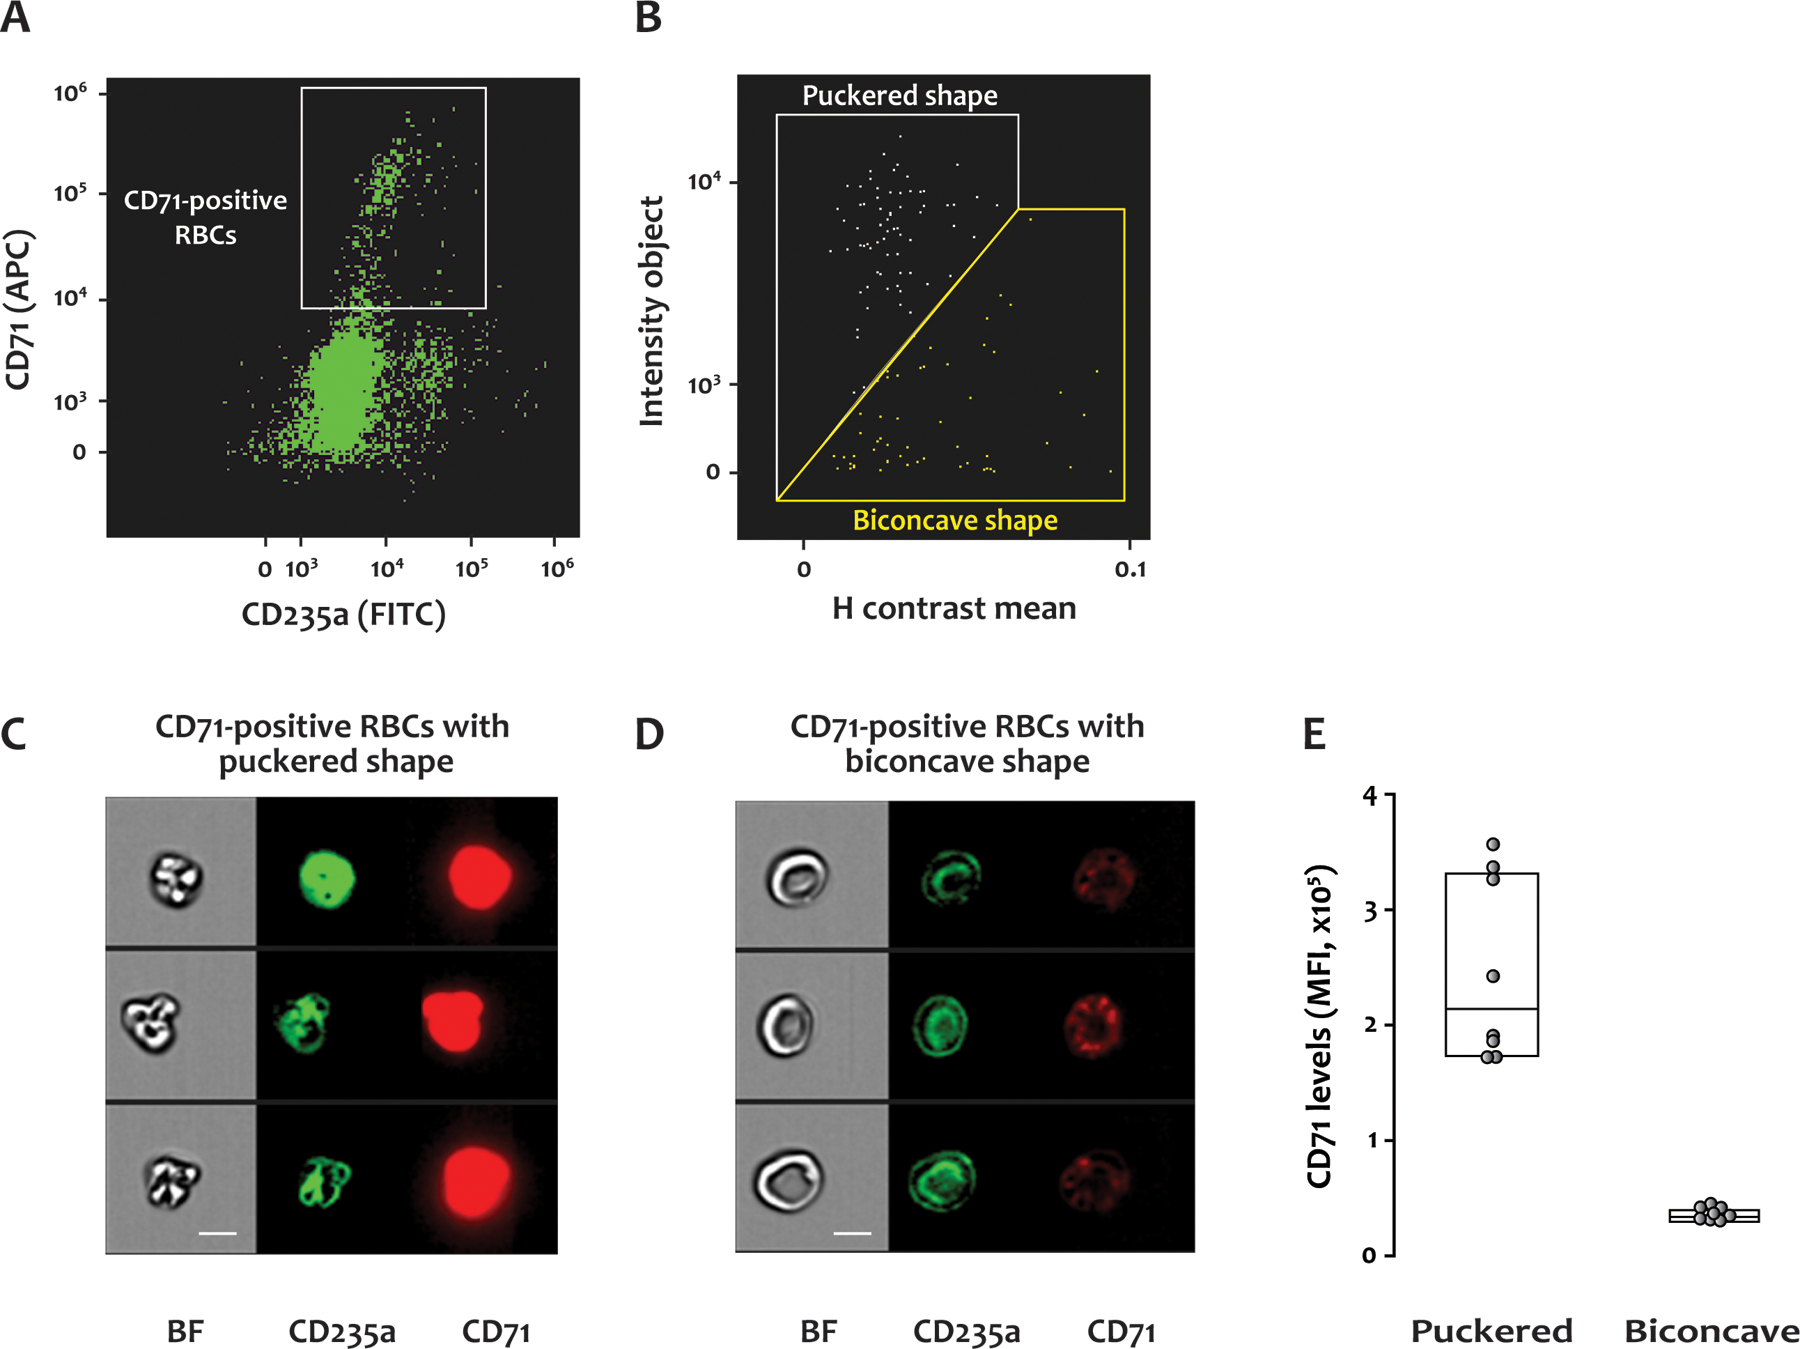
Citrated whole blood from SCD patients was labeled with antibodies to CD235a (FITC) and CD71 (APC), fixed with paraformaldehyde, and analyzed by IFC. (A) A scatter plot of RBCs with a gate for those positive for CD71. (B) CD71-positive RBCs with puckered shape were separated from those with biconcave shape using the plot of H contrast mean vs intensity object. (C) and (D) show representative brightfield and fluorescent images of the CD71-positive RBCs with puckered and biconcave morphologies, respectively. BF: brightfield, CD235a: glycophorin A, CD71: transferrin receptor, scale bar: 7 μm. (E) The level of CD71 was higher on the cells with puckered morphology than those with biconcave shape. MFI: Mean fluorescence intensity. Fourteen samples from 8 SCD patients were examined by IFC.
Consistent with earlier findings (15–17), the percentage of CD71-positive RBCs in the blood of SCD patients (2.02%, 1.16–2.81%) detected by IFC was significantly higher than in healthy donors (0.09%, 0.05–0.11%) (p<0.001). Similarly, parallel blood samples analyzed by FC showed a higher percentage of CD71-positive RBCs in SCD patients (3.15%, 1.57–3.80%) than in healthy donors (0.24%, 0.14–0.30%) (p<0.001). In addition to the biconcave cells, the SCD blood contained CD71-positive RBCs with puckered morphologies (Figure 4B–4D); puckered RBC morphology was not observed in the RBCs from healthy donors. Interestingly, the puckered RBCs expressed much higher CD71 levels than those of biconcave shape (Figure 4E, p<0.001).
Because SCD patients have increased erythropoiesis with nucleated RBCs in the circulation, we investigated the relationship of the puckered RBCs to nucleated RBCs by staining SCD blood with antibodies to CD233 (band 3), CD71, CD49d (α4-integrin), CD45, and DAPI (Figure 5). Cells positive for CD45 were excluded from the analysis. The DAPI and CD49d signals distinguished two distinct populations within the CD71-positive RBCs with puckered morphologies: one was positive for both DAPI and CD49d (B gate in Figure 5A, images in Figure 5B) and represented nucleated RBCs, and the other was negative for both markers (C gate in Figure 5A and images in Figure 5C). We did not observe any RBCs positive for both DAPI and CD49d in the blood of healthy donors (not shown). Therefore, with IFC we were able to detect RBCs in different stages of maturation, including nucleated RBCs (erythroblasts) in the blood of SCD patients.
Figure 5. Nucleated RBCs in SCD blood.
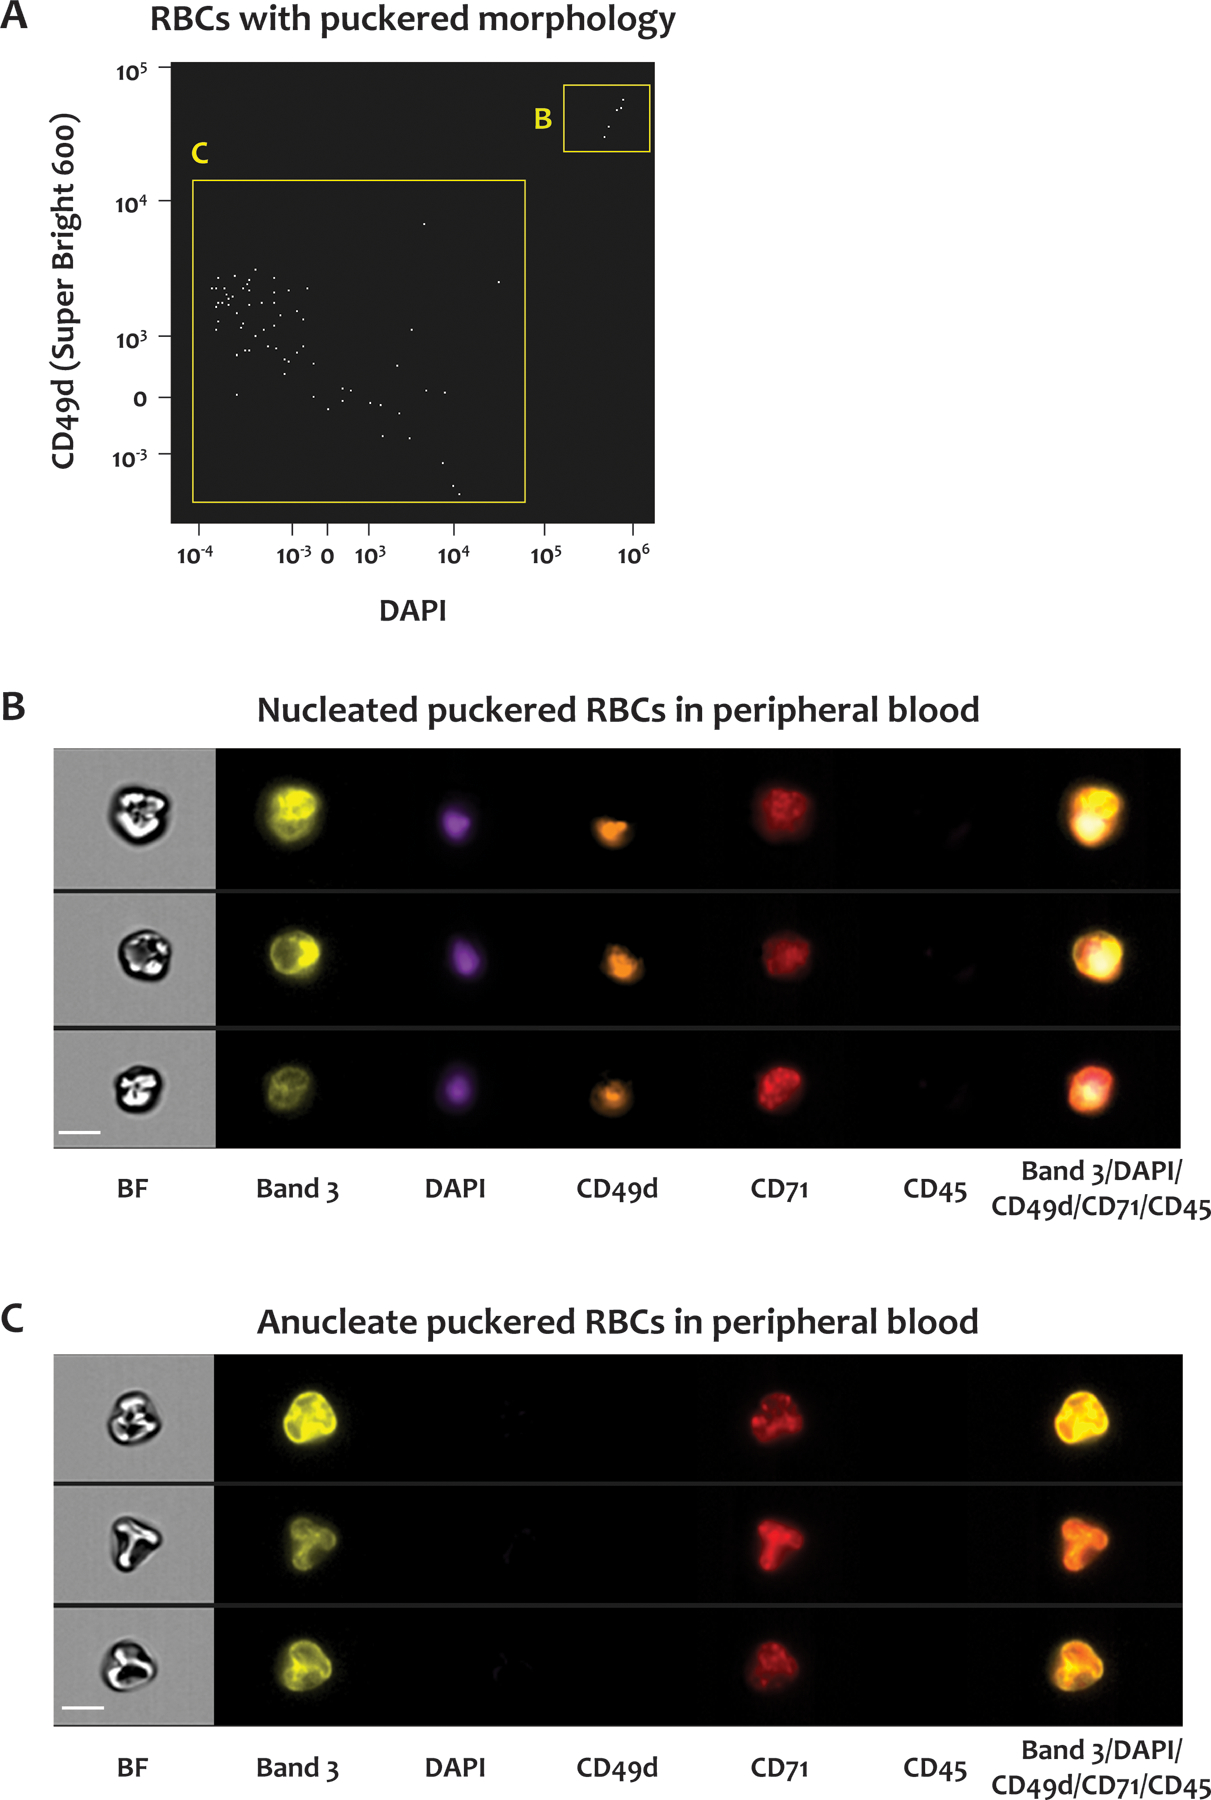
Whole blood from SCD patients was stained for CD45, CD71, DNA, CD233 and CD49d. (A) Scatter plot of DAPI signals versus CD49d signals of CD71-positive RBCs with puckered morphologies. The RBCs in the B and C gates were positive and negative for both DAPI and CD49d, respectively. Representative brightfield and fluorescent images of the RBCs in the B and C gates in (A) are shown in panels (B) and (C), respectively. BF: brightfield, CD233: band 3, CD49d: α–4 integrin, CD71: transferrin receptor, CD45: leukocyte common antigen. Scale bar: 7 μm.
Phosphatidylserine (PS) exposure on RBCs, and Howell-Jolly Bodies
We next examined PS exposure on RBCs by labeling the blood with FITC-conjugated lactadherin and with an antibody to CD41a (platelet marker) to exclude the possibility that the positive PS signals were caused by the adhesion of PS-positive platelets to the RBCs. Parallel samples were examined by FC and IFC. By FC, RBCs were identified by size in the forward vs side scatter plot (not shown). By IFC, RBCs were identified in the plot of aspect ratio vs area, as shown in Supplementary Figure 1. The SCD patients had a significantly higher percentage of PS-positive RBCs than the healthy donors, as measured by IFC (p = 0.003) but not by FC (p = 0.06) (Figure 6A). This difference was almost entirely due to the enhanced sensitivity of IFC for detecting PS-positive RBCs in the SCD samples [median, 1.51% for IFC vs 0.53% for FC, p = 0.012 (Figure 6A)]. PS-positive RBCs in the SCD samples had two distinct patterns of PS distribution (Figure 6B): high and low PS signals, corresponding to diffuse PS exposure throughout the plasma membrane and punctate PS exposure, usually with 1 to 3 spots of highly concentrated PS (Figures 6C and 6D), respectively. Those RBCs with diffuse PS distribution appeared to be primarily membrane ghosts lacking cytoplasm (Figure 6C). Conversely, for the RBCs with low PS exposure, the lactadherin binding was localized to small foci on the membrane of normal-appearing biconcave RBCs (Figure 6D). The percentage of RBCs with the punctate or diffuse PS pattern was much higher in SCD patients than in healthy donors [for RBCs with punctate PS pattern: SCD 1.4%, (1.01–2.81%) vs healthy donors 0.28%, (0.17–0.72%), p = 0.003; for RBCs with diffuse PS distribution: SCD 0.21% (0.09–0.75%) vs healthy donors 0.01% (0–0.11%), (p = 0.025).]
Figure 6. Phosphatidylserine (PS) exposure on RBCs from SCD patients and healthy donors.
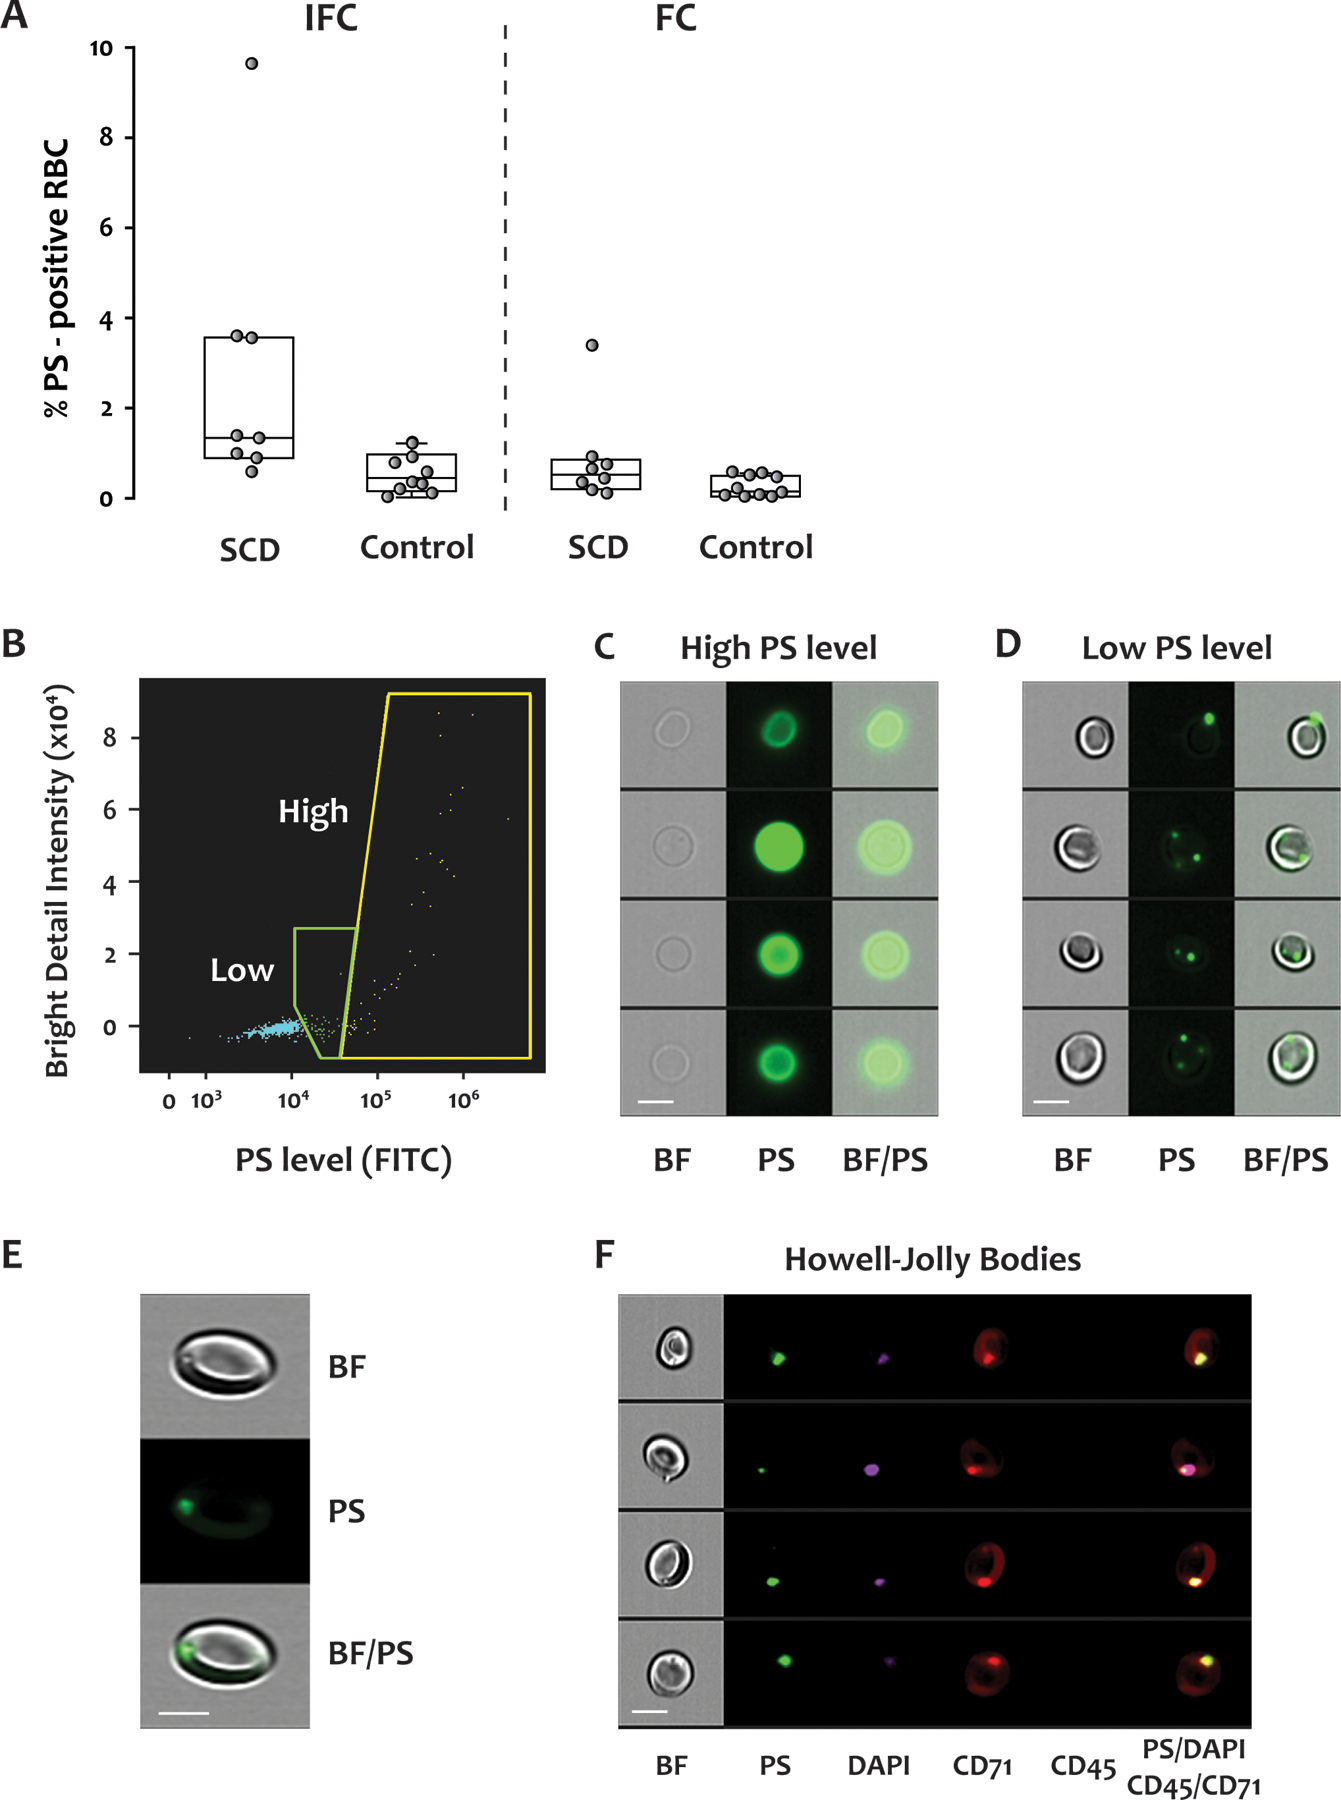
FITC-conjugated lactadherin was used to detect PS exposure in blood from SCD patients and healthy donors. The samples were analyzed by both IFC and FC. Representative data from an SCD patient are shown in panels (B) to (F). (A) IFC detected significantly more PS-positive RBCs than did FC. By IFC, the percentage of PS-positive RBC was significantly greater in the SCD patients (median, IQR: 1.51%, 1.14–3.56%) than in the healthy donors (0.45%, 0.18–0.90%) (p = 0.003), but the difference detected by FC did not reach statistical significance (SCD: 0.53%, 0.25–0.82%, healthy donors: 0.16%, 0.05–0.49%, p = 0.06). Fourteen samples from 8 SCD patients, and 10 samples from 10 healthy donors were examined by both IFC and FC. (B) Scatter plot of bright detail intensity versus PS exposure (lactadherin staining) of RBCs. There were two populations of PS-positive cells, with either high or low (but detectable) PS exposure. Representative brightfield and fluorescent images of the two PS-positive populations are shown in (C) and (D). (E) Enlarged images show the dimples/black spots on the brightfield image, the PS dots on the fluorescent image, and their co-localization. (F) Representative images of brightfield and fluorescent staining for PS, DAPI, CD71, CD45, and their co-localization in reticulocytes. Scale bar: 7 μm. BF: brightfield, PS: phosphatidylserine, CD71: transferrin receptor, CD45: leukocyte common antigen.
In the brightfield images of SCD blood, we also observed RBCs with dimples/black spots adjacent to the membrane (top panel in Figure 6E), resembling the Howell-Jolly bodies (HJBs) seen on blood films. HJBs represent clusters of DNA that remain in the RBCs of individuals lacking spleens or with splenic dysfunction (including SCD patients) (18,19). The dimples/black spots in the brightfield images co-localized with the PS-positive dots in the fluorescent images (Figure 6E). We explored these features further by simultaneously labeling RBCs with DAPI, lactadherin, and antibodies to CD71 and CD45. Cells that were positive for CD71 and negative for CD45 were analyzed by IFC. As shown in Figure 6F, the dimples/black spots, the PS dots, and the DNA stain all colocalized. Furthermore, although CD71 staining was seen throughout the cell surface, the intensity was much greater over the PS dots. Based on these data, we conclude that the dimples/black spots in the brightfield images were indeed HJBs representing residual nuclear DNA, and that their association with the cytoplasmic face of the membrane coincided with localized PS exposure on the outer leaflet of the plasma membrane.
DISCUSSION
RBCs from SCD patients are characterized by heterogeneous morphologies and features (20). A typical blood film shows anisocytosis, poikilocytosis, polychromasia, nucleated RBCs, sickled cells, irregular contracted cells, and, often, HJBs (21). In this study we used IFC to examine RBCs from SCD patients and develop a high-throughput approach to identify and quantify poikilocytes, RBC morphologies at different maturation stages, and RBCs with HJBs.
IFC was used by van Beers et al. (5) to identify and quantify RBCs with sickle shapes after the SCD blood was deoxygenated. In that study, the authors distinguished the RBCs with sickle shapes from those with normal morphology using a cut-off ratio of length to the minimal width of a cell (the shape-ratio feature in IDEAS®). The sickle RBCs had a higher length-to-width ratio than normally shaped cells. However, using the cut-off ratio, the authors also detected a high percentage (> 5%) of “sickle” cells in the blood of healthy individuals, which included acanthocytes, echinocytes, RBCs in side view, and even some normal biconcave RBCs. In our study, we seldom observed RBCs with sickle shapes in the SCD blood unless the blood was first deoxygenated. Instead, we found significant numbers of poikilocytes, including dense cells, which primarily comprise irreversibly sickled cells (Figure 3). Therefore, it seems likely that under normal oxygen tension, poikilocytes of non-sickle shape are far more common than the sickle-shaped RBCs in SCD blood. We also noted that, using only the cell’s length-to-width ratio as described by van Beers et al. (5), we could not distinguish poikilocytes from normal RBCs in side view. This is a likely explanation for why these investigators detected such a high percentage of “sickle” cells in healthy blood. To get around this limitation, we developed a new method to identify poikilocytes in SCD blood, using the parameters of elongatedness, circularity, cell area, and modulation. With this method, we identified a significant quantity of poikilocytes in SCD blood and the expected very low number in healthy donors.
SCD patients have high reticulocyte counts due to chronic hemolysis. Compared to mature RBCs, reticulocytes have unique surface markers, such as CD71, and excess cell membrane. Some of them appear to have puckered morphologies (12). Before the availability of IFC technology, a combination of multiple methods was needed to characterize these features (11–13). For example, Malleret et al. (11) FACS-sorted cord blood reticulocytes from healthy donors based on the level of CD71 expression, and studied their morphologies using scanning electron microscopy. They found that reticulocytes with high CD71 expression had more “wrinkled globular” shapes, and those with low CD71 had a more regular biconcave shape. With IFC, we were able to simultaneously analyze CD71 expression and cell morphology and confirmed that high expression of CD71 is associated with a puckered morphology (Figure 4), suggesting that this morphology is characteristic of an earlier stage of RBC differentiation. We further characterized these RBCs with additional markers: DAPI, CD49d, and band 3. The levels of these markers are known to change on human erythroblasts from bone marrow during erythroid development (22). We found that some of the RBCs with high CD71 and puckered morphologies were indeed nucleated RBCs (Figure 5). Nucleated RBCs appear in the blood of SCD patients because of hemolysis and hyposplenism (21, 23). They are much easier to identify by IFC given the simplicity of sample preparation and the ease of data acquisition and analysis, which are automated and high-throughput.
PS is normally located on the inner leaflet of the cell membrane and is translocated to the outer leaflet when cells are activated or undergo apoptosis. PS-positive blood cells provide surfaces for coagulation reactions to occur and are therefore prothrombotic (24). Previous studies found that in SCD patients the number of PS-positive RBCs correlated with thrombin generation and the risk of stroke (25–27). In this study, we examined PS exposure on RBCs in SCD blood by both IFC and FC (Figure 6) using labeled lactadherin instead of annexin A5 to detect PS. Lactadherin has two important advantages over annexin A5. First, it does not require calcium to bind PS (28), enabling us to stain citrated blood directly to measure PS exposure, in contrast to annexin A5, which requires calcium and therefore cannot be used for PS detection in blood anticoagulated with either citrate or EDTA. Second, lactadherin is more sensitive in detecting PS exposure than annexin A5 (28).
We compared the results from parallel analyses carried out with FC and IFC and found that FC detected fewer PS-positive RBCs than did IFC (Figure 6A). In FC, fluorescence intensity is the only parameter that can be used to distinguish negative from positive cells. The lower percentage of PS-positive RBCs detected by FC is thus likely the result of misclassification of the RBCs with low PS exposure as negative cells during the gating process. Whereas IFC detected a population of RBC with intense but restricted (punctate) PS exposure, this population was probably excluded by FC because of the low overall PS expression. In most of the cells with punctate PS expression, the PS was overlying residual DNA suggestive of HJBs. Punctate patterns of PS exposure on reticulocytes have been described by Mankelow et al. as being produced by autophagic vesicles in patients with SCD or after splenectomy (29). These vesicles, enclosed by inside-out membrane, contained intracellular organelles. The authors speculated that during reticulocyte maturation, these vesicles might be removed by the spleen or directly released by reticulocytes to reduce the extra membrane and internal organelles. These findings help to shed light on the long-standing conundrum of how splenic macrophages recognize HJBs and “pit” them from erythrocytes. PS exposed regionally could be recognized by the macrophages as a focal “eat me” signal, which would allow removal of the underlying nuclear material without phagocytosis of the entire cell.
In summary, imaging flow cytometry proves to be a powerful tool to analyze blood in SCD, being capable of simultaneously evaluating surface markers and cell morphology. The technique analyzes cell populations like conventional cytometry, while yielding detailed morphological information on many parameters of relevance in the disease. Further, the morphological evaluation circumvents many of the potential artifacts arising from blood film preparation and allows an unbiased assessment of the results. This technique might be useful for evaluating patients with different clinical presentations, such as acute crises, and to assess effectiveness of therapy. It may also be a useful research tool to better understand disease pathophysiology by determining cell activation status, morphological changes, and PS exposure, and to test the effect of existing and new drugs on parameters found to be predictive of clinical status.
Supplementary Material
KEY POINTS.
We analyzed the morphology and surface phenotype of erythrocytes in sickle cell disease using imaging flow cytometry.
These techniques improve phenotypic characterization and may be useful for assessing disease state and response to therapy.
ACKNOWLEDGMENTS
The authors thank Colette Norby-Slycord for assistance in recruiting SCD patients and collecting blood from patients.
This work was supported by grants from the National Institutes of Health R01 HL112633 (J.A.L. and B.A.K.), R34 HL128798-01 (B.A.K), R35 HL145262 (J.A.L) and institutional funds from the Bloodworks Research Institute.
Footnotes
DISCLOSURE OF CONFLICTS OF INTERESTS
The authors declare no conflict of interests.
REFERENCES
- 1.Ingram VM. Gene mutations in human haemoglobin: the chemical difference between normal and sickle cell haemoglobin. Nature. 1957;180(4581):326–8. [DOI] [PubMed] [Google Scholar]
- 2.Hebbel RP, Yamada O, Moldow CF, Jacob HS, White JG, Eaton JW. Abnormal adherence of sickle erythrocytes to cultured vascular endothelium: possible mechanism for microvascular occlusion in sickle cell disease. J Clin Invest. 1980;65(1):154–60. [DOI] [PMC free article] [PubMed] [Google Scholar]
- 3.Schwartz RS, Tanaka Y, Fidler IJ, Chiu DT, Lubin B, Schroit AJ. Increased adherence of sickled and phosphatidylserine-enriched human erythrocytes to cultured human peripheral blood monocytes. J Clin Invest. 1985;75(6):1965–72. [DOI] [PMC free article] [PubMed] [Google Scholar]
- 4.Gallagher P, Joiner C. The erythrocyte membrane. in Disorders of Hemoglobin: Genetics, Pathophysiology, and Clinical Management (ed. Steinberg M, F.B., Higgs D, Weatherall D) 158–84. Cambridge:Cambridge University Press; 2009. [Google Scholar]
- 5.van Beers EJ, Samsel L, Mendelsohn L, Saiyed R, Fertrin KY, Brantner CA, et al. Imaging flow cytometry for automated detection of hypoxia-induced erythrocyte shape change in sickle cell disease. Am J Hematol. 2014;89(6):598–603. [DOI] [PMC free article] [PubMed] [Google Scholar]
- 6.Samsel L, McCoy JP. Jr. Imaging flow cytometry for the study of erythroid cell biology and pathology. J Immunol Methods. 2015;423:52–59. [DOI] [PMC free article] [PubMed] [Google Scholar]
- 7.Zhou C, Chappa P, Tan F, Archer F. A novel in-vitro sickling assay combined with imaging flow cytometry allows dynamic measurement of pO2, RBC sickling and automatic quantification of the percentage of sickled cells. in Pediatric Healthcare Innovation: Advancing Technologies to Improve Child Health 22 (Georgia). [Google Scholar]
- 8.Fertrin KY, Samsel L, van Beers EJ, Mendelsohn L, Kato GJ, McCoy JP, Jr. Sickle Cell Imaging Flow Cytometry Assay (SIFCA). Methods Mol Biol. 2016;1389:279–92. [DOI] [PMC free article] [PubMed] [Google Scholar]
- 9.Gibson XA, Shartava A, McIntyre J, Monteiro CA, Zhang Y, Shah A, et al. The efficacy of reducing agents or antioxidants in blocking the formation of dense cells and irreversibly sickled cells in vitro. Blood. 1998;91(11):4373–8. [PubMed] [Google Scholar]
- 10.Lew VL, Bookchin RM. Ion transport pathology in the mechanism of sickle cell dehydration. Physiol Rev. 2005;85(1):179–200. [DOI] [PubMed] [Google Scholar]
- 11.Malleret B, Xu F, Mohandas N, Suwanarusk R, Chu C, Leite JA, et al. Significant biochemical, biophysical and metabolic diversity in circulating human cord blood reticulocytes. PLoS One. 2013;8(10):e76062. [DOI] [PMC free article] [PubMed] [Google Scholar]
- 12.Kono M, Kondo T, Takagi Y, Wada A, Fujimoto K. Morphological definition of CD71 positive reticulocytes by various staining techniques and electron microscopy compared to reticulocytes detected by an automated hematology analyzer. Clin Chim Acta. 2009;404(2):105–10. [DOI] [PubMed] [Google Scholar]
- 13.Mel HC, Prenant M, Mohandas N. Reticulocyte motility and form: studies on maturation and classification. Blood. 1977;49(6):1001–9. [PubMed] [Google Scholar]
- 14.Hillman RS, Finch CA. The misused reticulocyte. Br J Haematol. 1969;17(4):313–5. [DOI] [PubMed] [Google Scholar]
- 15.Setty BN, Kulkarni S, Dampier CD, Stuart MJ. Fetal hemoglobin in sickle cell anemia: relationship to erythrocyte adhesion markers and adhesion. Blood. 2001;97(9):2568–73. [DOI] [PubMed] [Google Scholar]
- 16.Sakamoto TM, Canalli AA, Traina F, Franco-Penteado CF, Gambero S, Saad ST, et al. Altered red cell and platelet adhesion in hemolytic diseases: Hereditary spherocytosis, paroxysmal nocturnal hemoglobinuria and sickle cell disease. Clin Biochem. 2013;46(18):1798–803. [DOI] [PubMed] [Google Scholar]
- 17.Kaushal M, Byrnes C, Khademian Z, Duncan N, Luban NL, Miller JL, et al. Examination of reticulocytosis among chronically transfused children with sickle cell anemia. PLoS One. 2016;11(4):e0153244. [DOI] [PMC free article] [PubMed] [Google Scholar]
- 18.Harrod VL, Howard TA, Zimmerman SA, Dertinger SD, Ware RE. Quantitative analysis of Howell-Jolly bodies in children with sickle cell disease. Exp Hematol. 2007;35(2):179–83. [DOI] [PubMed] [Google Scholar]
- 19.Dertinger SD, Torous DK, Hall NE, Murante FG, Gleason SE, Miller RK, et al. Enumeration of micronucleated CD71-positive human reticulocytes with a single-laser flow cytometer. Mutat Res. 2002;515(1–2):3–14. [DOI] [PubMed] [Google Scholar]
- 20.Fabry ME, Nagel RL. Heterogeneity of red cells in the sickler: a characteristic with practical clinical and pathophysiological implications. Blood Cells. 1982;8(1):9–15. [PubMed] [Google Scholar]
- 21.Bain B Disorders of red cells and platelets. in Blood Cell: A Practical Guide. (ed. Bain B) 295–415. John Wiley & Sons Ltd.; 2015. [Google Scholar]
- 22.Hu J, Liu J, Xue F, Halverson G, Reid M, Guo A, et al. Isolation and functional characterization of human erythroblasts at distinct stages: implications for understanding of normal and disordered erythropoiesis in vivo. Blood. 2013;121(16):3246–53. [DOI] [PMC free article] [PubMed] [Google Scholar]
- 23.Constantino BT, Cogionis, Bessie. Nucleated RBCs—Significance in the Peripheral Blood Film. Laboratory Medicine. 2000;31(4):223–29. [Google Scholar]
- 24.Zwaal RF, Schroit AJ. Pathophysiologic implications of membrane phospholipid asymmetry in blood cells. Blood. 1997;89(4):1121–32. [PubMed] [Google Scholar]
- 25.Styles L, De Jong K, Vichinsky E, Lubin B, Adams R, Kuypers F. Increased RBC phosphatidylserine exposure in sickle cell disease patients at risk for stroke by transcranial Doppler screening. Blood. 1997;90:604a. [Google Scholar]
- 26.Setty BN, Rao AK, Stuart MJ. Thrombophilia in sickle cell disease: the red cell connection. Blood. 2001;98(12):3228–33. [DOI] [PubMed] [Google Scholar]
- 27.Setty BN, Kulkarni S, Rao AK, Stuart MJ. Fetal hemoglobin in sickle cell disease: relationship to erythrocyte phosphatidylserine exposure and coagulation activation. Blood. 2000;96(3):1119–24. [PubMed] [Google Scholar]
- 28.Shi J, Shi Y, Waehrens LN, Rasmussen JT, Heegaard CW, Gilbert GE. Lactadherin detects early phosphatidylserine exposure on immortalized leukemia cells undergoing programmed cell death. Cytometry A. 2006;69(12):1193–201. [DOI] [PubMed] [Google Scholar]
- 29.Mankelow TJ, Griffiths RE, Trompeter S, Flatt JF, Cogan NM, Massey EJ, et al. Autophagic vesicles on mature human reticulocytes explain phosphatidylserine-positive red cells in sickle cell disease. Blood. 2015;126(15):1831–4. [DOI] [PMC free article] [PubMed] [Google Scholar]
Associated Data
This section collects any data citations, data availability statements, or supplementary materials included in this article.


