Background:
To construct and verify a novel prognostic model for thyroid cancer (THCA) based on N7-methylguanosine modification-related lncRNAs (m7G-lncRNAs) and their association with immune cell infiltration.
Methods:
In this study, we identified m7G-lncRNAs using co-expression analysis and performed differential expression analysis of m7G-lncRNAs between groups. We then constructed a THCA prognostic model, performed survival analysis and risk assessment for the THCA prognostic model, and performed independent prognostic analysis and receiver operating characteristic curve analyses to evaluate and validate the prognostic value of the model. Furthermore, analysis of the regulatory relationship between prognostic differentially expressed m7G-related lncRNAs (PDEm7G-lncRNAs) and mRNAs and correlation analysis of immune cells and risk scores in THCA patients were carried out.
Results:
We identified 29 N7-methylguanosine modification-related mRNAs and 116 differentially expressed m7G-related lncRNAs, including 87 downregulated and 29 upregulated lncRNAs. Next, we obtained 8 PDEm7G-lncRNAs. A final optimized model was constructed consisting of 5 PDEm7G-lncRNAs (DOCK9−DT, DPP4–DT, TMEM105, SMG7–AS1 and HMGA2–AS1). Six PDEm7G-lncRNAs (DOCK9–DT, DPP4–DT, HMGA2–AS1, LINC01976, MID1IP1–AS1, and SMG7–AS1) had positive regulatory relationships with 10 PDEm7G-mRNAs, while 2 PDEm7G-lncRNAs (LINC02026 and TMEM105) had negative regulatory relationships with 2 PDEm7G-mRNAs. Survival curves and risk assessment predicted the prognostic risk in both groups of patients with THCA. Forest maps and receiver operating characteristic curves were used to evaluate and validate the prognostic value of the model. Finally, we demonstrated a correlation between different immune cells and risk scores.
Conclusion:
Our results will help identify high-risk or low-risk patients with THCA and facilitate early prediction and clinical intervention in patients with high risk and poor prognosis.
Keywords: immune cell infiltration, N7-methylguanosine modification, prognosis model, prognostic lncRNAs, prognostic risk, thyroid cancer
1. Introduction
Thyroid cancer (THCA) is a malignant tumor originating from the thyroid follicular epithelium or parafollicular epithelium. It is also the most common malignant tumor of the head and neck.[1] THCA can be classified as differentiated thyroid carcinoma (DTC) (papillary thyroid carcinoma and follicular thyroid carcinoma), medullary thyroid carcinoma (MTC), and anaplastic thyroid carcinoma (ATC).[2] DTC has mild biological behavior and a good prognosis, whereas ATC has a high degree of malignancy and a median survival time of less than 6 months.[3,4] Hence, it is necessary to identify new prognostic genes to distinguish between patients with low- and high-risk THCA.
Long non-coding RNAs (lncRNAs) are non-coding RNA with a length greater than 200 nucleotides.[5] Differential expression of lncRNAs is closely related to the occurrence of human diseases, including cancer, degenerative neurological diseases, and other major diseases that seriously harm human health, which manifest in molecular biological processes such as sequence and spatial structure disorder, expression level difference, and abnormal interaction with binding proteins.[6] N7-methyladenosine (m7G) is a modification that adds a methyl group to the 7th N of RNA guanine under the action of a methyltransferase. M7G modification is one of the most common base modification methods in gene regulation and plays an important role in maintaining the structural stability of RNA, affecting RNA processing and metabolism, and regulating protein translation.[7,8]
Studies have shown that N7-methylguanosine modification-related lncRNAs (m7G-lncRNAs) participate in the regulation of the molecular biological processes of tumor cells in vivo and affect the occurrence and development of tumors.[9] However, to the best of our knowledge, no studies of m7G-lncRNAs in THCA have been reported. In this study, we identified a new definition of m7G-lncRNAs that predicts prognosis in THCA patients and elucidated their association with immune cell infiltration. The objective of this study was to identify sensitive prognostic biomarkers of THCA, which is of great significance for the early prediction of patients with high-risk and poor prognosis of THCA and early clinical intervention.
2. Materials and Methods
2.1. Data collection and collation
Transcriptome expression data and corresponding clinical information of THCA were downloaded from TCGA database,[10] and a total of 567 samples were collected, including 509 THCA tissue samples and 58 normal paracancer tissue samples. We then used the Perl language[11] to organize and clean all data for subsequent bioinformatics and statistical analyses.
2.2. Identification of m7G-related lncRNAs by co-expression analysis
First, the transcriptome expression matrix of all THCA samples was gene-classified using customized Perl scripts and configuration files to identify which RNAs were mRNAs or lncRNAs. The list of m7G-related genes was obtained from the MSigDB database (http://www.gsea-msigdb.org/gsea/login.jsp)[12] and the relative expression level of each m7G-related gene was extracted from the THCA gene matrix using the R package limma.[13] Finally, co-expression analysis of m7G-related mRNAs and lncRNAs was conducted using the Pearson correlation test,[14] and the m7G-related lncRNAs were identified. A Pearson correlation coefficient > 0.4 and P-value < .001 were considered statistically different.
2.3. Differential expression analysis of m7G-related lncRNAs between groups
We calculated the mean expression value of each m7G-related lncRNA in each sample using R packages limma and pheatmap[15] and screened out the differentially expressed m7G-related lncRNAs (DEm7G-lncRNAs) with high expression and low expression by comparing the expression differences between THCA and normal sample groups. Finally, the results of the differential expression analysis were analyzed. RNAs with an adjusted P-value < .05 and |logFC (fold change)| >1 were defined as DEm7G-lncRNAs.
2.4. Construction of the THCA prognosis model
First, the expression matrix of DEm7G-lncRNAs and the survival time and status of patients with THCA were sorted and combined. All samples were then randomly divided into training and test groups. The THCA prognosis model was constructed based on DEm7G-lncRNAs using univariate and multivariate COX regression and least absolute shrinkage and selection operator regression analyses,[16,17] and the accuracy of the model was verified. Then, the relative expression level of each DEm7G-lncRNA in each sample was multiplied by the risk factor and then added together to obtain the risk score of each sample by R package survival, survminer, and timeROC.[18–20] Finally, the risk score of each sample was compared with the median risk score, and all patients were divided into high- and low-risk groups.
2.5. Analysis of regulatory relationship between prognostic DEm7G-lncRNAs and mRNAs
To further investigate the regulatory relationship between prognostic DEm7G-lncRNAs (PDEm7G-lncRNAs) and mRNAs, we inputted regulatory network parameters and the list of PDEm7G-lncRNAs into R software to establish a regulatory network linked by lncRNAs and their target genes and visualized them with a Sankey diagram using the packages ggalluvial, ggplot2, and dplyr.[21,22]
2.6. Survival analysis of high- and low-risk groups in the THCA prognostic model
To assess the prognostic value of the THCA prognostic model, we performed survival analysis of patients in the high- and low-risk groups. We used the survival information, risk score, risk grouping and PDEm7G-lncRNAs expression matrix of the training set, testing set, and all patients as the input files of R Studio and drew the survival curves[23] of THCA patients in the high- and low-risk groups by comparing the survival differences of the high- and low-risk groups and referring to the R packages survival and survminer.[24]
2.7. Risk assessment of high- and low-risk groups in the THCA prognostic model
To explore the correlation between patient survival time, survival status, PDEm7G-lncRNAs expression and risk scores, we conducted a risk assessment for THCA patients in high- and low-risk groups.[25] The results are shown by risk curves, survival scatter plots, and risk gene heat maps using the R package pheatmap.[26,27]
2.8. Independent prognostic analysis of the THCA prognostic model
Independent prognostic analysis was used to predict whether the risk score could be used as an independent prognostic factor for THCA patients with THCA. Using the R package survival, univariate and multivariate independent prognostic analyses were performed by reading and combining all patient risk files (including survival time, survival status, risk score, and gene expression matrix) and clinical trait lists (including patient age, sex, and tumor stage).[28] The results were visualized using forest plots.[29]
2.9. Receiver operating characteristic (ROC) curve analyses of the THCA prognostic model
The ROC curve is a comprehensive index reflecting the continuous variables of sensitivity and specificity and is usually used to show the relationship between the 2.[30] If the area under the ROC curve (AUC) is larger, the diagnostic value of the test is higher.[31] ROC curves were drawn to test the predictive performance of the THCA prognostic model using the R package survival, survminer, and timeROC.[18–20] The survival times, survival statuses, PDEm7G-lncRNAs expressions, risk score, and clinical characteristics (age, sex, and tumor stage) were read and combined, and ROC curves of 1-year, 3-year, and 5-year survival rates and clinical traits were plotted.[32,33]
2.10. Correlation analysis of immune cells and risk scores in THCA patients
To investigate the correlation between immune cell infiltration and risk scores in THCA patients, we performed Spearman correlation analysis between risk scores and immune cell infiltration[34] using the R package scales ggplot2, ggtext, tidyverse, and ggpubr.[35–37] If the P-value of the correlation test was less than .05, we drew scatter plots and a bubble plot of the correlation between immune cell infiltration and patient risk score for visualization.[38]
3. Results
3.1. Identification of m7G-related lncRNAs
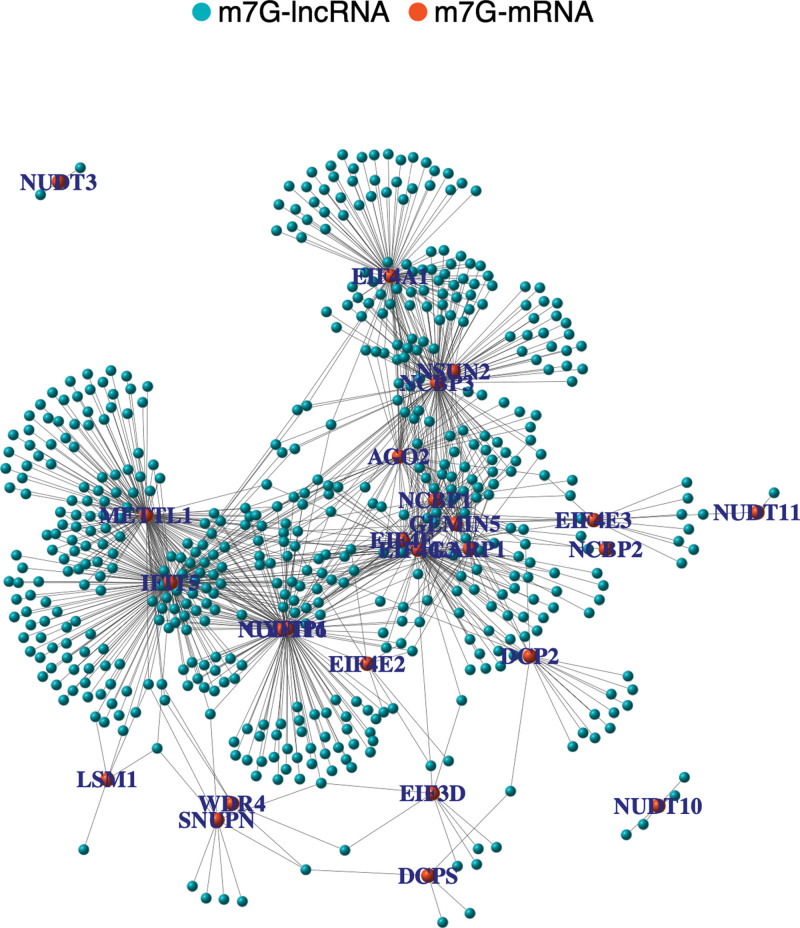
We collected and collated 39953 RNAs transcript expression matrices from TCGA database, including 4438 lncRNAs and 19166 mRNAs. An expression matrix consisting of 29 N7-methylguanosine modification-related mRNAs (m7G-mRNAs) was constructed based on the MSigDB and THCA gene matrices. In addition, 545 coexpressed m7G-lncRNAs were identified using co-expression network analysis. The details of the expression matrix and co-expression relationship of m7G-lncRNAs are provided in the Supplemental Digital Content, Files 1, http://links.lww.com/MD/H595 and Supplemental Digital Content, Files 2, http://links.lww.com/MD/H596. A co-expression network was used to visualize the correlation between the m7G-mRNAs and m7G-lncRNAs (Fig. 1).
Figure 1.
The co-expression network of m7G-lncRNAs and m7G-mRNA. Orange nodes represent m7G-mRNAs and blue nodes represent m7G-lncRNAs. Grey solid lines represent the coexpression relationships between the mRNAs and lncRNAs. lncRNAs = Long non-coding RNAs, m7G-lncRNAs = N7-methylguanosine modification-related mRNAs.
3.2. Identification of differentially expressed m7G-lncRNAs between groups
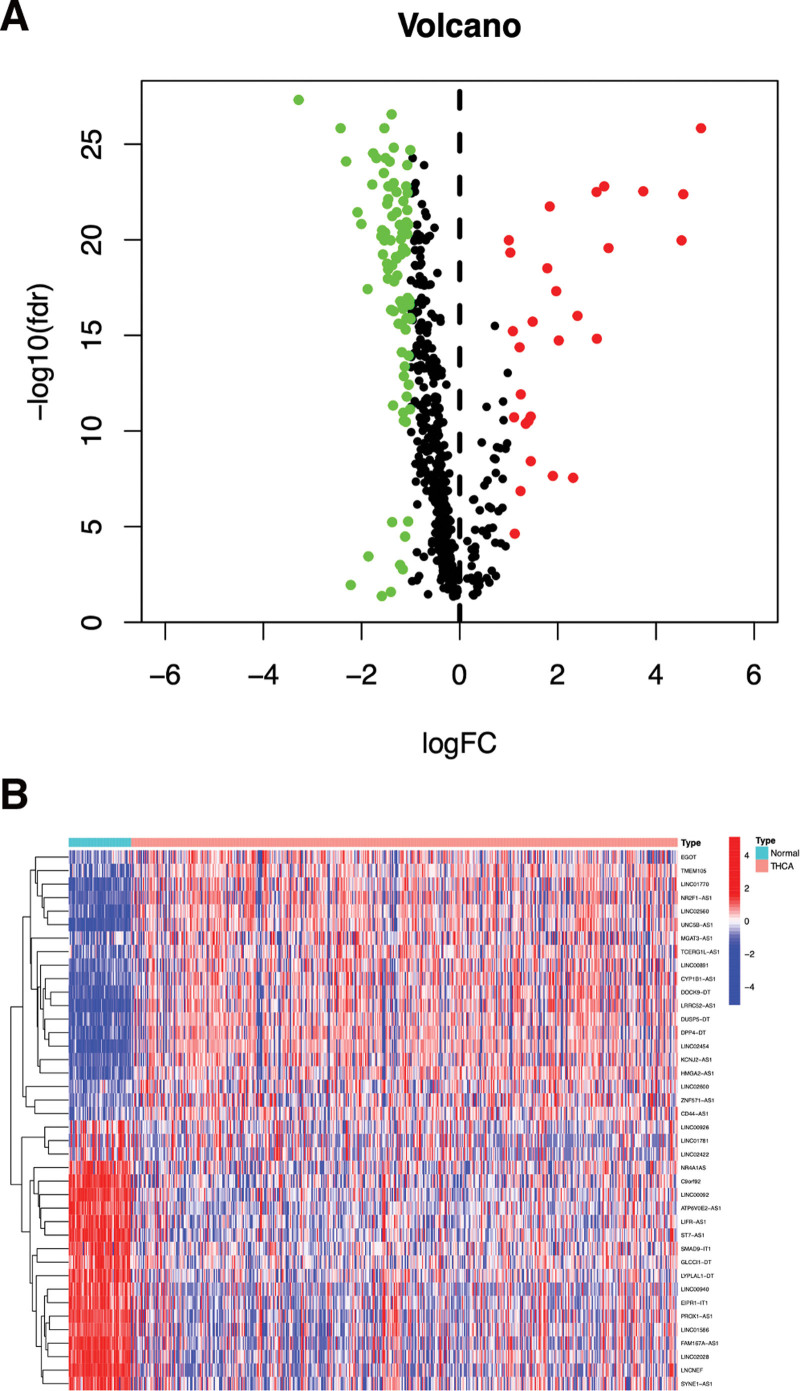
Through differential expression analysis of 545 m7G-lncRNAs, we identified 116 DEm7G-lncRNAs, including 87 downregulated lncRNAs and 29 upregulated lncRNAs. The matrix and differential expression parameters of DEm7G-lncRNAs are shown in the Supplemental Digital Content, File 3, http://links.lww.com/MD/H597, Supplemental Digital Content, File 4, http://links.lww.com/MD/H598. The volcano map in Figure 2A shows the expression of all 116 DEm7G-lncRNAs and the heat map in Figure 2B shows the top 20 DEm7G-lncRNAs with the most significant upregulation and downregulation.
Figure 2.
The volcano plot (A) and heatmap (B) of the DEm7G-lncRNAs. Red, up-regulated lncRNAs; green and blue, down-regulated lncRNAs. cutoff criteria: |logFC| ≥ 1.0 and adj. P < .05. DEm7G-lncRNAs = differentially expressed m7G-related lncRNAs, lncRNAs = Long non-coding RNAs.
3.3. The prognosis model for THCA patients
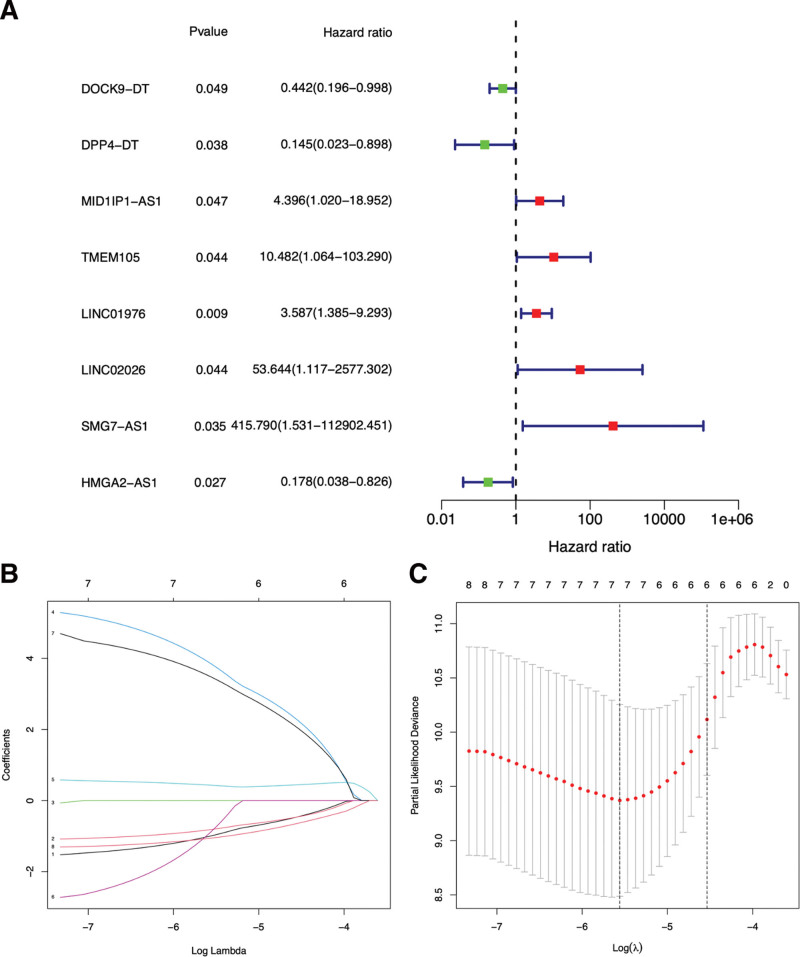
After univariate Cox analysis of 116 DEm7G-lncRNAs, we identified 8 PDEm7G-lncRNAs, among which DOCK9−DT, DPP4−DT and HMGA2−AS1 were low risk lncRNAs (hazard ratio < 1), and MID1IP1−AS1, TMEM105, LINC01976, LINC02026, and SMG7−AS1 were high-risk lncRNAs (hazard ratio > 1) (Fig. 3A). Least absolute shrinkage and selection operator regression was used to select 7 PDEm7G-lncRNAs (DOCK9-DT, DPP4-DT, TMEM105, LINC01976, LINC02026, SMG7-AS1 and HMGA2-AS1) with significant differential expression for Cox model construction (Fig. 3B and C). Furthermore, the predictive value of the prognosis model was evaluated and optimized by cross-validation, resulting in a final optimized model consisting of 5 PDEm7G-lncRNAs (DOCK9−DT, DPP4−DT, TMEM105, SMG7−AS1 and HMGA2−AS1). The raw data related to the prognostic model are detailed in the Supplemental Digital Content, File 5, http://links.lww.com/MD/H599, Supplemental Digital Content, File 6, http://links.lww.com/MD/H600, Supplemental Digital Content, File 7, http://links.lww.com/MD/H601. The formula for the prognostic model was as follows.
Figure 3.
A forest plot of univariate (A) Cox regression analysis of 8 PDEm7G-lncRNAs of THCA patients. Green square, low HR value; Red square, high HR value, blue solid lines represent 95% CIs. Selecting the optimal adjustment parameter by the LASSO screening process (B) and cross validation (C). CI= confidence interval, HR = hazard ratio, LASSO = least absolute shrinkage and selection operator, PDEm7G-lncRNAs = prognostic DEm7G-lncRNAs, THCA = Thyroid cancer.
3.4. Regulatory relationships between PDEm7G-lncRNAs and mRNAs
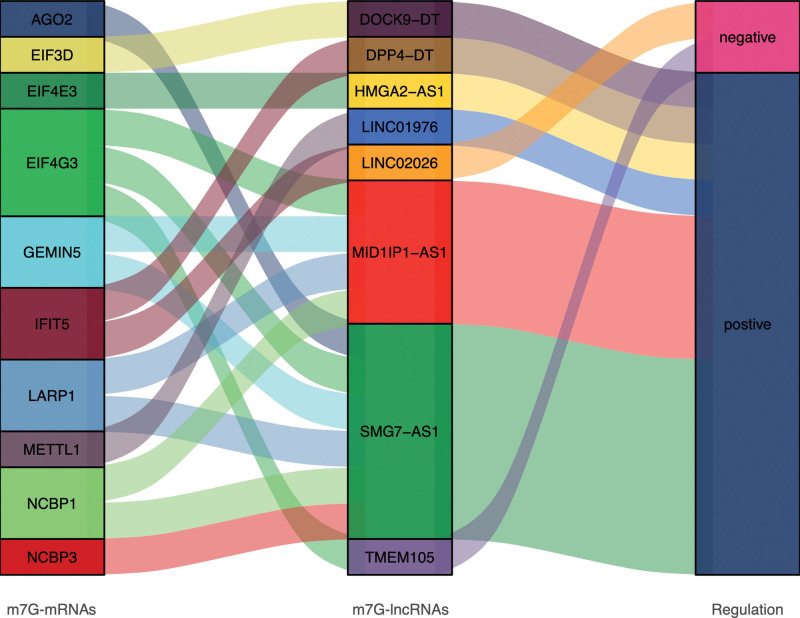
Analysis of the regulatory relationship between PDEm7G-lncRNAs and mRNAs revealed that 6 PDEm7G-lncRNAs (DOCK9−DT, DPP4−DT, HMGA2−AS1, LINC01976, MID1IP1−AS1, and SMG7−AS1) had positive regulatory relationships with 10 PDEm7G-lncRNAs, whereas 2 PDEm7G-lncRNAs (LINC02026 and TMEM105) had negative regulatory relationships with 2 PDEm7G-lncRNAs. The Sankey diagram displays all regulatory relationship results (Fig. 4).
Figure 4.
The sankey diagram showed the regulatory relationship between 8 PDEm7G-lncRNAs and 10 PDEm7G-mRNAs. The blocks on the left represent the PDEm7G-mRNAs, the middle blocks represent PDEm7G-lncRNAs, and the blocks on the right represent the regulatory relationships (PCC > 0.4 and P < .05). PCC = pear son correlation coefficient, PDEm7G-lncRNAs = N7-methylguanosine modification-related mRNAs, PDEm7G-mRNAs = differentially expressed m7G-related lncRNAs.
3.5. Survival analysis and risk assessment of the THCA prognostic model
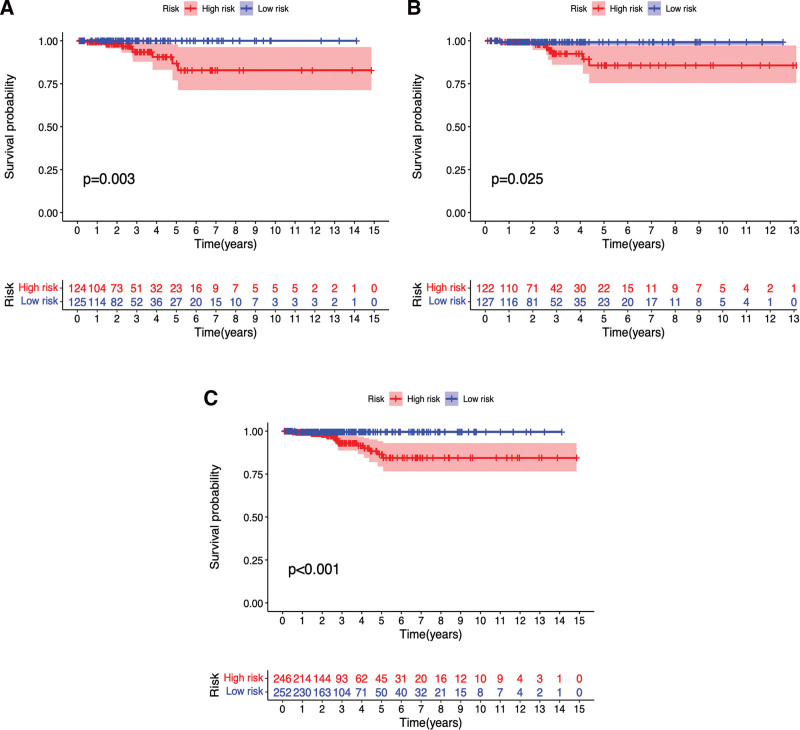
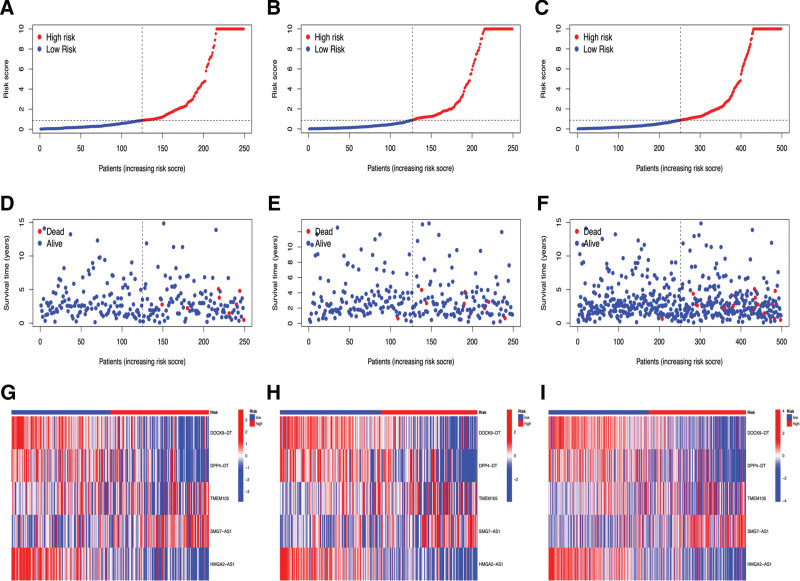
Survival curves were plotted by comparing differences in survival between the high- and low-risk groups in the training set, test set, and all patients in the prognostic model. As shown in Figure 5A–C, the survival of THCA patients in the high-risk group was significantly lower than that of patients in the low-risk group (P < .05). We further performed a prognostic risk assessment to predict the prognostic risk in both groups of patients with THCA. The risk scores of the high-risk groups in the training set, test set, and all patients were significantly higher than those in the low-risk group (P < .05) (Fig. 6A–C). As the risk score increased, patient survival decreased and the number of deaths increased (Fig. 6D–F). As shown in Figure 6G–I, DOCK9−DT, DPP4−DT and HMGA2−AS1 were low-risk m7G-lncRNAs, whereas TMEM105 and SMG7−AS1 were high-risk m7G-lncRNAs. These results suggest that the prognostic model can accurately predict the survival and risk outcomes between the 2 groups.
Figure 5.
The survival curve of high- (red) and low-risk (blue) patients in Train set (A), Test set (B) and all patients (C). Abscissa, survival years of patients; Ordinate, survival rate. The lists below the curves showed the number of surviving patients per year.
Figure 6.
The risk curve plots in Train set (A), Test set (B), and all patients (C). Abscissa: Patients risk scores ranked from low to high; Ordinate, risk score. Red dots, high-risk group; blue dots, low-risk group. The risk scatter plots in Train set (D), Test set (E) and all patients (F). Ordinate: survival time. Red dots, patients dead; blue dots, patients alive. The risk heatmaps of 5 PDEm7G-lncRNAs in Train set (G), Test set (H) and all patients (I). Red squares, high-expression lncRNAs; blue squares, low-expression lncRNAs. lncRNAs = long non-coding RNAs, PDEm7G-lncRNAs = N7-methylguanosine modification-related lncRNAs.
3.6. Evaluation and validation of the prognostic value of the model
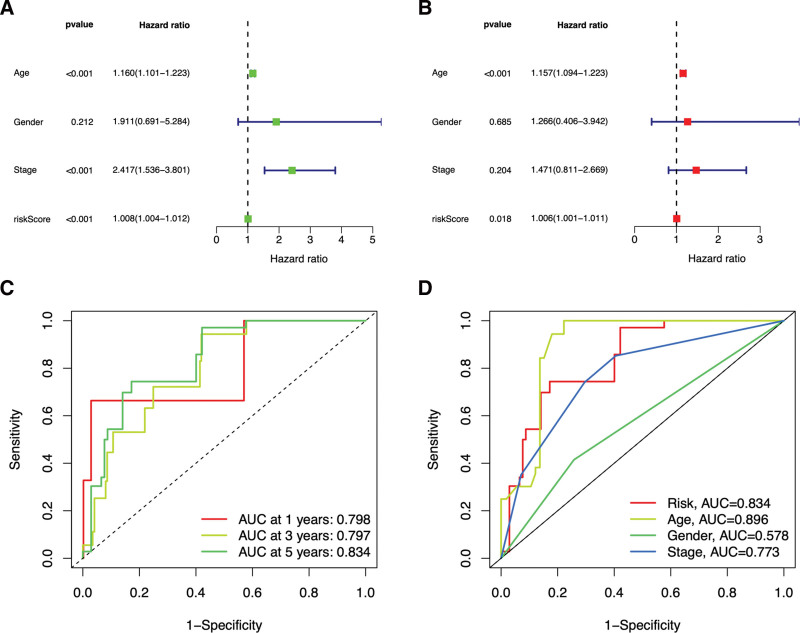
Forest maps and the ROC curves were generated to evaluate and validate the prognostic value of the model. Figure 7A and B presented that the P-value of the risk score was P < .05, and the HR value was greater than 1 in both univariate and multivariate logistic analyses, suggesting that the risk score in the prognostic model might serve as a reliable clinically independent prognostic factor. As shown in Figure 7C, the AUC of the 1-, 3-, and 5-year survival rates were 0.798, 0.797, and 0.834, respectively. Compared with other clinical characteristics, the prognostic model-based risk score and age had relatively higher AUC values (0.834 and 0.896) (see Fig. 7D). These results indicate that the prognostic model can accurately and independently predict the prognosis of patients with THCA.
Figure 7.
Forest plots of univariate (A) and multivariate (B) logistic analysis of clinical characteristics in THCA patients. Green or red square represents HR value, blue solid lines represent 95% confidence intervals. ROC curves of the prognosis model. The different colored curves represent different survival rates (1-,3- and 5-year) (C) or clinical characteristics (D), AUC = area under the ROC curve, Abscissa = 1-Specificity (false positive rate), HR = hazard ratio, ordinate = Sensitivity (true positive rate), ROC = receiver operating characteristic, THCA = thyroid cancer.
3.7. Correlation between immune cell infiltrations and risk scores
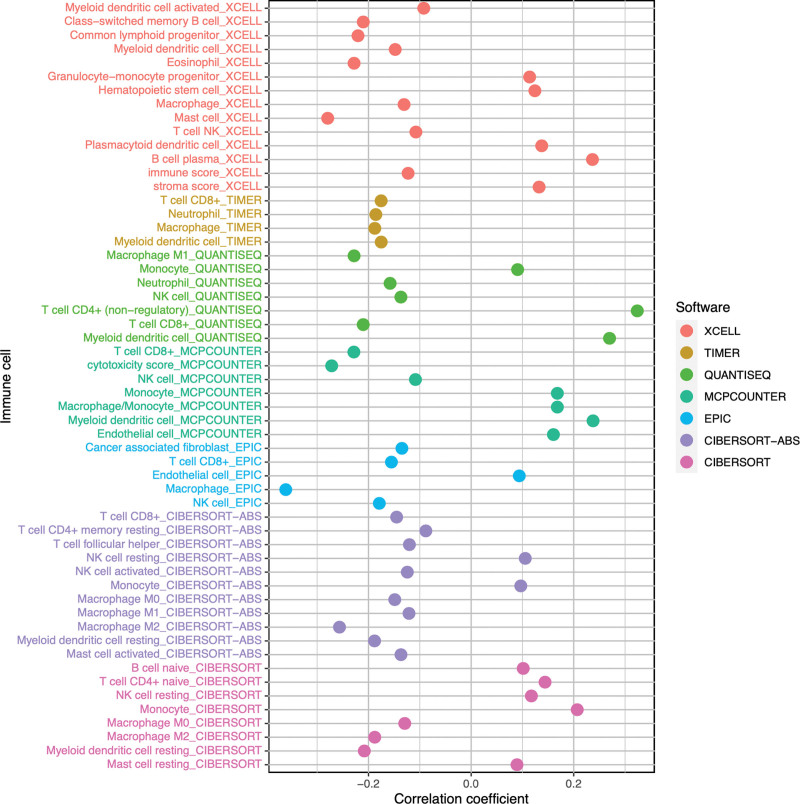
We performed a correlation analysis between immune cell infiltration and risk scores, and drew a bubble plot for visualization. Figure 8 shows the correlation between different immune cells and risk scores, with different colored bubbles representing the predicted results of different bioinformatics software. Using a bubble plot, we could visually and clearly see which immune cells were positively or negatively correlated with the patient’s risk score. The correlation curves between each immune cell infiltration level and risk score using different predictive software are detailed in the Supplemental Digital Content, File 8 (ImmuneCor; http://links.lww.com/MD/H834).
Figure 8.
Bubble plot of correlation between immune cells and risk scores. The vertical axis represents the name of the immune cells, the horizontal axis represents the correlation coefficient between the THCA patient’s risk scores and the immune cells, and the colored circles represent the results predicted by different bioinformatics software. THCA = thyroid cancer.
4. Discussion
THCA is the most common malignant tumor of the endocrine system. Most patients with THCA have good prognosis after conventional surgery and other treatments. However, patients with poor pathological differentiation or late clinical stage tend to have a poor prognosis and lower overall survival rate.[39–41] Therefore, in this study, we identified 29 m7G-mRNAs and 116 DEm7G-lncRNAs, including 87 downregulated and 29 upregulated lncRNAs. Next, we obtained 8 PDEm7G-lncRNAs. Furthermore, the predictive value of the prognosis model was evaluated and optimized by cross-validation, resulting in a final optimized model consisting of 5 PDEm7G-lncRNAs (DOCK9−DT, DPP4−DT, TMEM105, SMG7−AS1 and HMGA2−AS1). Next, analysis of the regulatory relationship between PDEm7G-lncRNAs and mRNAs revealed that 6 PDEm7G-lncRNAs (DOCK9−DT, DPP4−DT, HMGA2−AS1, LINC01976, MID1IP1−AS1, and SMG7−AS1) had positive regulatory relationships with 10 PDEm7G-mRNAs, whereas 2 PDEm7G-lncRNAs (LINC02026 and TMEM105) had negative regulatory relationships with 2 PDEm7G-mRNAs. Survival curves were plotted by comparing the differences in survival between the groups, and a prognostic risk assessment was performed to predict the prognostic risk in both groups of THCA patients. Forest maps and the ROC curves were generated to evaluate and validate the prognostic value of the model. Finally, we assessed the association between immune cell infiltration and risk scores.
To date, no study has reported a prognostic model based on m7G-lncRNAs for predicting the prognosis and risk of THCA. The newly discovered m7G-lncRNAs that affected the prognosis of THCA in our study are rarely reported in the literature. However, in the research field of other tumors, a few studies have found that m7G-modification is involved in important biological activities in tumorigenesis and development. Orellana et al[42] found that METTL1 is frequently amplified and overexpressed in cancer, and is associated with low patient survival. METTL1 depletion leads to a decreased abundance of m7G-modified tRNA and cell cycle changes and inhibits its carcinogenicity. In contrast, METTL1 overexpression induced oncogenic cell transformation. This promises to be an effective anticancer target. Dai et al[43] found that m7G-tRNA modification and its methyltransferase complex components METTL1 and WDR4 are significantly upregulated in intrahepatic cholangiocarcinoma by constructing gene overexpression and knockout mouse models and are associated with poor prognosis. METTL1-mediated m7G-tRNA modification plays a key carcinogenic role in regulating mRNA translation and cancer progression in intrahepatic cholangiocarcinoma. Chen et al[44] discovered that the expression of m7G-tRNA-modifying enzyme METTL1 and its companion WDR4 is significantly elevated in advanced nasopharyngeal carcinoma and is associated with poor prognosis. The mechanism might be that METTL1 upregulates the Wnt/β-catenin signaling pathway and promotes epithelial mesenchymal transformation and chemical resistance to cisplatin and docetaxel in advanced nasopharyngeal carcinoma cells in vitro and in vivo. This study revealed a novel modality of m7G-tRNA-mediated regulation of mRNA translation and highlighted the key role of m7G-modification in cancer progression.
Through our correlation analysis of immune cell infiltrations and risk scores, we could see that in multiple prediction software, immune cells such as Monocyte, Myeloid dendritic cell, Endothelial cell and NK cell resting are all positively correlated with the risk score of THCA. Several previous research reports also confirmed our similar conclusion. A higher relative ratio of monocytes in THCA patients tends to be associated with a higher risk of postoperative recurrence,[45] and the relative ratio is also higher in THCA patients with lymph node and distant metastases.[46] Gogali F et al[47] found higher NK cell infiltration levels in papillary thyroid carcinoma (PTC) tissues, and NK cell infiltration levels were positively correlated with PTC clinical stage. In addition, vascular endothelial growth factor (VEGF) produced by tumor cells can effectively stimulate endothelial cell proliferation and angiogenesis, and plays a key role in the pathophysiology of THCA.[48] Klein M et al[49] found that the expression level of VEGF is closely related to the distant metastasis of PTC, suggesting that it can be used as a poor prognostic marker of PTC.
In this study, we identified m7G-lncRNAs using co-expression analysis and performed differential expression analysis of m7G-lncRNAs between groups. We then constructed a THCA prognostic model, performed survival analysis and risk assessment for the THCA prognostic model, and performed independent prognostic analysis and ROC curve analyses to evaluate and validate the prognostic value of the model. Furthermore, analysis of the regulatory relationship between PDEm7G-lncRNAs and mRNAs and correlation analysis of immune cells and risk scores in THCA patients were carried out. We have identified novel prognostic m7G-lncRNAs and constructed a prognostic model for THCA, which will help to identify high-risk or low-risk patients with THCA and facilitate early prediction and clinical intervention in patients with high risk and poor prognosis. However, this study has some limitations, such as the lack of further research on different pathological subtypes of THCA and key gene pathways of pathogenesis. Ideally, in vitro and in vivo experiments with clinical samples are required to further validate our findings.
5. Conclusion
In this study, we identified a new definition of m7G-lncRNAs that predicts prognosis in THCA patients and elucidated its association with immune cell infiltration, which is of great significance for the early prediction of patients with high risk and poor prognosis of THCA and early clinical intervention.
Author contributions
All authors participated in the design and interpretation of the studies, analysis of the data, and review of the manuscript. LC and YZ designed this study. YZ drafted the original manuscript. FD, KL, and LMC collected raw data. XZD, JHL, YYL, and XYB performed the statistical and bioinformatic analyses. LC supervised this study.
Conceptualization: Yang Zhou, Li Cheng.
Data curation: Fang Deng, Kun Liu, Liming Cui.
Formal analysis: Xuezhong Dai, Jianhong Lyu, Yingyue Li, Xueyu Bao.
Supervision: Li Cheng.
Writing – original draft: Yang Zhou.
Writing – review & editing: Li Cheng.
Acknowledgements
We thank the TCGA database for providing data in this study.
Supplementary Material
Abbreviations:
- AUC =
- the area under the ROC curve
- DEm7G-lncRNAs =
- differentially expressed m7G-related lncRNAs
- LASSO =
- least absolute shrinkage and selection operator
- lncRNAs =
- long non-coding RNAs
- m7G =
- N7-methyladenosine
- m7G-lncRNAs =
- N7-methylguanosine modification-related lncRNAs
- m7G-mRNAs =
- N7-methylguanosine modification-related mRNAs
- PCC =
- pear son correlation coefficient
- PDEm7G-lncRNAs =
- prognostic DEm7G-lncRNAs
- ROC =
- receiver operating characteristic
- THCA =
- thyroid cancer
How to cite this article: Zhou Y, Dai X, Lyu J, Li Y, Bao X, Deng F, Liu K, Cui L, Cheng L. Construction and validation of a novel prognostic model for thyroid cancer based on N7-methylguanosine modification-related lncRNAs. Medicine 2022;101:42(e31075).
TCGA database is a public database. Ethical approval was obtained from the patients involved in the database. Users can download relevant data free of research, and publish relevant articles. Our study was based on open-source data; therefore, there were no ethical concerns.
Consent to participate was not applicable because no individual person’s data were used in this study.
The datasets generated during and/or analyzed during the current study are available from the corresponding author on reasonable request.
Supplemental Digital Content is available for this article.
The authors have no funding and conflicts of interest to disclose.
Contributor Information
Yang Zhou, Email: zysddbb1018@163.com.
Xuezhong Dai, Email: dxz6662022@163.com.
Jianhong Lyu, Email: L249218510@163.com.
Yingyue Li, Email: ivyisheng@outlook.com.
Xueyu Bao, Email: ynyh65@sina.com.
Fang Deng, Email: hhx609305@163.com.
Kun Liu, Email: liukun12139@163.com.
Liming Cui, Email: clm2206003@163.com.
References
- [1].Yeh S-J, Lin C-Y, Li C-W, et al. Systems biology approaches to investigate genetic and epigenetic molecular progression mechanisms for identifying gene expression signatures in papillary thyroid cancer. Int J Mol Sci. 2019;20:2536. [DOI] [PMC free article] [PubMed] [Google Scholar]
- [2].Mishra V, Kowtal P, Rane P, et al. Genetic risk association of CDKN1A and RET gene SNPs with medullary thyroid carcinoma: results from the largest MTC cohort and meta-analysis. Cancer Med. 2019;8:6151–61. [DOI] [PMC free article] [PubMed] [Google Scholar]
- [3].Zhu L, Li XJ, Kalimuthu S, et al. Natural killer cell (NK-92MI)-based therapy for pulmonary metastasis of anaplastic thyroid cancer in a nude mouse model. Front Immunol. 2017;8:816. [DOI] [PMC free article] [PubMed] [Google Scholar]
- [4].Guo D, Xu Q, Pabla S, et al. Cytokeratin-8 in anaplastic thyroid carcinoma: more than a simple structural cytoskeletal protein. Int J Mol Sci . 2018;19:577. [DOI] [PMC free article] [PubMed] [Google Scholar]
- [5].Zhao X, Li X, Zhou L, et al. LncRNA HOXA11-AS drives cisplatin resistance of human LUAD cells via modulating miR-454-3p/Stat3. Cancer Sci. 2018;109:3068–79. [DOI] [PMC free article] [PubMed] [Google Scholar]
- [6].Ren M, Wang T, Wei X, et al. LncRNA H19 regulates smooth muscle cell functions and participates in the development of aortic dissection through sponging miR-193b-3p. Biosci Rep. 2021;41:BSR20202298. [DOI] [PMC free article] [PubMed] [Google Scholar]
- [7].Zhang S-Y, Zhang S-W, Zhang T, et al. Recent advances in functional annotation and prediction of the epitranscriptome. Comput Struct Biotechnol J. 2021;19:3015–26. [DOI] [PMC free article] [PubMed] [Google Scholar]
- [8].Thongdee N, Jaroensuk J, Atichartpongkul S, et al. TrmB, a tRNA m7G46 methyltransferase, plays a role in hydrogen peroxide resistance and positively modulates the translation of katA and katB mRNAs in Pseudomonas aeruginosa. Nucleic Acids Res. 2019;47:9271–81. [DOI] [PMC free article] [PubMed] [Google Scholar]
- [9].Teng P-C, Liang Y, Yarmishyn AA, et al. RNA modifications and epigenetics in modulation of lung cancer and pulmonary diseases. Int J Mol Sci. 2021;22:10592. [DOI] [PMC free article] [PubMed] [Google Scholar]
- [10].Li H, Gao C, Zhuang J, et al. An mRNA characterization model predicting survival in patients with invasive breast cancer based on The Cancer Genome Atlas database. Cancer Biomark. 2021;30:417–28. [DOI] [PMC free article] [PubMed] [Google Scholar]
- [11].Rossi K, Echeverria D, Carroll A, et al. Development and evaluation of perl-based algorithms to classify neoplasms from pathology records in synoptic report format. JCO Clin Cancer Inform. 2021;5:295–303. [DOI] [PubMed] [Google Scholar]
- [12].Liberzon A, Birger C, Thorvaldsdóttir H, et al. The Molecular Signatures Database (MSigDB) hallmark gene set collection. Cell systems. 2015;1:417–25. [DOI] [PMC free article] [PubMed] [Google Scholar]
- [13].Ritchie M, Phipson B, Wu D, et al. limma powers differential expression analyses for RNA-sequencing and microarray studies. Nucleic Acids Res. 2015;43:e47. [DOI] [PMC free article] [PubMed] [Google Scholar]
- [14].Cao D, Xu N, Chen Y, et al. Construction of a pearson- and MIC-based co-expression network to identify potential cancer genes. Interdiscip Sci. 2022;14:245–57. [DOI] [PubMed] [Google Scholar]
- [15].Zhang M, Huo C, Liu J, et al. Identification of a five autophagy subtype-related gene expression pattern for improving the prognosis of lung adenocarcinoma. Front Cell Dev Biol. 2021;9:756911. [DOI] [PMC free article] [PubMed] [Google Scholar]
- [16].Yang X, Rao J, Yang W, et al. Evaluation of the predictive and prognostic values of stromal tumor-infiltrating lymphocytes in HER2-positive breast cancers treated with neoadjuvant chemotherapy. Target Oncol. 2018;13:757–67. [DOI] [PMC free article] [PubMed] [Google Scholar]
- [17].Amaador K, Vos J, Pals S, et al. Discriminating between Waldenström macroglobulinemia and marginal zone lymphoma using logistic LASSO regression. Leuk Lymphoma. 2022;63:1070–9. [DOI] [PubMed] [Google Scholar]
- [18].Feng J, Wu J, Zhu R, et al. Simple risk score for prediction of early recurrence of hepatocellular carcinoma within the Milan criteria after orthotopic liver transplantation. Sci Rep. 2017;7:44036. [DOI] [PMC free article] [PubMed] [Google Scholar]
- [19].Wang B, Sun Y. SELPLG expression was potentially correlated with metastasis and prognosis of osteosarcoma. Pathol Oncol Res. 2022;28:1610047. [DOI] [PMC free article] [PubMed] [Google Scholar]
- [20].Wang Q, Lin W, Zhu Y. Comprehensive analysis of a TNF family based-signature in diffuse gliomas with regard to prognosis and immune significance. Cell Commun Signal. 2022;20:6. [DOI] [PMC free article] [PubMed] [Google Scholar]
- [21].Yuan J, Jiang X, Lan H, et al. Multi-omics analysis of the therapeutic value of MAL2 based on data mining in human cancers. Front Cell Dev Biol. 2021;9:736649. [DOI] [PMC free article] [PubMed] [Google Scholar]
- [22].Awan F, Ali M, Hamid M, et al. Epi-gene: an R-package for easy pan-genome analysis. Biomed Res Int. 2021;2021:5585586. [DOI] [PMC free article] [PubMed] [Google Scholar] [Retracted]
- [23].D’Arrigo G, Leonardis D, Abd ElHafeez S, et al. Methods to analyse time-to-event data: the Kaplan-Meier survival curve. Oxid Med Cell Longevity. 2021;2021:2290120. [DOI] [PMC free article] [PubMed] [Google Scholar]
- [24].Wu W, Xu W, Sun W, et al. Forced vital capacity predicts the survival of interstitial lung disease in anti-MDA5 positive dermatomyositis: a multi-centre cohort study. Rheumatology (Oxford). 2021;61:230–9. [DOI] [PubMed] [Google Scholar]
- [25].Ren H, Zhu J, Yu H, et al. Angiogenesis-related gene expression signatures predicting prognosis in gastric cancer patients. Cancers (Basel). 2020;12:3685. [DOI] [PMC free article] [PubMed] [Google Scholar]
- [26].Ni J, Wu Y, Qi F, et al. Screening the cancer genome atlas database for genes of prognostic value in acute myeloid leukemia. Front Oncol. 2019;9:1509. [DOI] [PMC free article] [PubMed] [Google Scholar]
- [27].Hu K. Become competent in generating RNA-seq heat maps in one day for novices without prior R experience. Methods Mol Biol. 2021;2239:269–303. [DOI] [PubMed] [Google Scholar]
- [28].Yang T, Mao P, Chen X, et al. Inflammatory biomarkers in prognostic analysis for patients with glioma and the establishment of a nomogram. Oncol Lett. 2019;17:2516–22. [DOI] [PMC free article] [PubMed] [Google Scholar]
- [29].Li N, Luo P, Li C, et al. Analysis of related factors of radiation pneumonia caused by precise radiotherapy of esophageal cancer based on random forest algorithm. Math Biosci Eng. 2021;18:4477–90. [DOI] [PubMed] [Google Scholar]
- [30].Lamy P-J, Plassot C, Pujol J-L. Serum HE4: an independent prognostic factor in non-small cell lung cancer. PLoS One. 2015;10:e0128836. [DOI] [PMC free article] [PubMed] [Google Scholar]
- [31].Yu H, Chen X, Lu L. Large-scale prediction of microRNA-disease associations by combinatorial prioritization algorithm. Sci Rep. 2017;7:43792. [DOI] [PMC free article] [PubMed] [Google Scholar]
- [32].Liu X, Song C, Yang S, et al. IFI30 expression is an independent unfavourable prognostic factor in glioma. J Cell Mol Med. 2020;24:12433–43. [DOI] [PMC free article] [PubMed] [Google Scholar]
- [33].Wang X, Cao K, Guo E, et al. Identification of immune-related LncRNA pairs for predicting prognosis and immunotherapeutic response in head and neck squamous cell carcinoma. Front Immunol. 2021;12:658631. [DOI] [PMC free article] [PubMed] [Google Scholar]
- [34].Zhuang H, Huang S, Zhou Z, et al. A four prognosis-associated lncRNAs (PALnc) based risk score system reflects immune cell infiltration and predicts patient survival in pancreatic cancer. Cancer Cell Int. 2020;20:493. [DOI] [PMC free article] [PubMed] [Google Scholar]
- [35].Ito K, Murphy D. Application of ggplot2 to pharmacometric graphics. CPT Pharmacometrics Syst Pharmacol. 2013;2:e79. [DOI] [PMC free article] [PubMed] [Google Scholar]
- [36].Carpenter C, Frank D, Williamson K, et al. tidyMicro: a pipeline for microbiome data analysis and visualization using the tidyverse in R. BMC Bioinf. 2021;22:41. [DOI] [PMC free article] [PubMed] [Google Scholar]
- [37].Xia X, Li Y. Comprehensive analysis of transcriptome data stemness indices identifies key genes for controlling cancer stem cell characteristics in gastric cancer. Transl Cancer Res. 2020;9:6050–61. [DOI] [PMC free article] [PubMed] [Google Scholar]
- [38].Yao J, Chen X, Liu X, et al. Characterization of a ferroptosis and iron-metabolism related lncRNA signature in lung adenocarcinoma. J Radiat Res. Cancer Cell Int. 2021;21:340. [DOI] [PMC free article] [PubMed] [Google Scholar]
- [39].Bang HS, Choi MH, Kim CS, et al. Gene expression profiling in undifferentiated thyroid carcinoma induced by high-dose radiation. J Radiat Res. 2016;57:238–49. [DOI] [PMC free article] [PubMed] [Google Scholar]
- [40].Spriano G, Ruscito P, Pellini R, et al. Pattern of regional metastases and prognostic factors in differentiated thyroid carcinoma. Acta Otorhinolaryngol Ital. 2009;29:312–6. [PMC free article] [PubMed] [Google Scholar]
- [41].Pan Y, Wu L, He S, et al. Identification of hub genes in thyroid carcinoma to predict prognosis by integrated bioinformatics analysis. Bioengineered. 2021;12:2928–40. [DOI] [PMC free article] [PubMed] [Google Scholar]
- [42].Orellana EA, Liu Q, Yankova E, et al. METTL1-mediated mG modification of Arg-TCT tRNA drives oncogenic transformation. Mol Cell. 2021;81:3323–38.e14. [DOI] [PMC free article] [PubMed] [Google Scholar]
- [43].Dai Z, Liu H, Liao J, et al. N-Methylguanosine tRNA modification enhances oncogenic mRNA translation and promotes intrahepatic cholangiocarcinoma progression. Mol Cell. 2021;81:3339–55.e8. [DOI] [PubMed] [Google Scholar]
- [44].Chen B, Jiang W, Huang Y, et al. N-methylguanosine tRNA modification promotes tumorigenesis and chemoresistance through WNT/β-catenin pathway in nasopharyngeal carcinoma. Oncogene. 2022;41:2239–53. [DOI] [PubMed] [Google Scholar]
- [45].Huang Y, Liu Y, Mo G, et al. Inflammation markers have important value in predicting relapse in patients with papillary thyroid carcinoma: a long-term follow-up retrospective study. Cancer Control. 2022;29:10732748221115236. [DOI] [PMC free article] [PubMed] [Google Scholar]
- [46].Riguetto C, Barreto I, Maia F, et al. Usefulness of pre-thyroidectomy neutrophil-lymphocyte, platelet-lymphocyte, and monocyte-lymphocyte ratios for discriminating lymph node and distant metastases in differentiated thyroid cancer. Clinics (Sao Paulo, Brazil). 2021;76:e3022. [DOI] [PMC free article] [PubMed] [Google Scholar]
- [47].Gogali F, Paterakis G, Rassidakis G, et al. CD3(-)CD16(-)CD56(bright) immunoregulatory NK cells are increased in the tumor microenvironment and inversely correlate with advanced stages in patients with papillary thyroid cancer. Thyroid. 2013;23:1561–8. [DOI] [PubMed] [Google Scholar]
- [48].Poulaki V, Mitsiades C, McMullan C, et al. Regulation of vascular endothelial growth factor expression by insulin-like growth factor I in thyroid carcinomas. J Clin Endocrinol Metab. 2003;88:5392–8. [DOI] [PubMed] [Google Scholar]
- [49].Klein M, Vignaud J, Hennequin V, et al. Increased expression of the vascular endothelial growth factor is a pejorative prognosis marker in papillary thyroid carcinoma. J Clin Endocrinol Metab. 2001;86:656–8. [DOI] [PubMed] [Google Scholar]
Associated Data
This section collects any data citations, data availability statements, or supplementary materials included in this article.


