Abstract
Discrimination of self from non-self is fundamental to a wide range of immunological processes1. During pregnancy, the mother does not recognize the placenta as immunologically foreign because antigens expressed by trophoblasts, the placental cells that interface with the maternal immune system, do not activate maternal T cells2. Currently, these activation defects are thought to reflect suppression by regulatory T cells3. By contrast, mechanisms of B cell tolerance to trophoblast antigens have not been identified. Here we provide evidence that glycan-mediated B cell suppression has a key role in establishing fetomaternal tolerance in mice. B cells specific for a model trophoblast antigen are strongly suppressed through CD22–LYN inhibitory signalling, which in turn implicates the sialylated glycans of the antigen as key suppressive determinants. Moreover, B cells mediate the MHC-class-II-restricted presentation of antigens to CD4+ T cells, which leads to T cell suppression, and trophoblast-derived sialoglycoproteins are released into the maternal circulation during pregnancy in mice and humans. How protein glycosylation promotes non-immunogenic placental self-recognition may have relevance to immune-mediated pregnancy complications and to tumour immune evasion. We also anticipate that our findings will bolster efforts to harness glycan biology to control antigen-specific immune responses in autoimmune disease.
Despite its antigenic disparity with the mother, the placenta fails to induce the robust cellular and humoral immune responses observed following organ transplantation2. With mechanisms of maternal B cell tolerance yet to be explored, current insights into this paradox have largely come from work on T cells and the use of murine systems in which the conceptus expresses surrogate model antigens, which enables the visualization of antigen-specific responses. One major system uses transgenic concepti that express transmembrane chicken ovalbumin (mOVA), which is shed from placental trophoblasts into maternal blood and systemically presented by maternal antigen-presenting cells (APCs)4 (Extended Data Fig. 1). Such presentation does not induce maternal CD8+ T-cell priming even if mice are given co-stimulation-inducing adjuvants5–8, a situation that contrasts with the robust CD8+ T-cell priming observed when mOVA is expressed as a transplantation antigen by non-placental organs9,10.
Suppressed T-cell responses to trophoblast mOVA
To dissect the CD4+ T-cell responses induced by trophoblast mOVA (t-mOVA), which are less well characterized, we studied the behaviour of OVA-specific CD4+ T cells from OT-II TCR transgenic mice that were adoptively transferred into pregnant mice after mid-gestation (Extended Data Fig. 1). When transferred into control xB6 pregnant mice (which are wild-type (WT) C57BL/6 females impregnated by C57BL/6 males), injection of chicken-derived OVA (c-OVA) together with the T helper 1 (TH1)-polarizing adjuvants polyinosinic:polycytidylic acid (poly(I:C)) and agonistic anti-CD40 antibodies induced the priming of TH1 cells in the spleen. That is, the OT-II cells expanded, assumed an activated CD44hiCD62Llo surface phenotype and produced interferon-γ (IFNγ) (Fig. 1a–e). By contrast, in xmOVA pregnant mice (which are C57BL/6 females impregnated by C57BL/6 males bearing the mOVA transgene), the cells proliferated as expected4,11,12 but did not assume a CD44hiCD62Llo phenotype or produce IFNγ, even if the mice were treated with adjuvants (Fig. 1a–e). This defect was still apparent if the mice were also injected with c-OVA, which instead only induced more proliferation (Fig. 1a–e). Prior work on the endogenous CD4+ T-cell response to an epitope-modified t-mOVA noted a similar pattern, and it was attributed to the conversion, expansion and suppressive action of antigen-specific FOXP3+ regulatory T (Treg) cells13. We also noted a small increase in FOXP3+ OT-II cell frequency in xmOVA pregnancies (Extended Data Fig. 2a). However, when we took an experimental approach that allowed us to completely ablate Treg-cell-converted OT-II cells and partially ablate endogenous maternal Treg cells without causing pregnancy failure12 (Extended Data Fig. 2a, b), we found that xmOVA mice still showed poor priming of OT-II cells and suppressed responses to c-OVA (Extended Data Fig. 2c–f). Together, these results reveal a pattern of CD4+ T-cell suppression that operates at the level of effector differentiation yet appears independent of Treg cells.
Fig. 1 |. B cells present t-mOVA to CD4+ T cells, which leads to impaired CD4+ T-cell priming and suppressed responses to c-OVA.
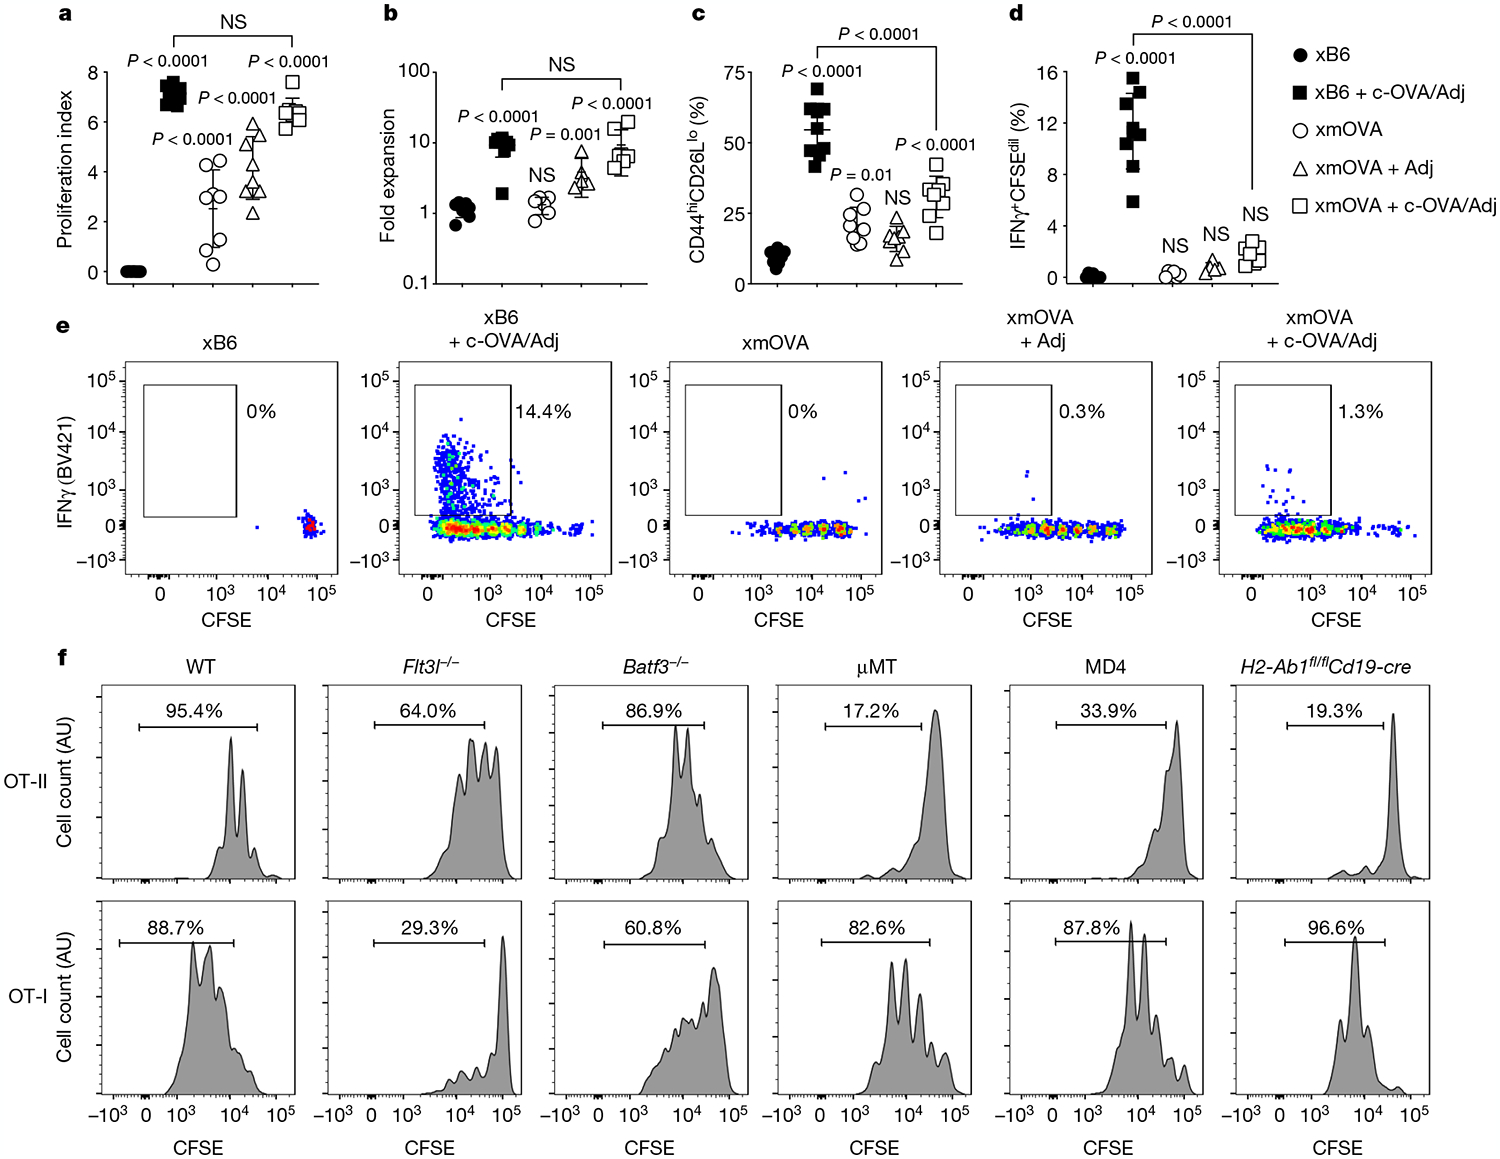
a–e, Proliferation index (a), fold expansion (b), activation marker expression (c), IFNγ production (d) and representative flow plots (e) of carboxyfluorescein diacetate succinimidyl ester (CFSE)-labelled OT-II cells 6 days after transfer on embryonic day (E) 12.5–E15.5 into WT females mated as indicated. Some groups received intravenous injections of adjuvants (Adj; comprised of poly(I:C) and anti-CD40 antibodies) with or without c-OVA at the time of OT-II transfer. Adjusted P values were determined by ordinary one-way analysis of variance (ANOVA) with Sidak’s multiple comparisons test. Each group was compared to the xB6 control group, and the xB6 + c-OVA/Adj group was compared to the xmOVA + c-OVA/Adj group. NS, not significant. Bars show mean ± s.d. Data were accumulated over 11 independent experiments and all mice are displayed. f, Representative CFSE dilution profiles (n ≥ 6 per group) indicating the extent of OT-II (top row) and OT-I (bottom row) cell proliferation 50 h after late-gestational transfer into xmOVA pregnant mice of the indicated genotypes. See Extended Data Fig. 3b, c for summary data.
B cells present t-mOVA to CD4+ T cells
Notably, the above pattern of suppression contrasted with that for CD8+ T cells, for which impaired responses to t-mOVA are not associated with suppressed responses to c-OVA8. To explain this divergence, we assessed whether different types of APCs were driving presentation to the different T-cell subsets. Indeed, following xmOVA mating, proliferation of OVA-specific CD8+ OT-I T cells but not OT-II cells was reduced in Flt3l−/− mice (which are deficient in dendritic cells (DCs)) and in Batf3−/− mice (which lack cross-presenting DCs). By contrast, OT-II but not OT-I cell proliferation was abrogated in μMT mice (which lack all B cells), in MD4 mice (which bear monoclonal B cells with irrelevant antigenic specificity) and in H2-Ab1fl/flCd19-cre mice (which exhibit impaired antigen presentation through MHC class II (MHCII) molecules specifically in B cells) (Fig. 1f and Extended Data Fig. 3a–c). OT-II cell proliferation was not restored by serum transfer from pregnant xmOVA mice into μMT mice, and it was not affected by macrophage deficiency (Extended Data Fig. 3d, e). As anticipated14, OT-II cell proliferation to c-OVA was intact in H2-Ab1fl/flCd19-cre mice (Extended Data Fig. 3f). Together, these results demonstrate that B cells present t-mOVA to CD4+ T cells, whereas non-B cells, most probably DCs, present c-OVA. This division of labour in turn indicates that the suppressed CD4+ T-cell response to both t-mOVA and c-OVA in xmOVA pregnancies reflects a dominantly acting effect of the presenting B cells.
t-mOVA-specific B cells are suppressed
As the loss of OT-II cell proliferation in MD4 mice implied that the presenting B cells are specific for OVA, we used fluorescently conjugated OVA tetramers15 (Extended Data Fig. 4) to visualize how these cells themselves respond to t-mOVA. In xmOVA pregnancies, OVA-specific follicular B cells displayed CD95 and MHCII upregulation that started after mid-gestation (Fig. 2a, b and Extended Data Fig. 5a–d), coincident with the known onset of t-mOVA release into the circulation8, and the cells increased in number and frequency by late gestation (Extended Data Fig. 5e, f). Although these observations indicated that antigen engagement occurred, the expansion was not strong and there was not substantial generation of GL7+CD95+ germinal centre (GC) cells, even when the mice were given poly(I:C) and low numbers of OT-II cells (Fig. 2c–e and Extended Data Fig. 5g, h). By contrast, this regimen induced strong GC responses in xB6 mice injected with c-OVA (Fig. 2c–e and Extended Data Fig. 5g, h). Moreover, B cell responses to c-OVA immunization were strongly suppressed in xmOVA pregnancies (Fig. 2c–e and Extended Data Fig. 5g, h), which parallels the OT-II cell response (Fig. 1c–e).
Fig. 2 |. Antigen-specific B cell suppression by t-mOVA.
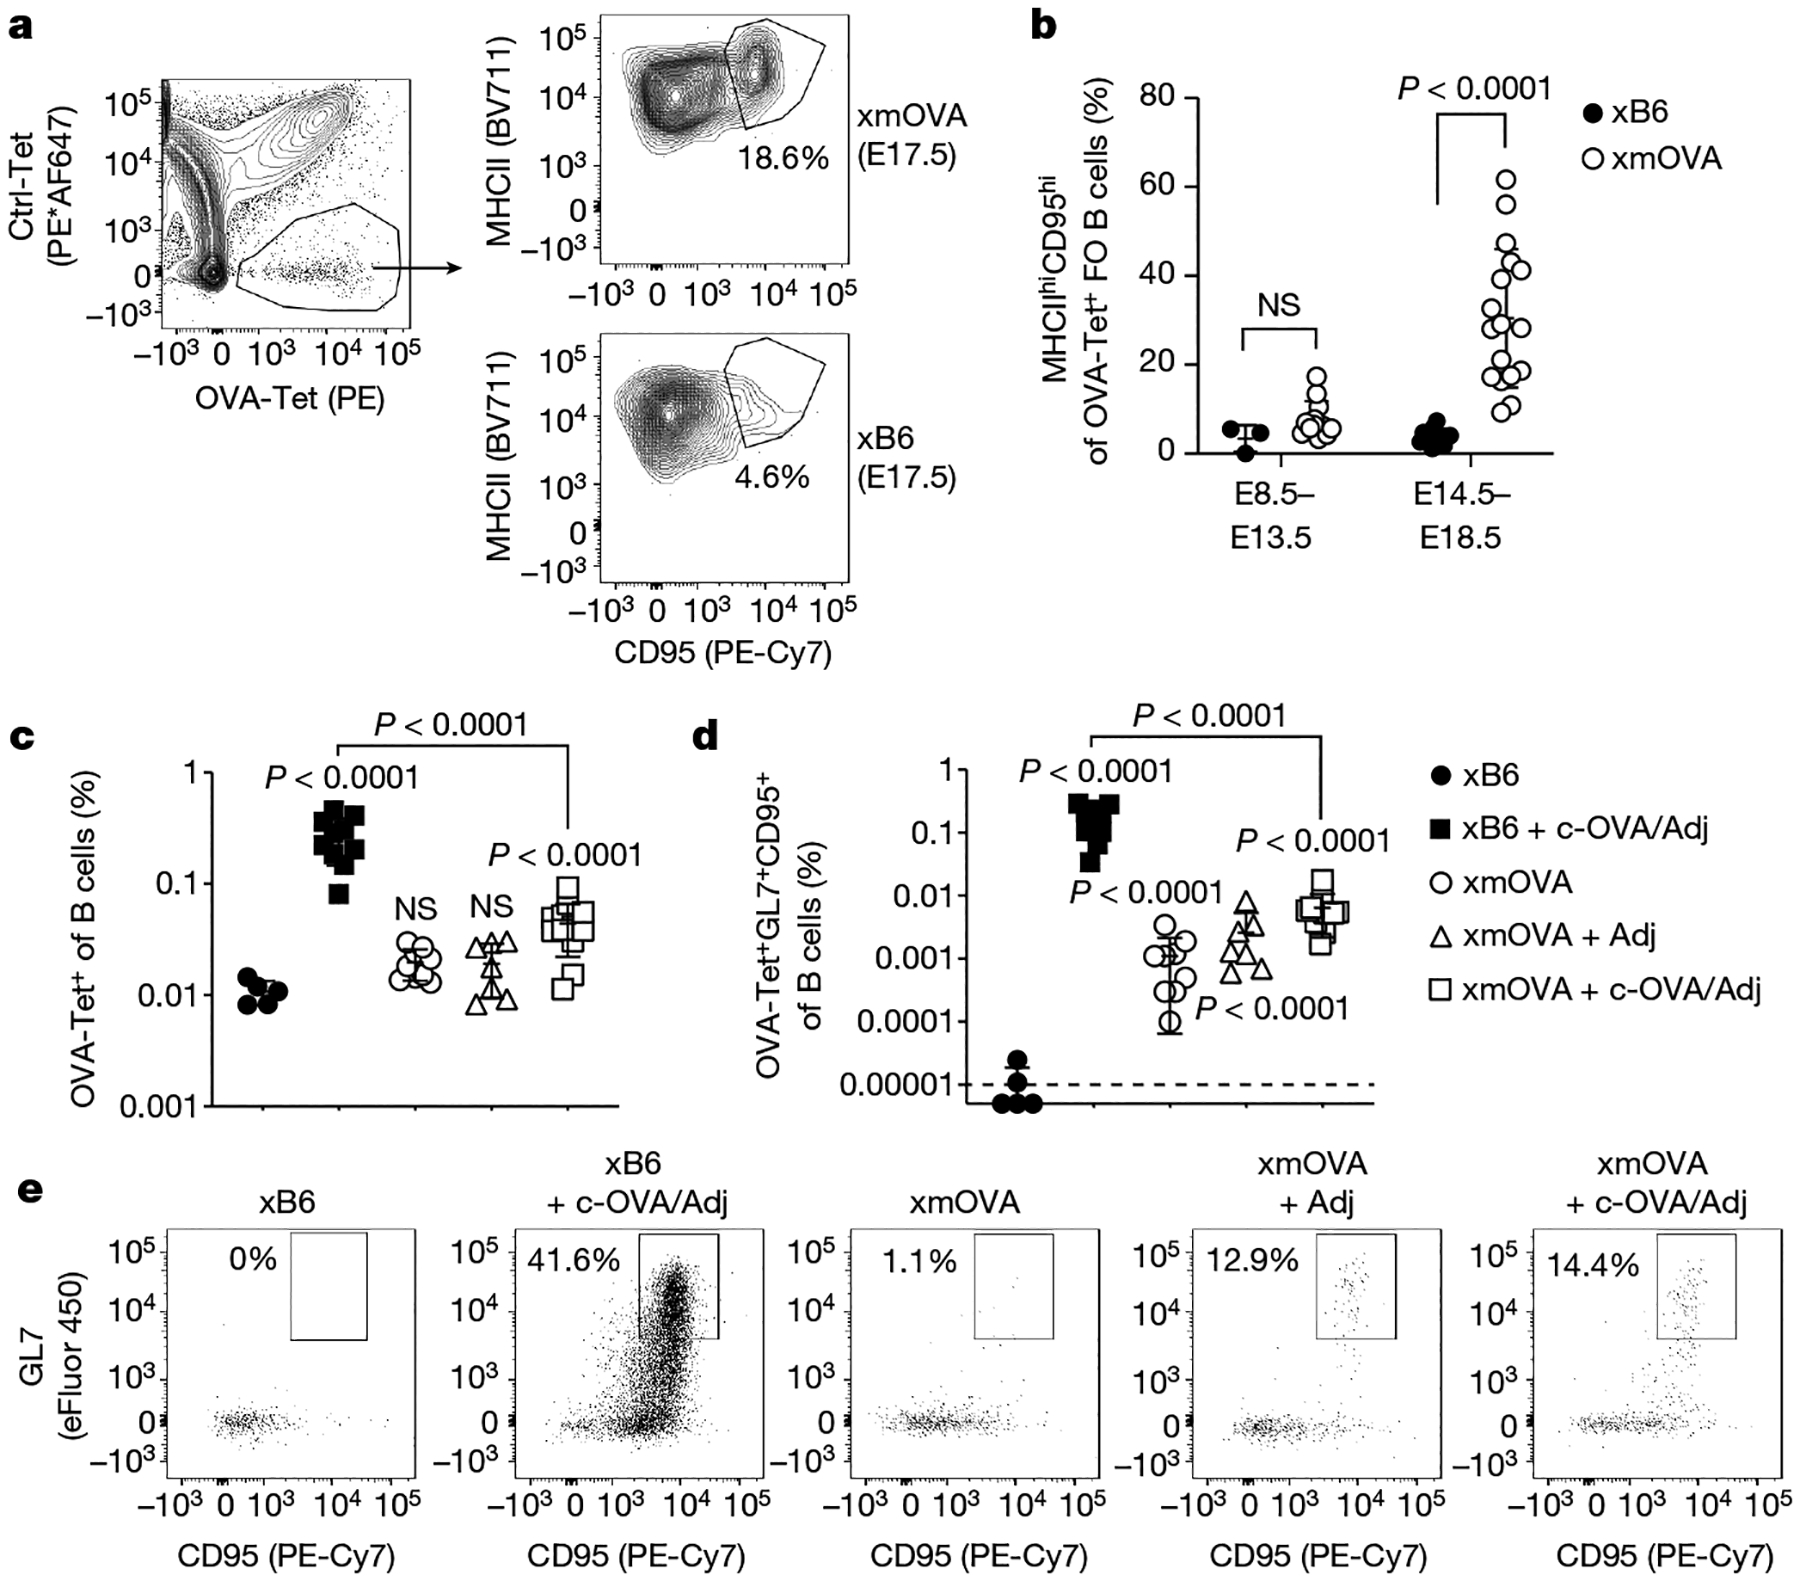
a, b, Phenotypic analysis of OVA-specific B cells from xB6 and xmOVA pregnancies showing t-mOVA-driven CD95 and MHCII upregulation at late gestation (E14.5–E18.5) in follicular (FO) cells, which were gated as DUMPnegCD19+CD21/CD35lo-medCD93neg. a, Representative contour plots on E17.5 are from n = 13 xB6 and n = 17 mOVA late gestation pregnancies. Ctrl-Tet, control-tetramer; OVA-Tet, OVA-tetramer. b, P values were determined by two-tailed, unpaired t-test. Bars show mean ± s.d. Data were accumulated over 22 independent experiments and all mice are displayed. c, d, Frequencies of total (c) or GL7+CD95+ GC phenotype (d) OVA-specific B cells 6 days after intravenous injection of 5 × 10⁴ OT-II cells with or without c-OVA and with or without poly(I:C) (Adj) on E11.5 or E12.5. Adjusted P values were determined by ordinary one-way ANOVA with Sidak’s multiple comparisons test as described in Fig. 1. Bars show mean ± s.d; dashed line shows limit of detection. Data were accumulated over 26 independent experiments and all mice are displayed. e, Representative flow plots of OVA-Tet+ B cells gated from a fixed number of total B cells across all groups.
Glycans mediate B cell suppression
These B cell defects were not explained by either a T follicular helper cell deficit or the generation of follicular regulatory T cells, even though pregnant mice showed nonspecific impairments in T follicular helper cell differentiation (Extended Data Fig. 6). Thus, we explored whether OVA-specific B cell activation was directly modulated by features of the t-mOVA protein itself. Indeed, t-mOVA, which circulated in maternal plasma in a free form not associated with extracellular vesicles (Extended Data Fig. 7a, b), was considerably heavier than c-OVA, a difference that was largely accounted for by the size of its N-linked glycans (Fig. 3a). Unlike c-OVA-associated glycans, which are primarily simple, high mannose structures16, t-mOVA-associated glycans contained terminal α(2,6)-linked and α(2,3)-linked sialic acids (α(2,6)-Sia and α(2,3)-Sia, respectively) (Fig. 3b, c and Extended Data Fig. 7c). These sialic acids, detected using Sambucus nigra lectin (SNA-I), which recognizes α(2,6)-Sia, and Maackia amurensis lectin I (MAL-I), which recognizes α(2,3)-Sia, decorated t-mOVA more extensively than mOVA from non-placental tissue sources (Fig. 3b, c and Extended Data Fig. 7c). Moreover, sialic acids were detected in trophoblast membranes that line the maternal blood spaces of the placenta (Extended Data Fig. 7d–i).
Fig. 3 |. CD22 and LYN mediate t-mOVA-induced B cell suppression.
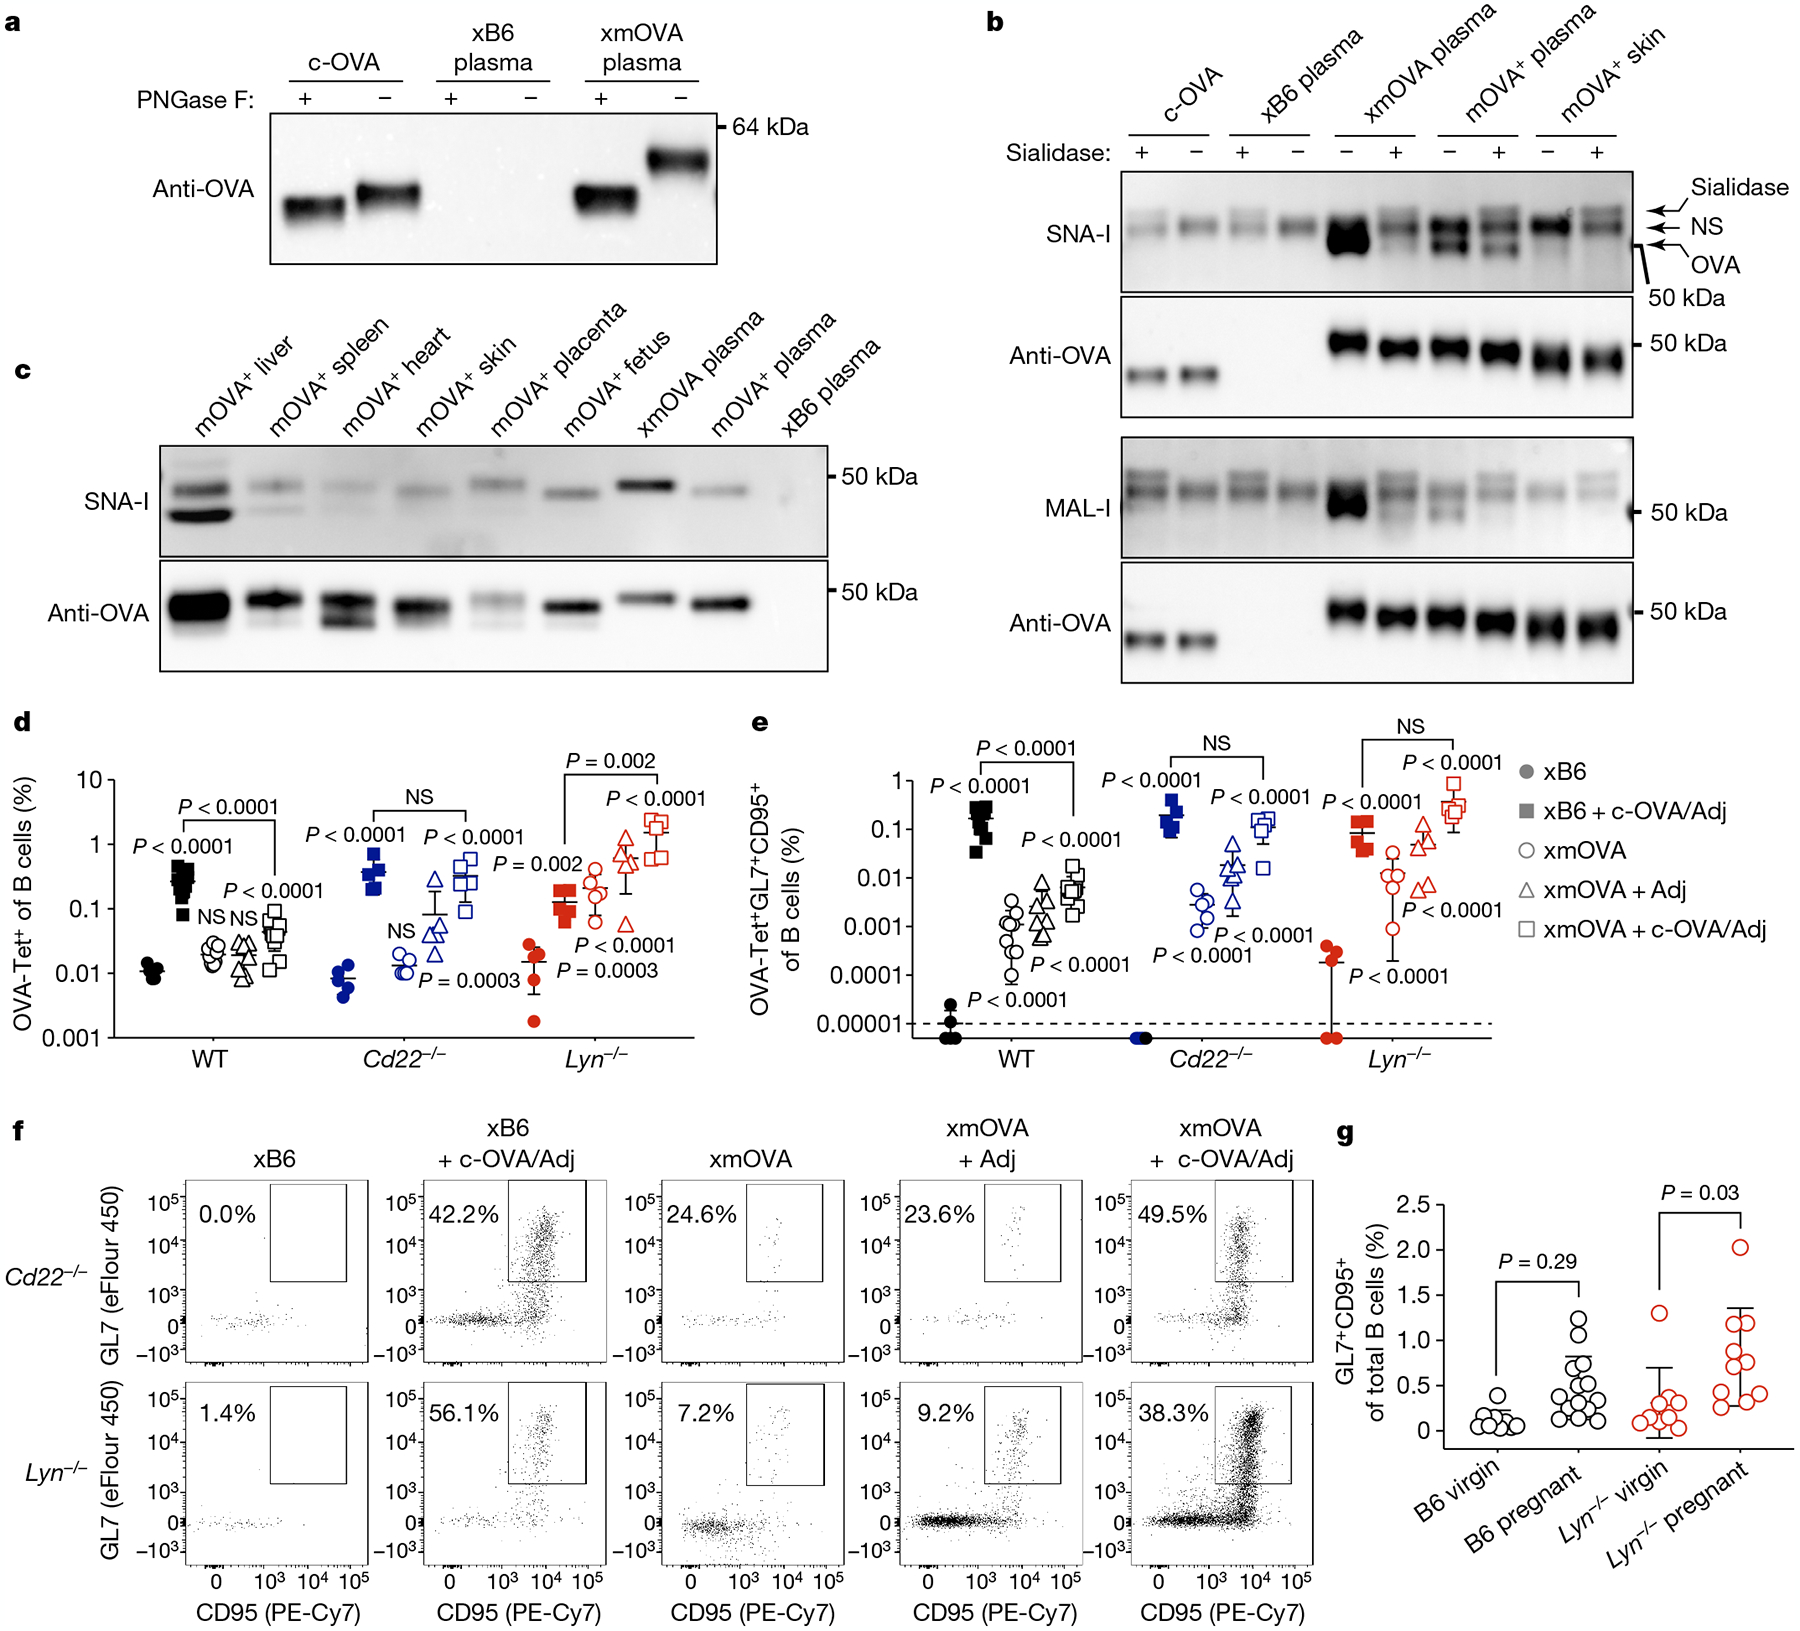
a, Extensive N-linked glycosylation of t-mOVA. Equal volumes of pooled plasma (n = 3 mice per group (E16.5–E18.5)) were subjected to anti-OVA immunoprecipitation, deglycosylation by PNGase F digestion as indicated, then anti-OVA immunoblotting. c-OVA was analysed in parallel. b, t-mOVA sialylation. OVA from various sources was subjected to anti-OVA immunoprecipitation, sialidase digestion as indicated, then lectin blotting. Plasma came from n = 3–4 pooled xB6 pregnant WT, xmOVA pregnant WT (both E15.5–E17.5) or non-pregnant Act-mOVA (mOVA+) transgenic females; skin came from non-pregnant mOVA+ transgenic females. Each lectin blot was stripped and re-probed with anti-OVA antibodies. A nonspecific (NS) species and the sialidase itself was detected on the lectin blots. c, α(2,6)-Sia prevalence on mOVA from various tissues of Act-mOVA mice. OVA was immunoprecipitated from tissue homogenates or plasma (as in b) and subjected to SNA-I blotting, then anti-OVA immunoblotting. Blots in a–c are each representative of two to three experiments, each with independent biological replicates. For gel source data, see Supplementary Fig. 1.d–f, Representative flow plots (f), frequencies of total (d) or GL7+CD95+ GC phenotype (e) OVA-specific B cells 6 days after vaccination as described in Fig. 2c–e. WT data are from Fig. 2c, d. The flow plots show OVA-Tet+ B cells gated from a fixed number of total B cells across all groups. Adjusted P values were determined by ordinary one-way ANOVA with Sidak’s multiple comparisons test as described in Fig. 1. Bars show mean ± s.d. Lyn−/− and Cd22−/− data were accumulated over 14 and 11 independent experiments, respectively, and all mice are displayed. g, B cell responses to presumptive endogenous trophoblast antigens. For pregnant mice, splenic B cells were analysed on E18.5 and combine data from n = 5–9 xB6 mice and n = 5 xmOVA mice per group. Adjusted P values were determined by ordinary one-way ANOVA with Sidak’s multiple comparisons test. Bars show mean ± s.d.
These observations are notable, as sialylation, including that of OVA itself in an experimental context17, imparts proteins with immunosuppressive properties by conferring on them the ability to engage the Siglec family of inhibitory surface receptors. In murine B cells, these are CD22 and Siglec-G, which bind α(2,6)-Sia and α(2,3)-Sia, respectively. CD22 expression is highly specific for B cells, and both Siglec proteins require the broadly expressed Src-family protein kinase LYN for activity18. Indeed, B cell responses to c-OVA were no longer suppressed in xmOVA Cd22−/− and Lyn−/− mice (Fig. 3d–f and Extended Data Fig. 8a–d). Moreover, Lyn−/− mice showed strong B cell accumulation and improved GC differentiation to t-mOVA alone, even without adjuvant administration and despite their generally poor GC responses, as previously noted19 (Fig. 3d–f and Extended Data Fig. 8c, d). By contrast, B cell responses were unchanged in mice that lack FcγRIIb, another LYN-dependent inhibitory receptor (Extended Data Fig. 8e–i). Together, these results suggest that t-mOVA suppresses OVA-specific B cells through LYN-dependent Siglec signalling. Notably, late-gestation pregnant Lyn−/− mice had a greater percentage of total B cells with a GC phenotype than their non-pregnant counterparts, with a similar trend apparent in WT mice (Fig. 3g). Since GC phenotype OVA-specific B cells are barely detectable in xB6 WT and Lyn−/− pregnant mice (that is, when there is no cognate antigen; Fig. 3e), these increases are probably antigen-driven and potentially reflect responses to endogenous trophoblast antigens that are further unmasked by LYN deficiency. Consistent with this possibility, we detected endogenous proteins of clear or probable trophoblast origin decorated with α(2,6)-Sia in the plasma of pregnant mice and humans (Extended Data Fig. 9).
LYN deficiency unmasks T-cell priming
Last, we tested whether the disinhibited B cell response in Lyn−/− mice promotes TH1-type priming to trophoblast antigen. Initial experiments revealed that the dosage of TH1-type-polarizing adjuvants used for the WT mice in Fig. 1 rapidly induced fetal loss in Lyn−/− mice (n = 3 out of 12), which probably was a result of systemic inflammation. However, lower dosages were compatible with pregnancy and induced comparable patterns of OT-II cell proliferation and expansion across genotypes (Fig. 4a, b). We also noted that IFNγ responses to c-OVA in xB6 pregnant Lyn−/− mice were lower than in WT mice (Fig. 4d, e), which is as expected from prior work using non-pregnant Lyn−/− mice20. However, in xmOVA Lyn−/− mice, OT-II cells were more activated, and their IFNγ production response to c-OVA was only slightly suppressed (Fig. 4c–e and Extended Data Fig. 10a, b). These observations implicate LYN-dependent signalling in CD4+ T-cell tolerance to trophoblast antigen, with the lack of fetal loss in Lyn−/− mice explained by the known inability of effector T cells to infiltrate the maternal–fetal interface21. We also found that the near complete deglycosylation of c-OVA did not alter its ability to induce immunogenic CD4+ T-cell responses or its B cell-independent presentation (Extended Data Fig. 10c–f). This result provides further support for the notion that the immunological properties of t-mOVA stem from the specific nature of its glycans. Interestingly, the improved priming of OT-II cells to c-OVA in xmOVA Lyn−/− mice could not be attributed to increased CD80 or CD86 expression by OVA-specific B cells. Such expression was suppressed by t-mOVA in WT mice and remained low in Lyn−/− mice (Extended Data Fig. 10g–j).
Fig. 4 |. CD4+ T-cell priming to t-mOVA in Lyn−/− mice.
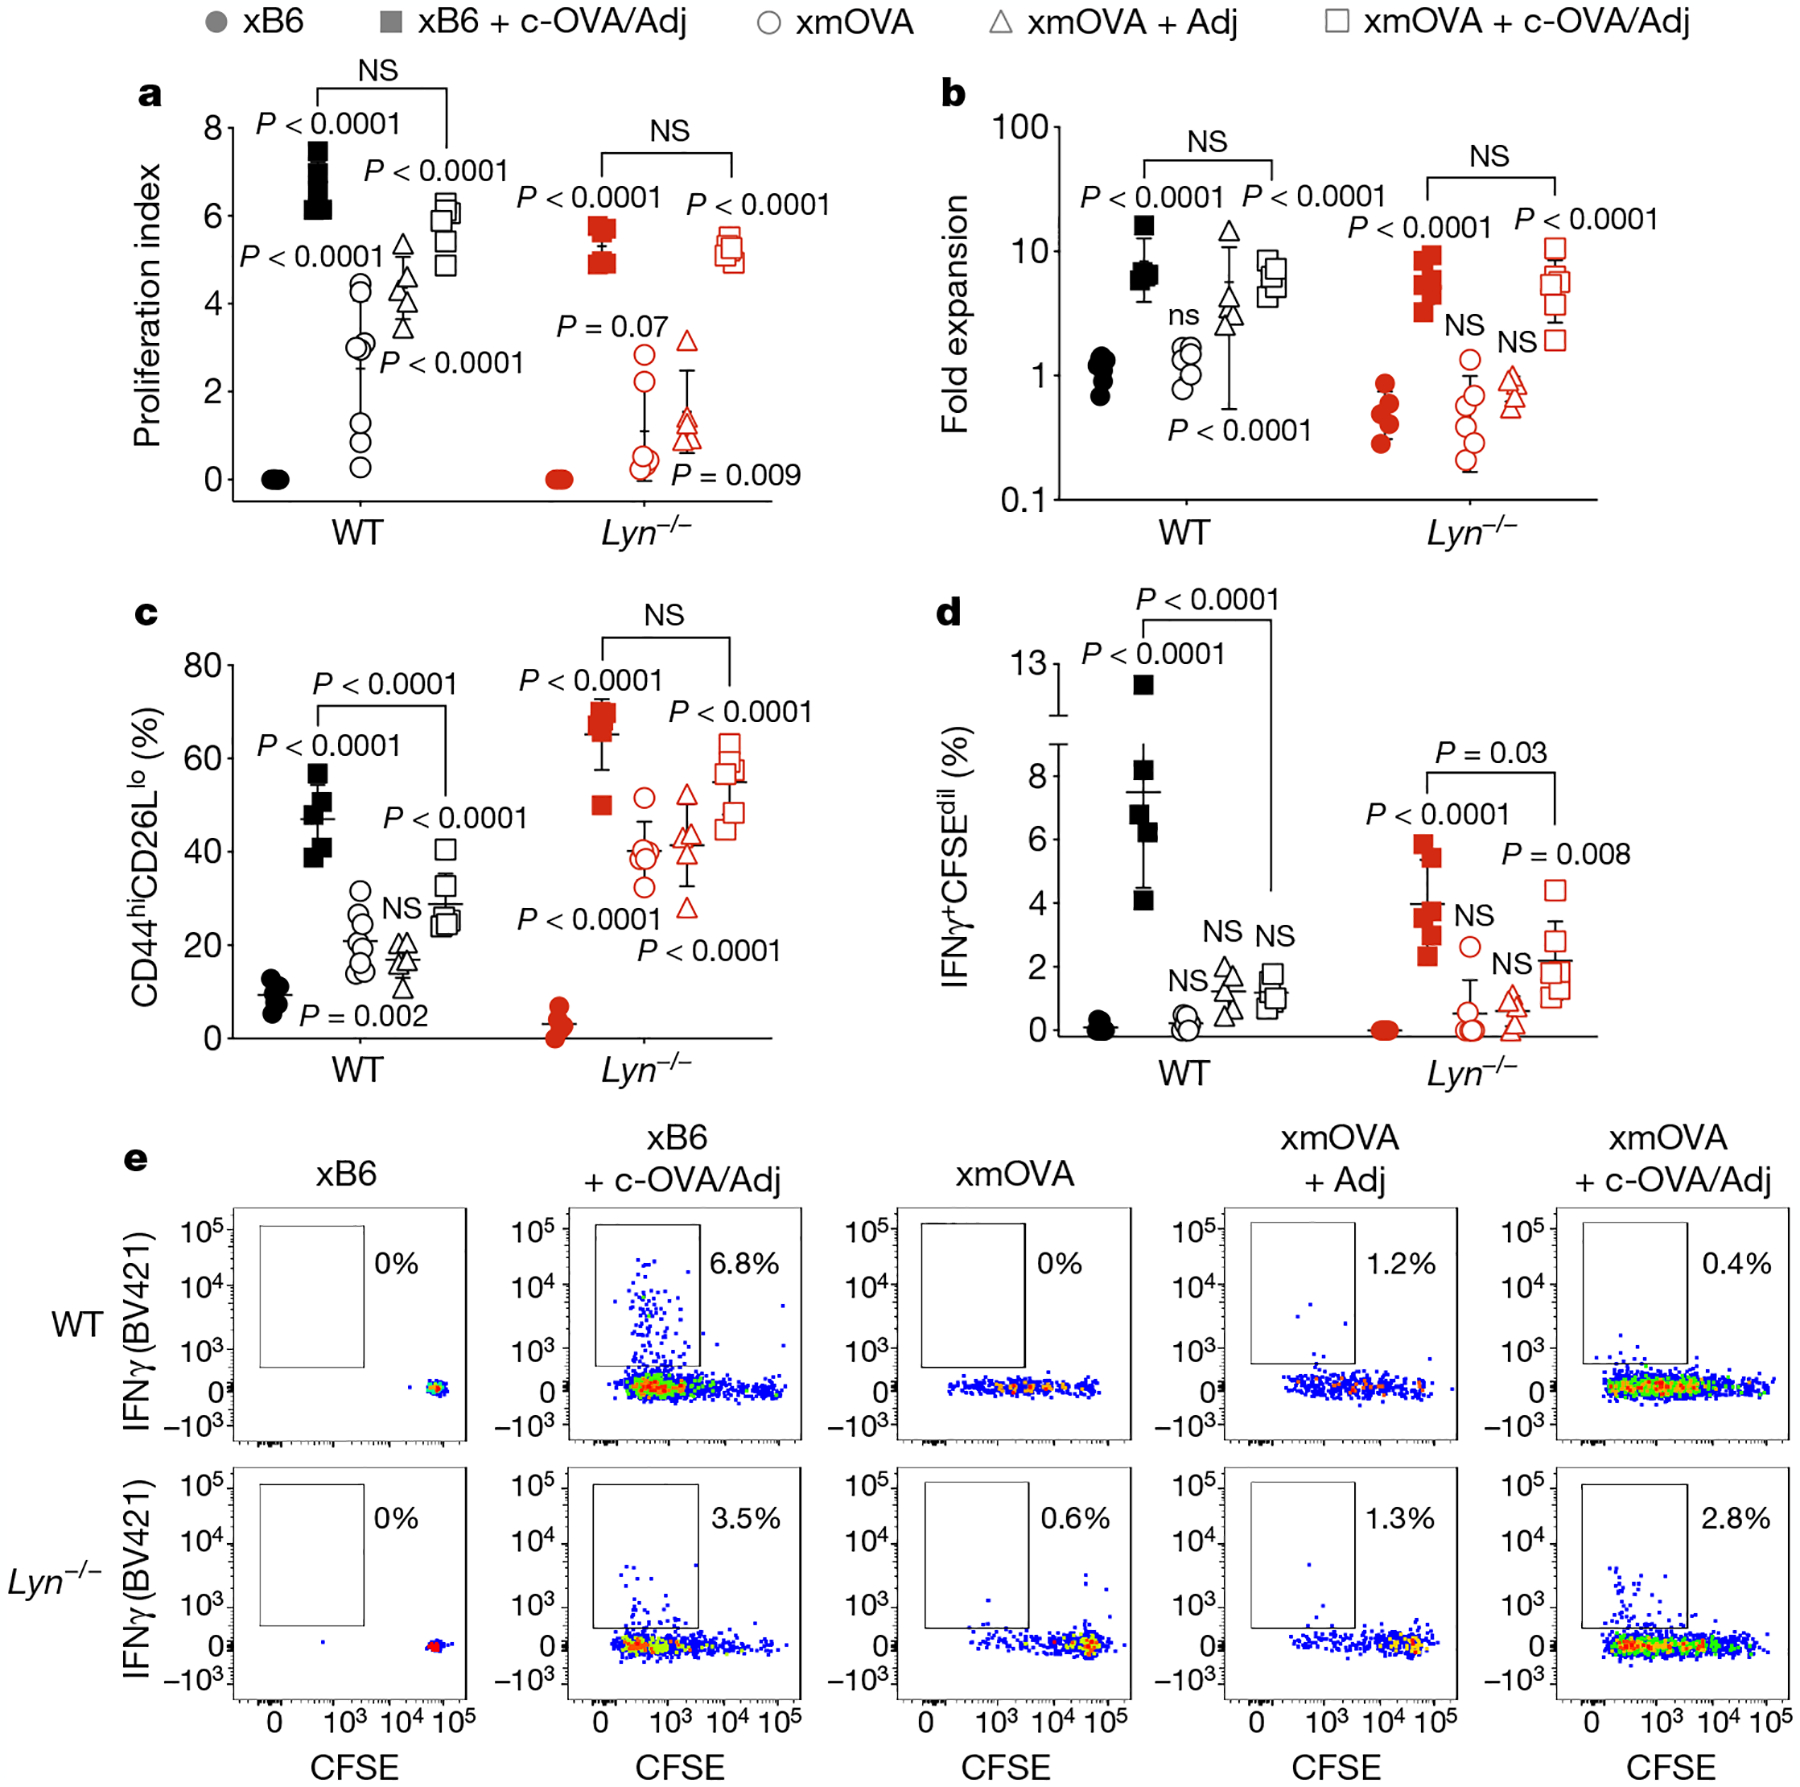
a–e, Proliferation index (a), fold expansion (b), activation marker expression (c), IFNγ production (d) and representative flow plots (e) of CFSE-labelled OT-II cells 6 days after transfer on E12.5–15.5 cells into pregnant WT (top row, e) or Lyn−/− (bottom row, e) mice mated as indicated. Some groups received intravenous injections of adjuvants (poly(I:C) and anti-CD40 antibodies) with or without c-OVA at the time of OT-II transfer. Data for untreated WT xB6 and untreated WT xmOVA mice are the same as in Fig. 1. Adjusted P values were determined by ordinary one-way ANOVA with Sidkak’s multiple comparisons test as described in Fig. 1. Bars show mean ± s.d. Data were accumulated over eight independent experiments and all mice are displayed.
Discussion
Prior work has indicated that trophoblast glycans are important for placental development22,23, and recent analyses of their composition in humans has led to the speculation that they regulate innate immune cells at the maternal–fetal interface24. By demonstrating their ability to induce strong, antigen-specific immune suppression to the antigens that they decorate, our data provide functional evidence that trophoblast glycans promote fetomaternal tolerance. Mechanistically, trophoblast glycans appear to act at least in part by directly engaging CD22 inhibitory signalling in antigen-specific follicular B cells, as suggested by the CD22 and LYN dependency of the suppression and the increased content of the CD22 ligand α(2,6)-Sia in t-mOVA compared to non-trophoblast mOVA. As B cells exclusively present trophoblast antigen to CD4+ T cells, B cell suppression in turn leads to cognate CD4+ T-cell suppression. Although our studies focused on responses to t-mOVA, a surrogate trophoblast antigen that is shed into the maternal circulation, we also identified α(2,6)-Sia-decorated endogenous mouse and human trophoblast antigens similarly circulating in maternal blood. Our data also suggest the existence of additional, superimposed, glycan-based pathways of immunosuppression. Notably, the higher α(2,3)-Sia content of t-mOVA compared to skin mOVA, an immunogenic form of the protein9, suggests a greater potential for t-mOVA to engage Siglec-G. As Siglec-G engagement by α(2,3)-Sia is tolerogenic in B cells independently of CD22 (ref.25), such engagement would explain why Lyn−/− mice show a more severe phenotype than Cd22−/− mice. In addition, t-mOVA, but not c-OVA or OVA from intravenously injected mOVA-expressing fetal splenocytes, accumulates on follicular dendritic cells in maternal spleen4, similar to what occurs in a glycan-dependent fashion with nanoparticle forms of viral antigens26. Such follicular targeting might foster fetomaternal tolerance to the extent that it promotes B cell-exclusive antigen presentation, given that such presentation often generates weak CD4+ T-cell responses27. Trophoblast antigen glycans might also recruit endogenous, sialylated proteins that in turn engage CD22 and/or Siglec-G. Together, these considerations suggest that trophoblast glycans, in aggregate, promote immune recognition of the placenta as a unique, non-immunogenic form of self. It is currently unknown how variations in trophoblast-specific glycosylation pathways might affect pregnancy outcome in humans, but we note that decreased LYN protein levels and high rates of pregnancy complications are both observed in patients with lupus28,29. The growing evidence for immune suppression by pathogen and tumour antigen glycosylation30 also suggests that the way glycosylation modulates immunity towards trophoblasts may have broad relevance.
Methods
Mice and experimental xmOVA matings
Mouse experiments were performed in accordance with institutional guidelines under protocols AN136579 and AN178689 approved by the Institutional Animal Care and Use Committee of the University of California San Francisco (UCSF). Mice were maintained in a specific pathogen-free facility at 25 °C, ambient humidity and a 12-h day/night cycle.
WT C57BL/6J and congenic CD45.1+ C57BL/6J (Ptprca) mice were purchased from The Jackson Laboratory. All knockout and transgenic mouse strains were on a C57BL/6 background. OT-I and OT-II TCR transgenic mice, additionally on a Rag2−/− background (B6.129S6-Rag2tm1Fwa Tg(TcraTcrb)1100Mjb and B6.129S6-Rag2tm1Fwa Tg(TcraTcrb) 425Cbn)31,32 were purchased from Taconic Biosciences. Batf3−/− mice (B6.129S(C)-Batf3tm1Kmm/J)33, μMT mice (B6.129S2-Ighmtm1Cgn/J)34 and mOVA mice (C57BL/6-Tg(CAG-OVAL)916Jen/J)9 were purchased from The Jackson Laboratory. Foxp3DTR knock-in mice (B6.129(Cg)-Foxp3tm3(DTR/GFP)Ayr/J)35, Flt3l−/− mice (C56BL/6-Flt3ltm1lmx/TacMmjax)36, Cd19-cre mice (B6.129P2(C)-Cd19tm1(cre)Cgn/J)37, CD169-DTR mice (B6;129-Siglec1tm1(HBEGF)Mtka)38, MD4 mice (C57BL/6-Tg(IghelM D4)4Ccg/J)39, H2-Ab1fl/fl mice (B6.129X1-H2-Ab1tm1Koni/J), ACTB-cre mice (B6.FVB-Tmem163Tg(ACTB-cre)2Mrt/EmsJ)40, Lyn−/− mice (Lyntm1Sor)41 and Cd22−/− mice (Cd22tm1Eac)42 were provided by colleagues at UCSF. Fcgr2bfl/fl mice43 were a gift from C. Mineo at the University of Texas Southwestern Medical Center.
OT-II mice were bred with congenic CD45.1+ C57BL/6 mice to generate a source of CD45.1+ OT-II cells. CD45.1+ OT-II mice were bred with Foxp3DTR mice to generate a source of CD45.1/2+ Foxp3DTR/Y OT-II cells. For B cell-specific deletion of MHCII, H2-Ab1fl/fl mice were bred with Cd19-cre mice to generate H2-Ab1fl/fl mice that were heterozygous for Cd19-cre. B cell-specific deletion was confirmed by flow cytometry and the absence of aberrant germline recombination by PCR on tail DNA (which occurred in a minority of offspring). Fcgr2b−/− mice were generated by breeding Fcgr2bfl/fl mice with ACTB-cre mice.
Gestational dating for experimental mice was based on the presence of a copulation plug evident the morning after mating (designated as embryonic day 0.5 (E0.5)). Mice were analysed on a rolling basis as they became pregnant. Because the mOVA line must be maintained in a hemizygous state, mating B6 WT females with mOVA males generated litters with variable numbers of mOVA concepti. To ensure strong maternal exposure to t-mOVA, we only analysed data from pregnant mice with litters containing two or more mOVA+ concepti. The pups were PCR-genotyped for the presence of the mOVA transgene as previously described4. All females used in experiments were 8–12 weeks of age.
Adoptive transfers, immunizations and depletions
CD4+ T cells from OT-II mouse donors were purified by magnetic-bead-based negative selection using a CD4+ T cell isolation kit (Miltenyi Biotec) per the manufacturer’s instructions. Whole splenocytes from OT-I Rag2−/− donors were used for the transfer of OT-I cells. Donor cells were washed twice in PBS and labelled with carboxyfluorescein diacetate succinimidyl ester (CFSE) as previously described44 using a Vybrant CFDA SE Cell Tracer kit (Invitrogen). Purity and viability were determined to be >95% by flow cytometry. Labelled cells were washed twice and resuspended in PBS. For studies measuring T-cell proliferation and priming, 1 × 10⁶ OT-II and/or 1–2 × 10⁶ OT-I cells were transferred into recipient pregnant mice via retro-orbital injection. To ensure technical consistency between the OT-II proliferation/priming experiments, each of these experiments included a positive and negative control. The negative control was an untreated WT virgin female that received OT-II cells, whereas the positive control was a xB6 or virgin female treated with c-OVA and adjuvant (c-OVA/Adj). For both of these controls, OT-II cell numbers, CFSE dilution, surface marker expression and cytokine production were measured. The untreated WT virgin female that received OT-II cells also provided the baseline for the calculation of OT-II fold-expansion (see below).
For priming OVA-specific B cell responses, mice received 300 μg endotoxin-free c-OVA (EndoFit Ovalbumin, InvivoGen; endotoxin levels <1 EU mg−1) and/or 100 μg poly(I:C) (HMW; VacciGrade, InvivoGen) and 5 × 10⁴ OT-II cells as a source of T cell help, as previously described45. OVA, adjuvant and cells were transferred into pregnant mice via retro-orbital injection on E11.5 or E12.5, as indicated.
For priming OT-II cell responses, pregnant mice were retro-orbitally injected with purified OT-II cells on E12.5–E15.5, followed several hours later with 300 μg endotoxin-free c-OVA and/or the combination of poly(I:C) and agonistic anti-CD40 antibodies (clone FGK45; InVivoMab, Bio × Cell). WT mice reported in Fig. 1 received 50 μg anti-CD40 antibodies and either 50 μg poly(I:C) (VacciGrade) or 100 μg poly(I:C) (γ-irradiated, Sigma); titration experiments revealed that these respective poly(I:C) doses induced equivalent OT-II responses in vivo. Because Treg-cell-deficient mice generate exaggerated inflammatory responses46, Foxp3DTR/WT mice (Extended Data Fig. 2) received a lower dose (15 μg) of poly(I:C) (γ-irradiated, Sigma). Similarly, lower doses of anti-CD40 antibodies (20 μg) and VacciGrade poly(I:C) (25 μg) were used for the experiments on Lyn−/− and WT control mice reported in Fig. 4. For evaluating immune responses to deglycosylated OVA, virgin mice were retro-orbitally injected with purified and CFSE-labelled OT-II cells, and several hours later intraperitoneally injected with 300 μg deglycosylated or mock-digested c-OVA (see below), 50 μg anti-CD40 antibodies and 50 μg VacciGrade poly(I:C).
The depletion of DTR-expressing cells in pregnant Foxp3DTR/WT mice (Extended Data Fig. 2) was accomplished by intraperitoneal injection of diphtheria toxin (DT) (unnicked, from Corneybacterium diphtheria, Calbiochem; reconstituted to a stock concentration of 5 ng μl−1 in sterile water). As previously described12, the mice were given an initial 25 μg kg−1 DT injection on E10.5, followed by daily maintenance doses of 5 μg kg−1.
For serum transfers from xmOVA pregnant mice into pregnant μMT mice, donor blood (from mice on E16.5–E17.5) was allowed to clot for 45 min at room temperature, then centrifuged at 1500g for 10 min to collect the serum supernatant. Recipient mice received two intraperitoneal serum injections (150 μl each), 18 and 6 h before further experimentation. To deplete maternal macrophages, clodronate liposomes (1 mg in PBS; Liposoma BV) were retro-orbitally injected into mice 24 h before experimentation47. Depletion of marginal zone macrophages in the CD169-DTR strain was accomplished by a single intraperitoneal injection of 10 μg kg−1 DT 48 h before further experimentation38.
Tetramer production and tetramer enrichment of OVA-specific B cells
The OVA-tetramer was constructed as previously described15 using a detailed protocol provided by D. Mueller at the University of Minnesota. In brief, purified OVA (albumin from chicken egg white, lyophilized powder ≥98% purity, Sigma) was biotinylated at a biotin-to-protein ratio of 1:1.3 using an EZ-link Sulfo-NHS-LC biotinylation kit (ThermoFisher Scientific). After the reaction, free biotin was removed with Zeba Spin desalting columns (ThermoFisher Scientific). The molar concentration of OVA protein was determined using the extinction coefficient of 0.0269 cm−1 μM−1 and sample absorbance at 280 nm, measured using a NanoDrop spectrophotometer (ThermoFisher Scientific). The molar concentration of the biotinylated-OVA was determined by western blotting as follows. Aliquots of biotinylated-OVA were incubated with titrating amounts of streptavidin-R-phycoerythrin (SA-PE; ProZyme/Agilent) before running them on a native gel, which was transferred and immunoblotted with SA-HRP (Jackson ImmunoResearch Laboratories). The lane with the highest SA-PE concentration that showed a positive band indicated the saturation point, and this was used to calculate the molar concentration of biotinylated-OVA. OVA-tetramer was formed by mixing biotinylated-OVA with SA-PE added in ten aliquots, each followed by gentle mixing and incubation at room temperature in the dark, to achieve a final ratio of 6:1 biotinylated-OVA to SA-PE. The tetramer fraction was separated from unreacted, monomeric components using 100 kDa MW cut-off Amicon Ultra-15 centrifugal filters (Millipore). The molar concentration of the PE-conjugated OVA-tetramer was determined using absorbance at 565 nm, measured using a SpectraMax190 with SoftMax Pro Software v.6.5 (Molecular Devices) and the extinction coefficient of PE (1.96 cm−1 μM−1).
The control-tetramer consisted of biotin-SA-PE*AF647, which identifies B cells that bound to the non-OVA components of the OVA-tetramer. The SA-PE*AF647 component was constructed as previously described15 using the same SA-PE conjugate as for the OVA-tetramer (SE-PE, Prozyme/Agilent), an AF647 (Alexa Fluor 647) labelling kit (Molecular Probes) and 100 kDa Amicon Ultra-15 centrifugal filters (Millipore) to remove unreacted components. The molar concentration of SA-PE*AF647 was determined using absorbance at 565 nm and the extinction coefficient of PE (1.96 cm−1 μM−1). Before each staining experiment, the SA-PE*AF647 reagent was tetramerized by incubation with a sixfold molar excess of biotin for at least 10 min on ice.
OVA-specific B cells from maternal spleens were identified using the above OVA-tetramer and control-tetramer and a magnetic-bead-based enrichment protocol, as previously described15. In brief, single-cell suspensions from whole spleens in staining buffer (PBS plus 2% FBS and 0.1% sodium azide) were incubated with unlabelled anti-FcγIII/II receptor blocking antibodies (clone 2.4G2; Bio × Cell) and about 10 nM SA-PE*AF647-conjugated control-tetramer at room temperature for 10 min, followed by the addition of about 5 nM PE-conjugated OVA-tetramer on ice for 30 min. The cells were washed, incubated on ice for 20 min with anti-PE MicroBeads UltraPure (Miltenyi), washed and then passed through a magnetized LS column (Miltenyi) per the manufacturer’s instructions. A small (5–10 μl) amount of final sample was used for cell counting with a haemocytometer. The specificity of the tetramer reagents was validated as described and shown in Extended Data Fig. 4.
Intracellular cytokine assay
Approximately 2 × 10⁶ splenocytes were stimulated at 37 °C with 10 μg ml−1 OVA peptide (amino acids 323–339). The peptide was purchased in amide lyophilized form from ANASPEC and reconstituted in sterile water. Control wells without peptide were included for all samples. Both brefeldin A (1 μl of GolgiPlug, BD) and 2 μM monensin (Abcam) secretion inhibitors were added to the culture after 1.5 h. After an additional 3.5 h of incubation, samples were stained as described below.
Flow cytometry
Spleens were collected in RPMI 1640 (Gibco) plus 10% FBS buffer, crushed and passed through a 70-μM mesh strainer (Corning). Red blood cells were lysed with eBioscience ammonium chloride RBC lysis buffer (Invitrogen). Surface staining was performed in PBS plus 2% FBS and 0.1% sodium azide (staining buffer) kept on ice and in the dark. If two or more BD Horizon Brilliant dyes were used in the same staining panel, then the cells were stained instead in BD Horizon Brilliant staining buffer to reduce dye interactions. After a pre-incubation with unlabelled anti-FcγIII/II receptor antibodies (clone 2.4G2; Bio × Cell), the cells were incubated with fluorochrome-conjugated antibodies for 20–30 min. Dead cells were excluded with either DAPI (Invitrogen), which was added immediately before acquisition, or LIVE/DEAD Fixable Blue Dead Cell Stain kit (Invitrogen), for which cells were incubated for 30 min in PBS on ice in the dark before surface staining.
The following surface antibodies were purchased from BD Biosciences (BD Pharmingen, BD Horizon, BD OptiBuild), BioLegend, Invitrogen or Tonbo: FITC-conjugated anti-Gr-1 (clone RB6–8C5), FITC-conjugated anti-CD11c (clone HL3), FITC-conjugated anti-Thy1.2 (clone 53–2.1), FITC-conjugated anti-F4/80 (clone BM8), PE-conjugated anti-CD8a (clone 53–6.7), PE-conjugated anti-PD1 (clone J43), PE-conjugated anti-CXCR5 (clone L138D7), PE- or PE-Cy7-conjugated anti-CD44 (clone 1M7), BV711- or PE-Cy7-conjgated anti-CD95 (clone Jo2), FITC- or PE-Cy7-conjugated anti-CD45.2 (clone 104), PerCP/Cy5.5-conjugated anti-CD45.1 (clone A20), APC-conjugated anti-CXCR5 (clone L138D7), APC-conjugated anti-PD1 (clone J43), APC- or APC/Cy7-conjugated anti-CD4 (clone GK1.5), BV605-conjugated anti-CD80 (clone 16–10A1), APC/Cy7-conjugated anti-CD86 (clone GL-1), APC/Cy7-conjugated anti-CD21/35 (clone 7E9), eFluor450-conjugated anti-GL7 (clone GL7), APC-eFluor780-conjugated anti-CD62L (clone MEL-14), BV605-conjugated anti-IgM (clone RMM-1), BV650-conjugated anti-CD93 (clone AA4.1), BV711-conjugated anti-I-A/I-E (clone M5/114.15.2), and BUV395-conjugated anti-CD19 (clone 1D3).
In some experiments, intracellular staining was performed after surface staining. For intracellular staining with BV421-conjugated anti-IFNγ (clone XMG1.2, BD), a BD Cytofix/Cytoperm kit was used per the manufacturer’s instructions. For intracellular staining with PE-conjugated anti-BCL6 (clone K112–91, BD) or with PE-Cy7-conjugated anti-FOXP3 (clone FJK-16s, Invitrogen), an eBioscience FOXP3/Transcription Factor Staining buffer set (Invitrogen) was used per the manufacturer’s instructions.
Sample acquisition was performed at the UCSF Parnassus Flow Cytometry Core using a five-laser BD LSRFortessa (BD) or a five-laser LSRII (BD) using FACSDiva software (v.8.0 and v.9.0, BD) and analysed with FlowJo software (v.10.7.1 for macOS, Tree Star). Flow plots are displayed as contour plots with outliers or pseudocolour plots with the exceptions of Figs. 2 and 3 and Extended Data Fig. 8e, for which dot plots are shown from a constant number of total B cells across mice. This latter approach was chosen so that we could illustrate both the differences in the total number of OVA-specific B cells between groups and the extent of their conversion to a GC phenotype.
Proliferation index and fold expansion
The proliferation index reflects the average number of cell divisions undergone by CFSE-labelled cells, and was calculated using the median fluorescence intensity of undivided cells (Fund) and all labelled cells (Fall) as follows: log(Fund/Fall)/log2 (ref.48). The fold expansion was calculated by dividing the absolute number of OT-II cells in each experimental mouse spleen by the absolute number of OT-II cells recovered from the spleen of the untreated virgin female control that received OT-II cells in parallel, which was included in all experiments.
Biochemical assessment and manipulation of OVA
For the preparation of mOVA from plasma, pregnant mice (E16.5–E18.5) and non-pregnant mOVA+ transgenic mice were given a retro-orbital injection of 5 USP heparin (heparin sodium salt from porcine intestinal mucosa, Sigma) 5 min before blood collection using a syringe and needle that was coated with PBS and 5 mM EDTA. Halt protease and phosphatase inhibitor cocktail (ThermoFisher Scientific) were added to the collected sample at a final concentration of 1×, and EDTA was added to a final concentration of 10 mM. Blood cells were pelleted by centrifugation at 300g for 10 min at 4 °C. Tissue homogenates were prepared by Dounce homogenization of finely minced tissues suspended in ice-cold RIPA buffer supplemented with Halt protease and phosphatase inhibitor cocktail. Skin specimens were derived from 3 × 3 cm patches of dermis and subcutis scraped from the dorsum. Plasma and tissue homogenate preparations were either used fresh or flash-frozen and stored at −80 °C.
To determine whether t-mOVA was present in extracellular vesicles in maternal plasma, the plasma was fractionated by differential centrifugation. Specifically, samples were diluted 5–10-fold in Ca2+/Mg2+-free DPBS (Gibco) with 5 mM EDTA and Halt protease and phosphatase inhibitor cocktail, then centrifuged at 10,000g for 30 min at 4 °C to pellet larger microvesicles. The supernatant was further ultracentrifuged at 110,000g for 2 h at 4 °C in 1-ml polycarbonate tubes (Beckman Coulter) using an OptimaMAX ultracentrifuge (Beckman Coulter) fitted with a TLA 120.2 rotor. After this spin, the supernatant was removed and the pellet, which contained exosomes, was resuspended by gentle vortexing and pipetting in Ca2+/Mg2+-free DPBS with 5 mM EDTA and Halt protease and phosphatase inhibitor cocktail.
Anti-OVA immunoprecipitation was performed using anti-OVA antibody-coupled microbeads. Specifically, 2 μg of polyclonal rabbit anti-OVA antibodies (product FL12, MBS440115, MyBioSource) was coupled to 50 μl Dynabeads sheep anti-rabbit IgG (Invitrogen) per the manufacturer’s instructions by rotation for 3 h at room temperature. For the immunoprecipitation of OVA from plasma, the samples were brought to 1 ml in Ca2+/Mg2+-free DPBS (Gibco) with 5 mM EDTA, and Halt protease and phosphatase inhibitor cocktail. A total of 50 μl of the antibody-coupled beads was then added, and the samples were rotated overnight at 4 °C. The samples were then washed 6 times in Ca2+/Mg2+-free DPBS with 5 mM EDTA and 200 mM NaCl, and then once in Ca2+/Mg2+-free DPBS. For the immunoprecipitation of OVA from tissues, 50 μl of the antibody-coupled beads was added to tissue homogenates suspended in 1 ml RIPA buffer, and the samples were rotated overnight at 4 °C. The samples were then extensively washed (8–12 times) in Ca2+/Mg2+-free DPBS with 5 mM EDTA, 500 mM NaCl and 1% NP-40, and then once in Ca2+/Mg2+-free DPBS. In some experiments, plasma and/or tissue samples were subjected to pre-clearing by rotation for 2 h at 4 °C with non-immune polyclonal anti-rabbit IgG (Santa Cruz) antibody-coupled microbeads.
The Dynabead-bound immunoprecipitated material was manipulated further in various ways. For PNGase F digestion, which removes all N-linked glycans49, the material was eluted by boiling in Glycoprotein Denaturing buffer (New England Biolabs) and then digested with PNGase F (Glycerol-Free, New England Biolabs) in GlycoBuffer 2 buffer (New England Biolabs) and 1% NP-40 for 1 h at 37 °C. For sialidase digestion, the material was incubated for 7 min at 70 °C in NuPAGE LDS sample buffer (Invitrogen) supplemented with NuPAGE sample reducing agent (Invitrogen). The eluted material was then digested with sialidase A (sialidase 51 kDa isoform, Agilent) for 24 h at 37 °C in the eluent buffer supplemented with reaction buffer B from a Sialidase Sampler kit (Agilent). For direct analysis by lectin blotting followed by anti-OVA immunoblotting, the material was boiled in NuPAGE LDS sample buffer supplemented with 10 mM N-ethylmaleimide (NEM, Sigma) and heated to 70 °C so that free immunoglobulin heavy chain would not be released. Immunoglobulin heavy chain generates a glycosylated background band of similar size to OVA even in non-reducing conditions50. This band can be seen in the sialidase treatment experiments (Fig. 3b and Extended Data Fig. 7c) as these experiments involved release of immunoprecipitated material from the Dynabeads under reducing conditions. In experiments involving only the detection of OVA (for example, Fig. 3a), NEM was not added to the sample buffer, and samples were boiled in NuPAGE LDS sample buffer supplemented with NuPAGE sample reducing agent. Nitrocellulose membranes were used for lectin blotting (with or without subsequent immunoblotting) and PVDF membranes were used when only immunoblotting was performed.
The following antibodies for immunoblotting were used: mouse anti-OVA (clone 1E7, Abcam, 1:2,000), rat anti-CD9 (clone KMC8.8, Santa Cruz Biotechnology, 1:200), polyclonal chicken anti-Neu5Gc (batch Poly21469, BioLegend, 1:1,500), HRP-conjugated goat anti-mouse IgG (preabsorbed; Abcam, 1:5,000), HRP-conjugated goat anti-rat IgG (Invitrogen, 1:10,000), and HRP-conjugated rabbit anti-chicken IgY (Millipore Sigma, 1:5,000). Immunoblotting for Neu5Gc was performed after overnight blocking with Neu5Gc assay blocking solution (BioLegend). For lectin immunoblots, the membranes were blocked with 1% BSA in 0.25 M Tris-Cl, 0.5 M NaCl, 0.5% NP-40, pH 8.0, then incubated overnight at 4 °C in this same buffer without BSA but instead containing 0.5 μg ml−1 biotin-conjugated S. nigra lectin (SNA-I; Elderberry Bark, EY Laboratories), 1 μg ml−1 biotin-conjugated M. amurensis lectin I (MAL-I, Vector Laboratories) or 0.5 μg ml−1 biotin-conjugated concanavalin A (Vector Laboratories), followed by incubation with SA-HRP (Jackson ImmunoResearch Laboratories, 1:10,000). In some experiments, lectin-probed nitrocellulose membranes were incubated for 30 min at 56 °C in Restore western blot stripping buffer (ThermoFisher Scientific), blocked and re-probed for OVA.
Deglycosylated c-OVA was prepared by heating endotoxin-free OVA (InvivoGen) in glycoprotein denaturing buffer (New England Biolabs) for 10 min at 100 °C, followed by incubation for 48 h at 37 °C with endoglycosidase H (Endo Hf, New England Biolabs) in the supplied GlycoBuffer 3 at a ratio of 3 μl Endo Hf to 20 μg OVA. Following enzyme deactivation at 75 °C for 10 min, samples were desalted and recovered in PBS using Zeba spin desalting columns (7,000 MW cut-off, 5 ml, ThermoFisher Scientific). Denaturation and mock digestions were performed in parallel. Endo Hf was chosen to deglycosylate c-OVA due to its scalability. The enzyme is expected to remove the high mannose glycans of OVA, as confirmed by concanavalin A lectin blotting (described below), leaving behind only a single N-linked GlcNAc residue49.
Plasma sialoglycopeptide preparation, mass spectrometry and analysis of plasma proteins by lectin blotting
Human plasma was collected from healthy women after provision of informed consent (IRB numbers 20–32077 and 19–29812, UCSF). Plasma from pregnant women was collected at the time of term delivery (>37 weeks). Mouse plasma was collected from virgin and xmOVA-pregnant mice (E15.5–E17.5). The samples were spiked with protease inhibitors (AEBSF to a final concentration of 100 μM, E-64 to 10 μM, pepstatin A to 10 μM, bestatin to 10 μM, and EDTA to 5 mM), and 200 μl of each was processed as previously described51 with minor modifications. Specifically, the 14 most abundant proteins in human plasma and the 3 most abundant proteins in mouse plasma were removed using the multiple affinity removal system (MARS; Agilent) (4.6 × 100 mm Hu-14 HPLC column and Ms-3 spin cartridge, respectively). The flow-through fractions were buffer-exchanged into 250 mM ammonium bicarbonate with 10 μM pepstatin A and 10 μM bestatin using Amicon ultra centrifugal filter units (5 ml capacity, 3,000 MW cut-off, Millipore). The retentates were brought to 3.75 M urea, reduced and alkylated with 10 mM TCEP and 40 mM iodoacetamide, then diluted to 1.5 M urea and 250 mM ammonium bicarbonate. CaCl2 (final concentration 2 mM) and trypsin (ThermoFisher Scientific; 1:50 trypsin:protein ratio, with a total protein concentration of 3 mg ml−1) were then added, and the samples were digested on the filter for 18 h at room temperature. The recovered peptides were passed through SOLA C18 solid phase extraction (SPE) cartridges (ThermoFisher Scientific) and quantified by NanoDrop (ThermoFisher Scientific).
For the analysis of α(2,6)-Sia-containing glycopeptides, volumes of peptide samples corresponding to equivalent volumes of starting plasma were loaded onto a SNA-I lectin agarose column (0.25 ml bed volume, Vector Laboratories) in 25 mM Tris buffer (pH 7.4) with 50 mM NaCl, 10 mM CaCl2 and 10 mM MgCl2, and the bound material was eluted first with 200 mM acetic acid and 500 mM lactose, and then with 200 mM acetic acid. Eluates were then neutralized with 2 M Tris base, recovered and passed through SOLA C18 SPE cartridges (ThermoFisher Scientific), vacuum dried and dissolved in 15 μl of 10 mM ammonium bicarbonate. PNGase F (5 μl of 500,000 U ml−1, glycerol free, New England Biolabs) was added and the mixture was incubated at 37 °C for 24 h to release the N-glycans. PNGase F was then removed using Nanosep centrifugal filters (3,000 MW cut-off, Pall Corporation) and the filtrates were vacuum dried, dissolved in 6 μl of 2% acetonitrile, 0.1% formic acid, and analysed by liquid chromatography with tandem mass spectrometry (LC–MS/MS; described below) in duplicate 2 μl injections.
LC–MS/MS analysis was performed using a NanoLC 425 Ultra system (Eksigent Technologies) interfaced with a TripleTOF 6600 mass spectrometer (SCIEX). Peptides were injected into a trap column (NanoLC Trap ChromXP, 350 μm i.d. × 0.5 mm, 3-μm particle size, 120 Å pore size) and then separated using a ChromXP C18 column (75 μm i.d. × 15 cm, 3-μm particle size, 120 Å pore size) using mobile phase A (aq. 2% acetonitrile, 0.1% formic acid) and mobile phase B (0.1% formic acid in acetonitrile) in conjunction with a linear gradient of 3–40% B for 105 min at a constant 300 nl min−1 flow rate. Using electrospray ionization, the TripleTOF 6600 was operated in data-dependent acquisition mode for MS and MS/MS data collection. An initial survey was acquired (m/z of 400–1250) at mass resolution 30,000, followed by collision-induced dissociation of precursor ions to produce MS/MS spectra from the 15 most abundant precursor ions.
Peptide and protein identifications were determined using the Paragon algorithm within the ProteinPilot search engine (v.5.0.2, SCIEX) against the corresponding proteome FASTA files obtained from Uni-Prot. The mouse proteome files were appended to include c-OVA (Uni-Prot entry P01012). A given peptide was scored as present if it reached >95% confidence according to the algorithm and contained at least one N-X-S/T/C motif (where X is any amino acid except for glycine or proline) whose asparagine (N) showed the deamidated ‘scar’ (that is, aspartic acid substitution) that resulted from PNGase F treatment.
For the analysis of sialic acid profiles of plasma proteins, volumes of MARS-depleted plasma corresponding to equivalent volumes of starting plasma were boiled in NuPAGE LDS sample buffer supplemented with NuPAGE sample reducing agent, separated by SDS–PAGE, and subjected to lectin blotting and anti-Neu5Gc immunoblotting (both as described above), as well as silver staining using a Pierce Silver Stain kit (ThermoFisher Scientific). For mouse samples, the volumes of starting plasma were 0.04 μl for SNA-I blotting, 0.125 μl for MAL-I blotting, 0.01 μl for anti-Neu5Gc blotting and 0.003 μl for silver staining. For human samples, the volumes of starting plasma were 0.01 μl for SNA-I blotting, 0.04 μl for MAL-I blotting and 0.007 μl for silver staining.
Immunofluorescence
Uterine tissues were fixed overnight at 4 °C in 4% paraformaldehyde/PBS and embedded in paraffin. Sections were cut at 5 μm, baked for 30 min at 65 °C, then deparaffinized in xylene and ethanol using standard methods. The slides were incubated in methanol containing 3% H2O2 in PBS for 20 min. The sections were then subjected to antigen retrieval with 1 mg ml−1 trypsin (trypsin from porcine pancreas, 1 mg tablets, Sigma) in PBS for 11 min at 37 °C. For Neu5Gc staining, sections were blocked in Neu5Gc assay blocking solution (BioLegend) for 1 h at room temperature, followed by application of polyclonal anti-Neu5Gc antibodies (batch poly21469, BioLegend, 1:200). For SNA-I staining, sections were blocked in Pierce protein-free blocking buffer (ThermoFisher Scientific) with 0.004% Triton X-100 for 1 h at room temperature, followed by application of biotin-conjugated SNA-I lectin (EY Laboratories, 1:200). Slides were washed three times in PBS between all subsequent steps. The Neu5Gc and SNA-I stained sections were incubated for 45 min at room temperature with 5 μg ml−1 goat anti-chicken-Alexa Fluor 594 (Abcam) or streptavidin-Alexa Fluor 594 (Jackson ImmunoResearch Laboratories), respectively, and then mounted using DAPI mounting medium (Electron Microscopy Sciences). All immunofluorescence images were captured using an Axio Imager M2 and Zen software v.2.6 (blue edition) (Zeiss).
For SNA-I control staining, adjacent sections were incubated with 4,000 U ml−1 alpha2,3,6,8,9 neuraminidase A (New England Biolabs) for 2 h in a moist chamber at 37 °C before application of the primary antibody. For Neu5Gc control staining, adjacent sections were incubated with 40 mM Neu5Gc (Santa Cruz Biotechnology) added in with the anti-Neu5Gc antibodies.
Statistical analysis and reproducibility
All data were analysed using Prism v.9.1.0 for macOS (GraphPad). Data that are displayed on a log scale were log-transformed before analysis. Values below the limit of detection were set at the limit of detection (most conservative estimate). All data comparing more than two groups were analysed using ordinary one-way analysis of variance, and if significant (P < 0.05), were further analysed by Sidak’s multiple comparisons test. Experiments involving only two groups were analysed using two-tailed unpaired t-test. All P and Padj values < 0.05 were considered significant. The number of mice for each group is shown on the graphs, and at minimum there were n = 5 mice per group with the following exceptions in which there were only n = 3 mice in some groups: Fig. 2b, and Extended Data Figs. 2a–f, 3d–f, 5a–d and 10c–f.
Each mouse experiment with multiple subgroups was performed in a rolling fashion over several years as the mice became available and were successfully impregnated. As described above, technical consistency for the OT-II cell proliferation/priming experiments was ensured by including in each experiment an untreated WT virgin female for which the analysis of OT-II cell numbers, CFSE dilution, surface marker expression and cytokine production provided a negative control, and a c-OVA/Adj-immunized xB6 or virgin female for which these parameters provided a positive control.
Reporting summary
Further information on research design is available in the Nature Research Reporting Summary linked to this paper.
Extended Data
Extended Data Fig. 1 |. Experimental scheme.
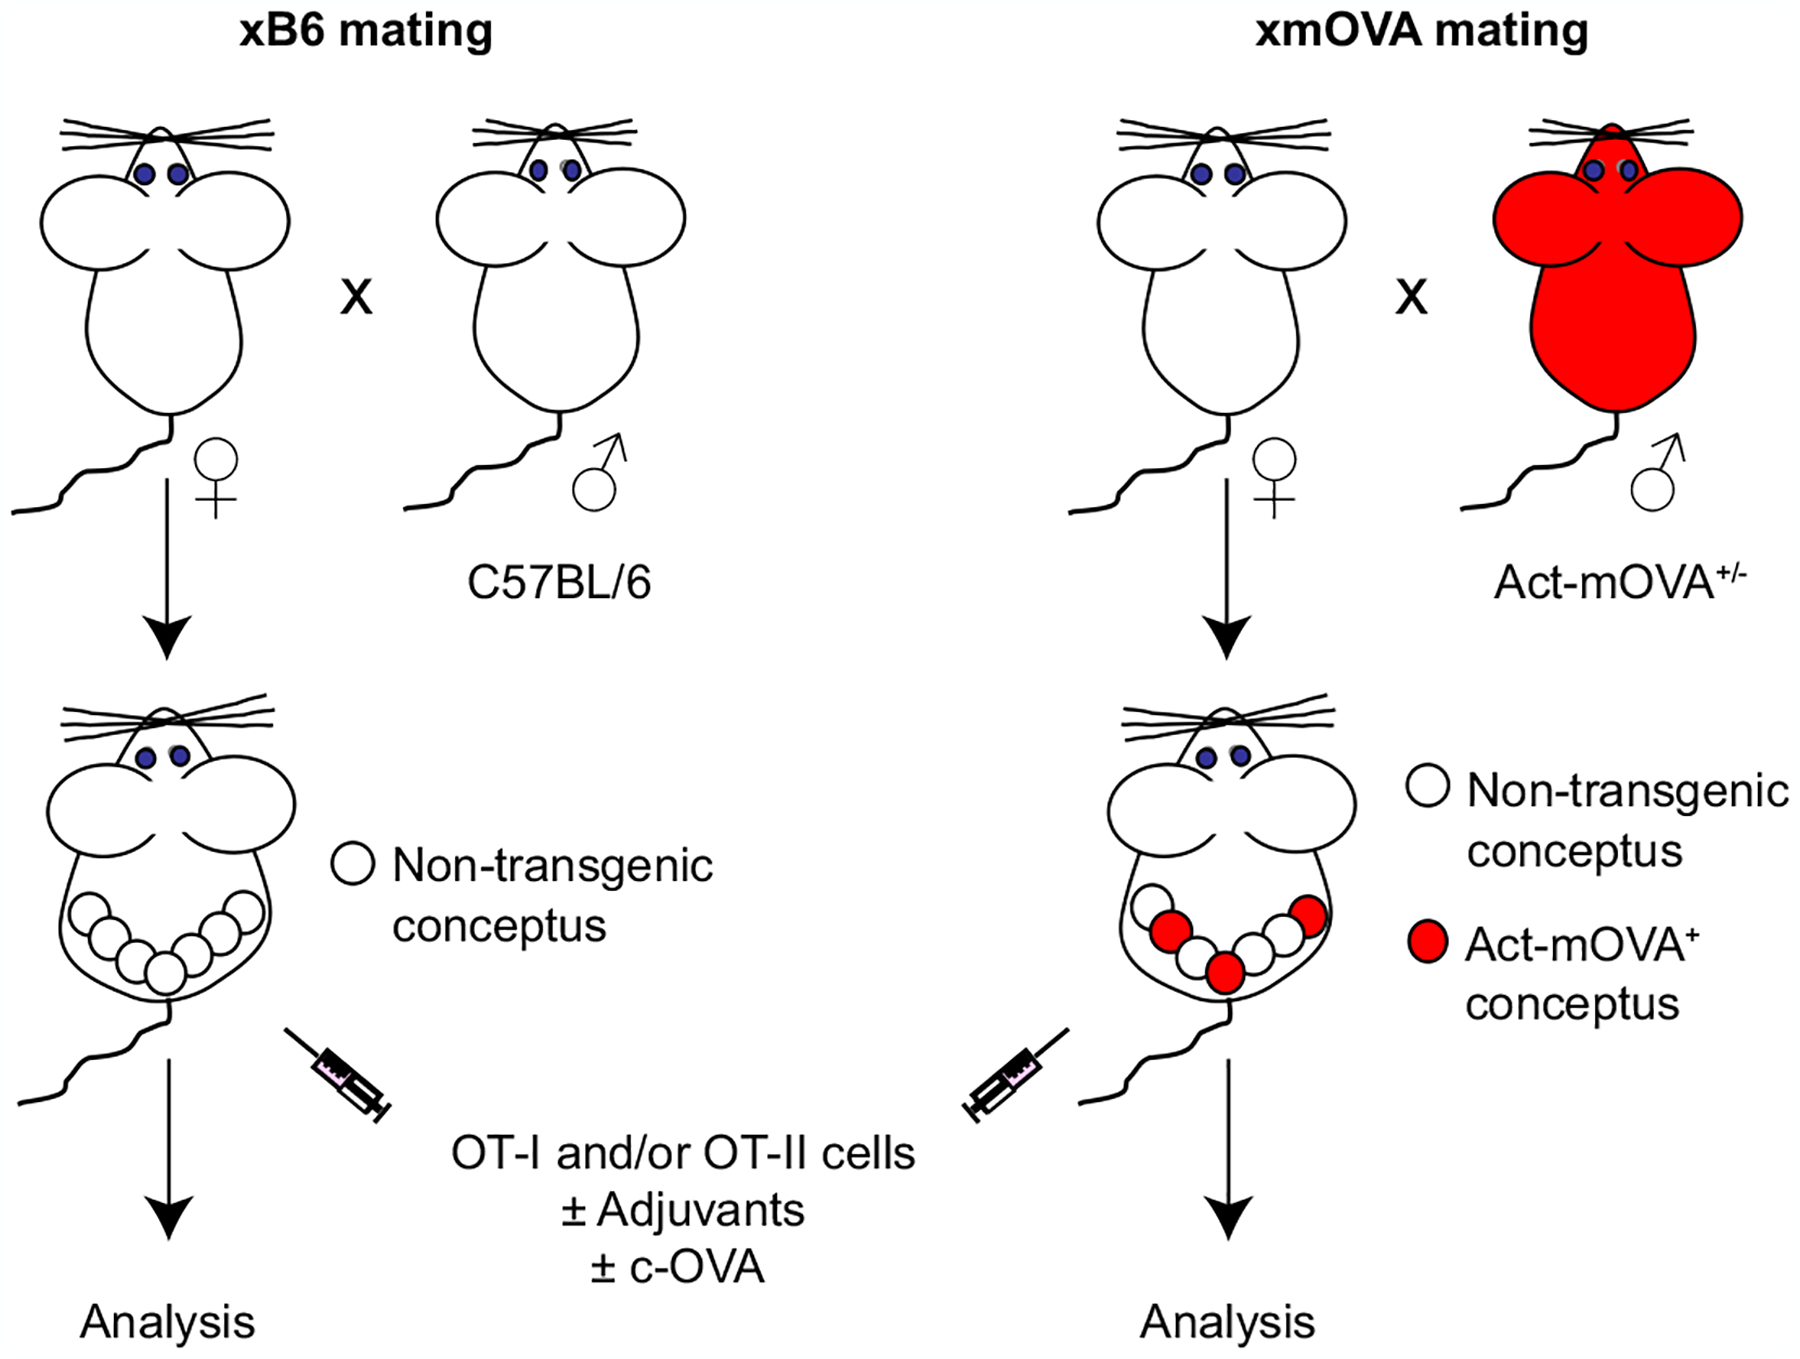
To create an experimental model in which transmembrane OVA (mOVA) is expressed as a surrogate trophoblast antigen, we mated non-transgenic female mice (all C57BL/6-background) to C57BL/6 male mice hemizygous for the Act-mOVA (CAG-OVAL) transgene9 (right). This creates a pregnancy in which, on average, 50% of the concepti will bear the transgene. Due to the promoter/enhancer sequences of the transgene, these transgenic concepti (red) will ubiquitously express mOVA, but there is particularly high expression levels by placental trophoblasts that have invaded into uterine blood vessels and are thus directly exposed to the maternal circulation4. Moreover, the topology of the mOVA constructs directs OVA expression to the external surface of the cell. Thus, the OVA protein itself is bathed in maternal blood. Although the mechanism remains elusive, previous work has established that mOVA is shed into the maternal circulation starting at about E10.5, and genetic experiments have established that its presentation to maternal CD4+ and CD8+ T cells is mediated exclusively by maternal APCs4. As a negative control, females are mated to non-transgenic C57BL/6 males (left). At mid-gestation, the pregnant mice are injected with OVA-specific OT-I and/or OT-II TCR transgenic T cells, with or without adjuvants or c-OVA.
Extended Data Fig. 2 |. xmOVA pregnant mice show a mild, OVA-dependent expansion of OVA-specific Tregs, but Treg depletion does not alter their suppressed CD4+ T cell response to t-mOVA.
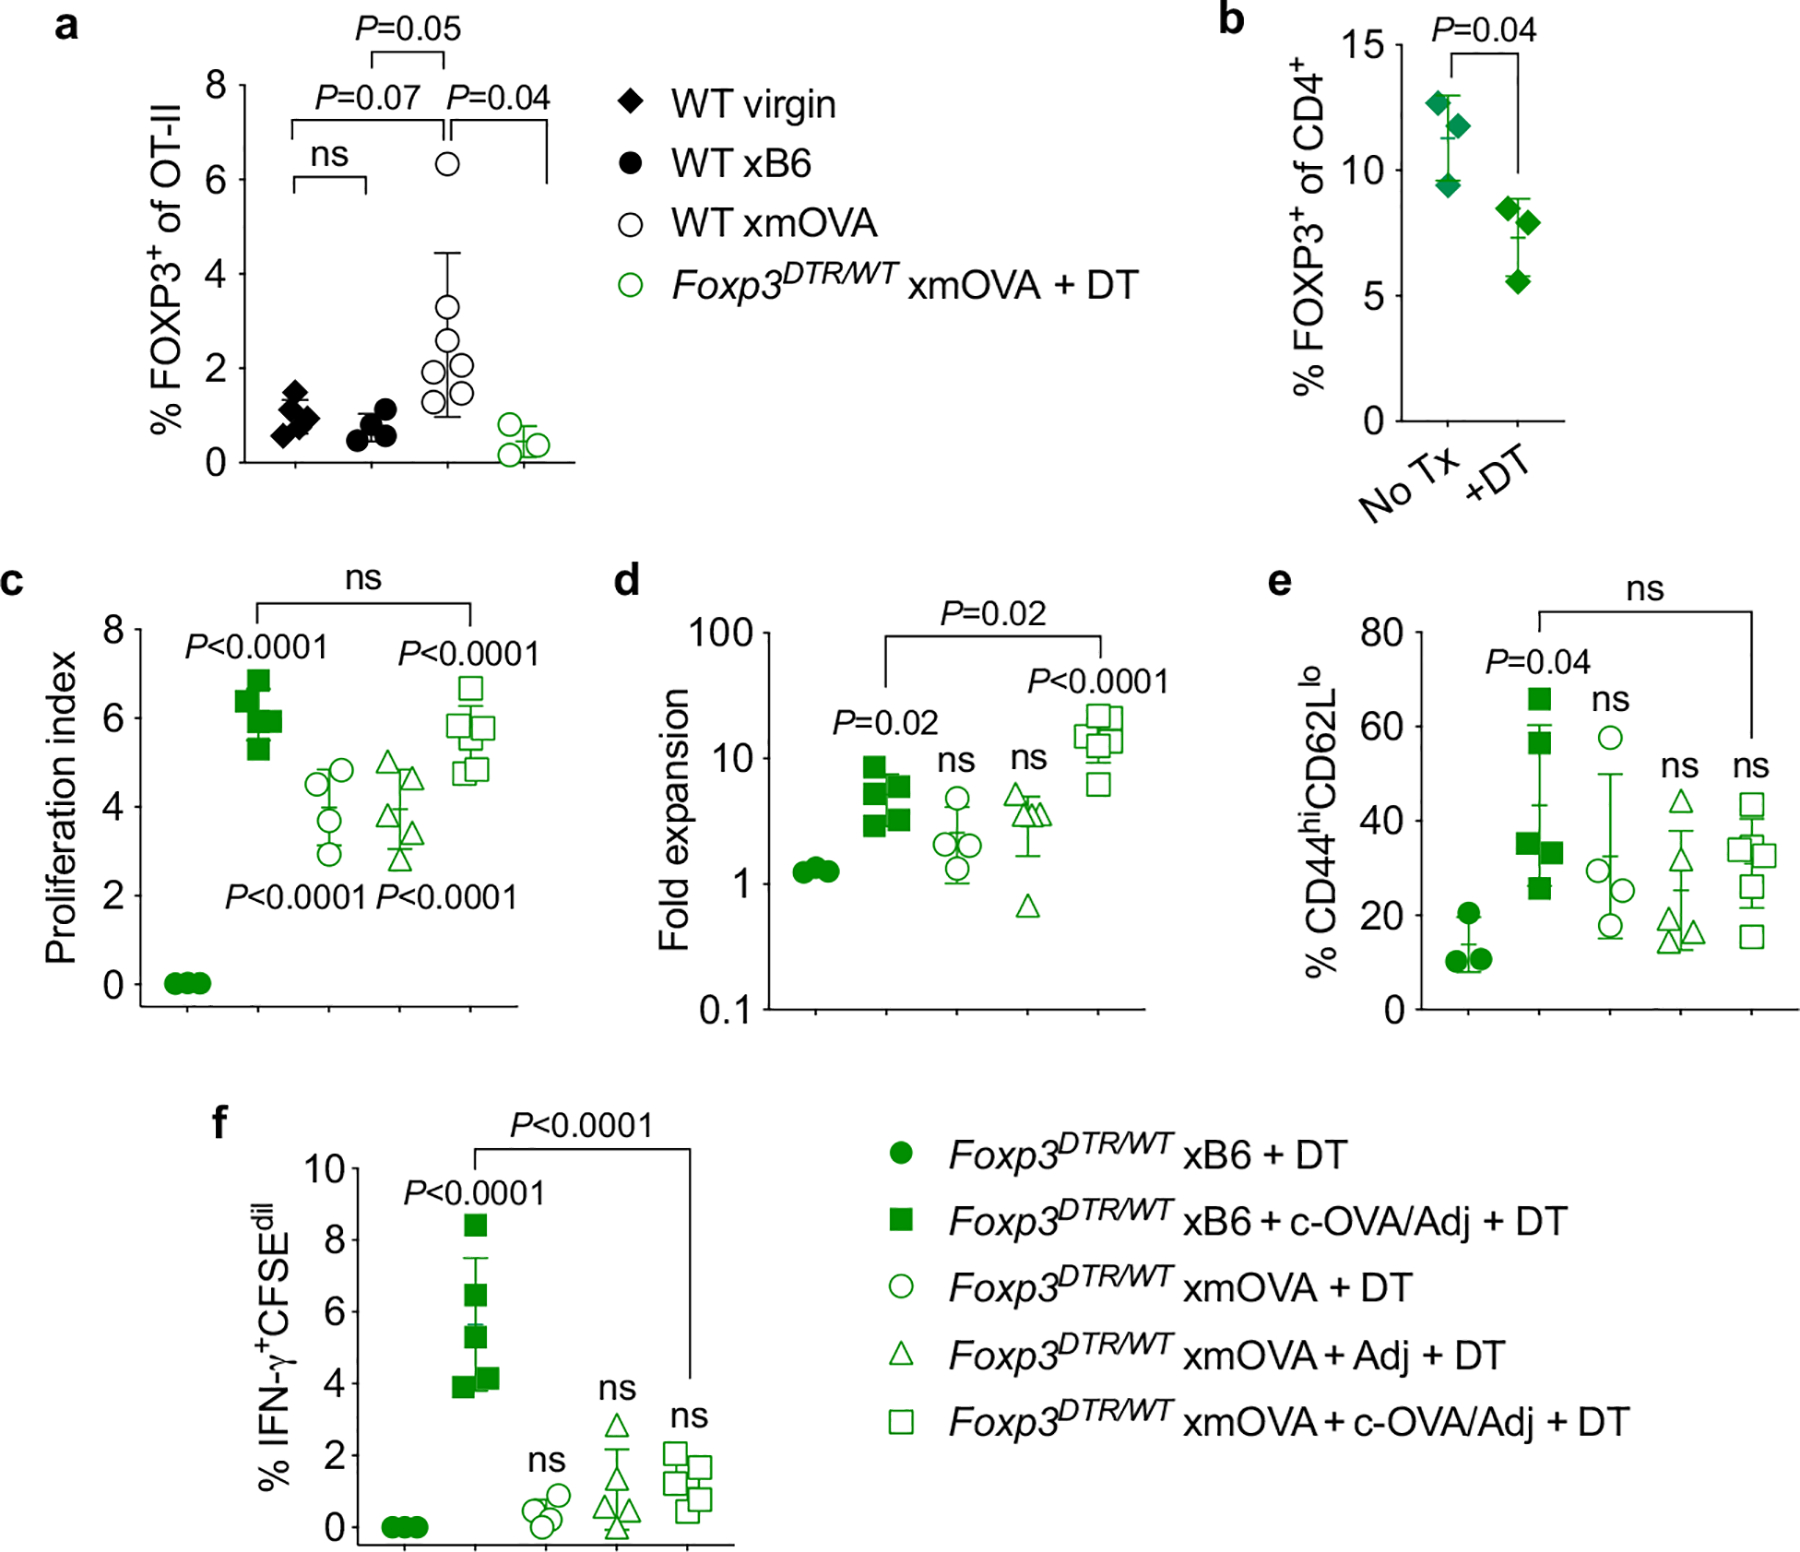
Treg depletion was accomplished through use of the Foxp3DTR system, in which the gene for the diphtheria toxin receptor (DTR) is knocked into the X-linked Foxp3 locus, thus rendering Tregs sensitive to diphtheria toxin- (DT-) induced ablation35. Since complete Treg ablation starting at mid-gestation is known to cause near-total pregnancy failure12, our experiments employed Foxp3DTR/WT female mice in which, due to random X-inactivation, ~50% of CD4+ T cells express a wild-type Foxp3 allele and the other ~50% express the DTR knock-in allele. DT administration thus causes a ~50% acute reduction in Treg frequencies35. While this reduction is transient, it is still sufficient to induce a significant degree of fetal loss in allogeneic mating combinations12. By contrast, partial Treg ablation in the syngeneic mating combinations employed here (C57BL/6 × C57BL/6, aside from the mOVA transgene) did not induce fetal loss. To prevent the transferred OT-II cells themselves from generating an OVA-specific Treg population, we also employed OT-II Foxp3DTR/Y males as cell donors. All FOXP3+ OT-II cells from these mice are ablatable since they all express the Foxp3DTR allele. a, Frequency of FOXP3+ Treg OT-II cells among total splenic OT-II cells 6 days after adoptive transfer into virgin mice or mid-gestational (E12.5–15.5) WT or Foxp3DTR/WT mice mated as indicated. The Foxp3DTR/WT mice received OT-II Foxp3DTR/Y cells, and were injected daily with DT starting at E10.5, in line with previously work12. Note that virtually none of the transferred cells in this latter group converted into Tregs. Adjusted P-values were determined by ordinary one-way ANOVA with Šídák’s multiple comparisons test applied to the four comparisons shown. ns, not significant. Data were accumulated from 5 individual experiments and all mice are shown. b, Confirmation of partial, DT-induced depletion of host FOXP3+ CD4+ cells in Foxp3DTR/WT female mice. The frequency of FOXP3+ cells among total CD4+ lymphocytes in the spleens of virgin Foxp3DTR/WT female mice was measured 24 h after DT administration. P-value was determined by two-tailed, unpaired t-test. Data are from 1 experiment and all mice are shown. c-f, Proliferation index (c), fold expansion (d), activation marker expression (e), and IFN-γ production (f) of CFSE-labeled Foxp3DTR/Y OT-II cells 6 days after adoptive transfer on E12.5–15.5 into Foxp3DTR/WT mice mated as indicated. The mice were injected daily with DT starting on E10.5, thus partially depleting endogenous Tregs and completely ablating all OT-II cells that have converted into Tregs, as described above. Some groups received i.v. adjuvants (poly(I:C)+anti-CD40 antibodies) ± c-OVA at the time of OT-II transfer. Adjusted P-values were determined by ordinary one-way ANOVA with Šídák’s multiple comparisons test. Each group was compared to the xB6 control group, and the xB6+c-OVA/Adj group was compared to the xmOVA+c-OVA/Adj group. Bars show mean±s.d. Data are from 4 independent experiments and all mice are shown.
Extended Data Fig. 3 |. B cells present t-mOVA to maternal CD4+ T cells; t-mOVA presentation to CD8+ T cells is primarily mediated by dendritic cells.
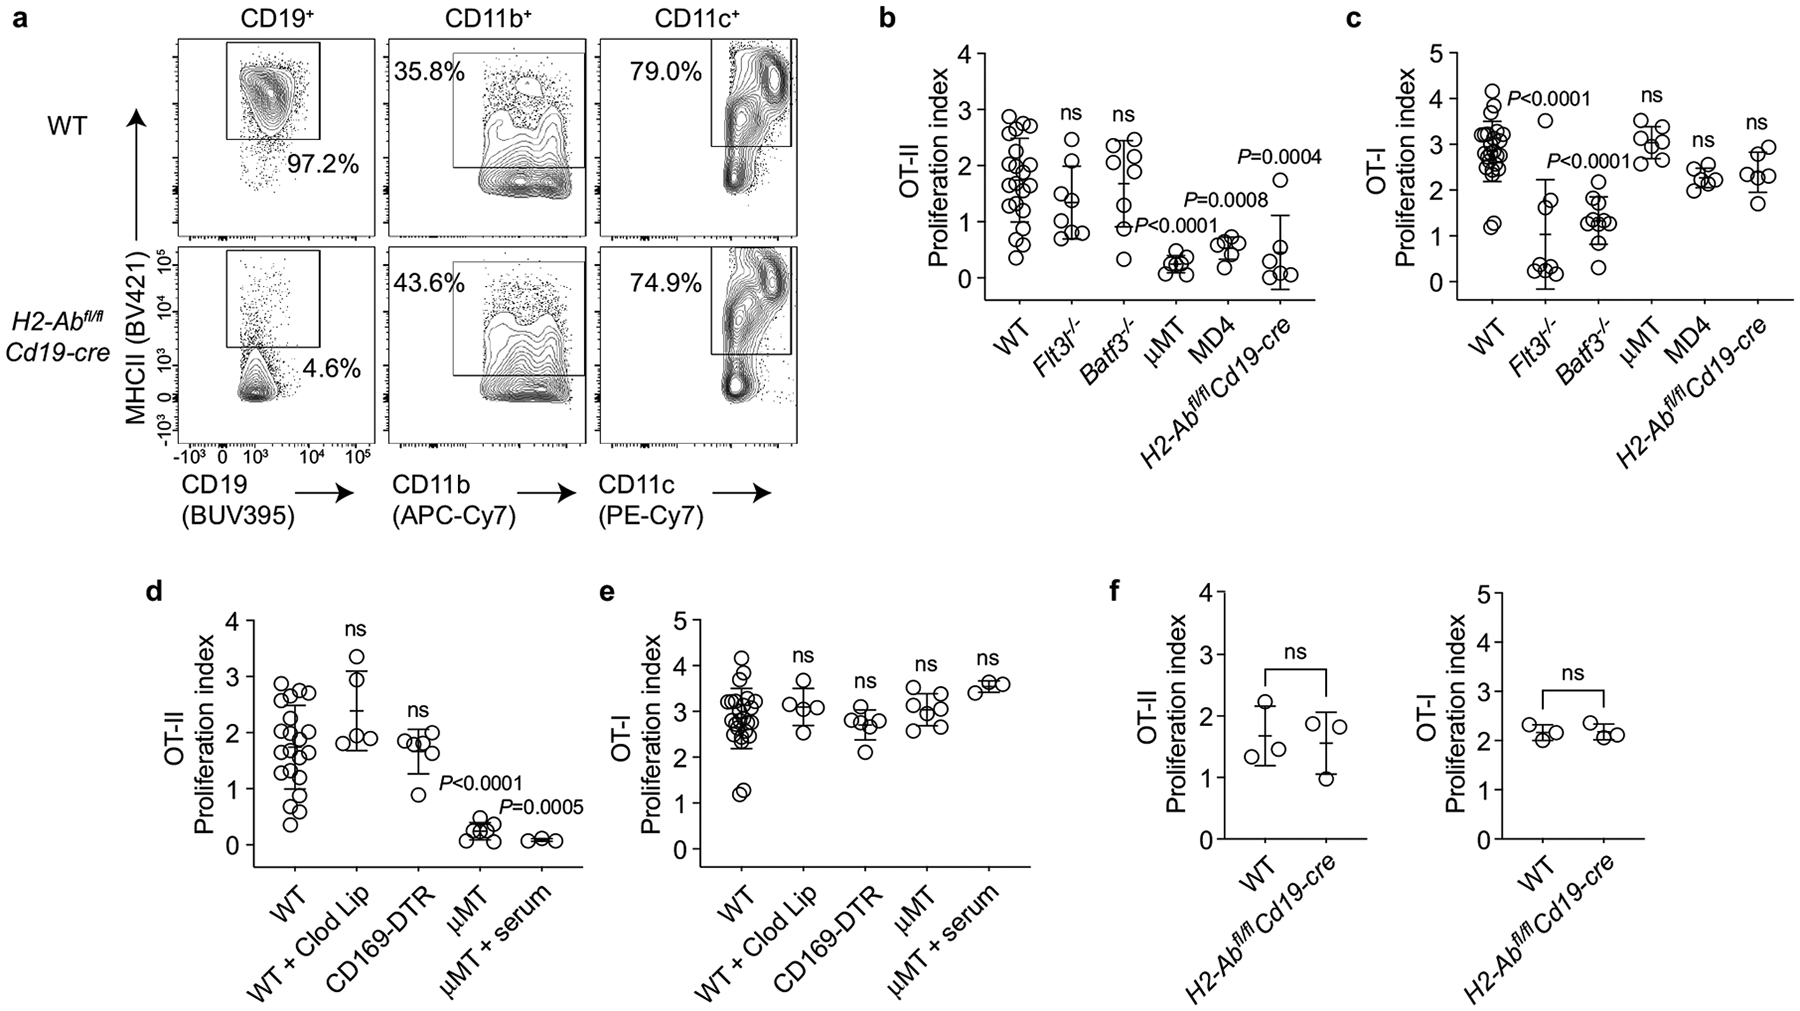
a, Representative flow cytometry (n>4/group) for MHCII expression on splenic CD19+ B cells, CD11b+ cells, and CD11c+ cells in WT or H2-Abfl/flCd19-cre mice, demonstrating that H2-Abfl/flCd19-cre mice show loss of MHCII expression specifically on B cells. b, c, Proliferation index of CFSE-labeled OT-II (b) and OT-I (c) cells, measured 50 h after late-gestational transfer into xmOVA mated pregnant mice of the indicated genotypes. Adjusted P-values were determined by ordinary one-way ANOVA with Šídák’s multiple comparisons test. Each group was compared to the WT group. Bars show mean±s.d. Data were accumulated over 21 individual experiments and all mice are shown. d, e, Maternal CD4+ and CD8+ T cell recognition of t-mOVA does not require macrophages; serum does not restore CD4+ T cell recognition in B cell deficient mice. Proliferation index of CFSE-labeled OT-II (d) and OT-I (e) cells, measured 50 h after late-gestational transfer into xmOVA pregnant mice of the indicated genotypes. CD169-DTR mice received a single depleting dose of DT38 48 h prior to cell transfer. Some WT mice received Clodronate Liposomes 24 h prior to cell transfer (WT + Clod Lip), and some μMT mice received 300 μl serum from late-gestational xmOVA-mated pregnant females administered in two separate doses (150 μl each) at 18 and 6 h prior to cell transfer (μMT + serum). Data for untreated WT and μMT mice are the same as in panels b and c. Adjusted P-values were determined by ordinary one-way ANOVA with Šídák’s multiple comparisons test. Each group was compared to the WT group. Bars show mean±s.d. All mice are shown. WT + Clod Lip mice, CD169-DTR mice, and μMT + serum mice data were accumulated from 2, 5, and 1 independent experiment(s), respectively. f, H2-Abfl/flCd19-cre mice retain the ability to present c-OVA to OT-II cells. Proliferation index of OT-II cells at 50 h after adoptive transfer into xB6-mated WT or H2-Abfl/flCd19-cre mice on E12.5–16.5. The mice were injected i.v. with c-OVA at the time of transfer. P-values were determined by two-tailed, unpaired t-test. Bars show mean±s.d. Data were accumulated from 3 independent experiments and all mice are shown.
Extended Data Fig. 4 |. Identification of endogenous OVA-specific B cells using fluorescently-conjugated OVA-tetramers.
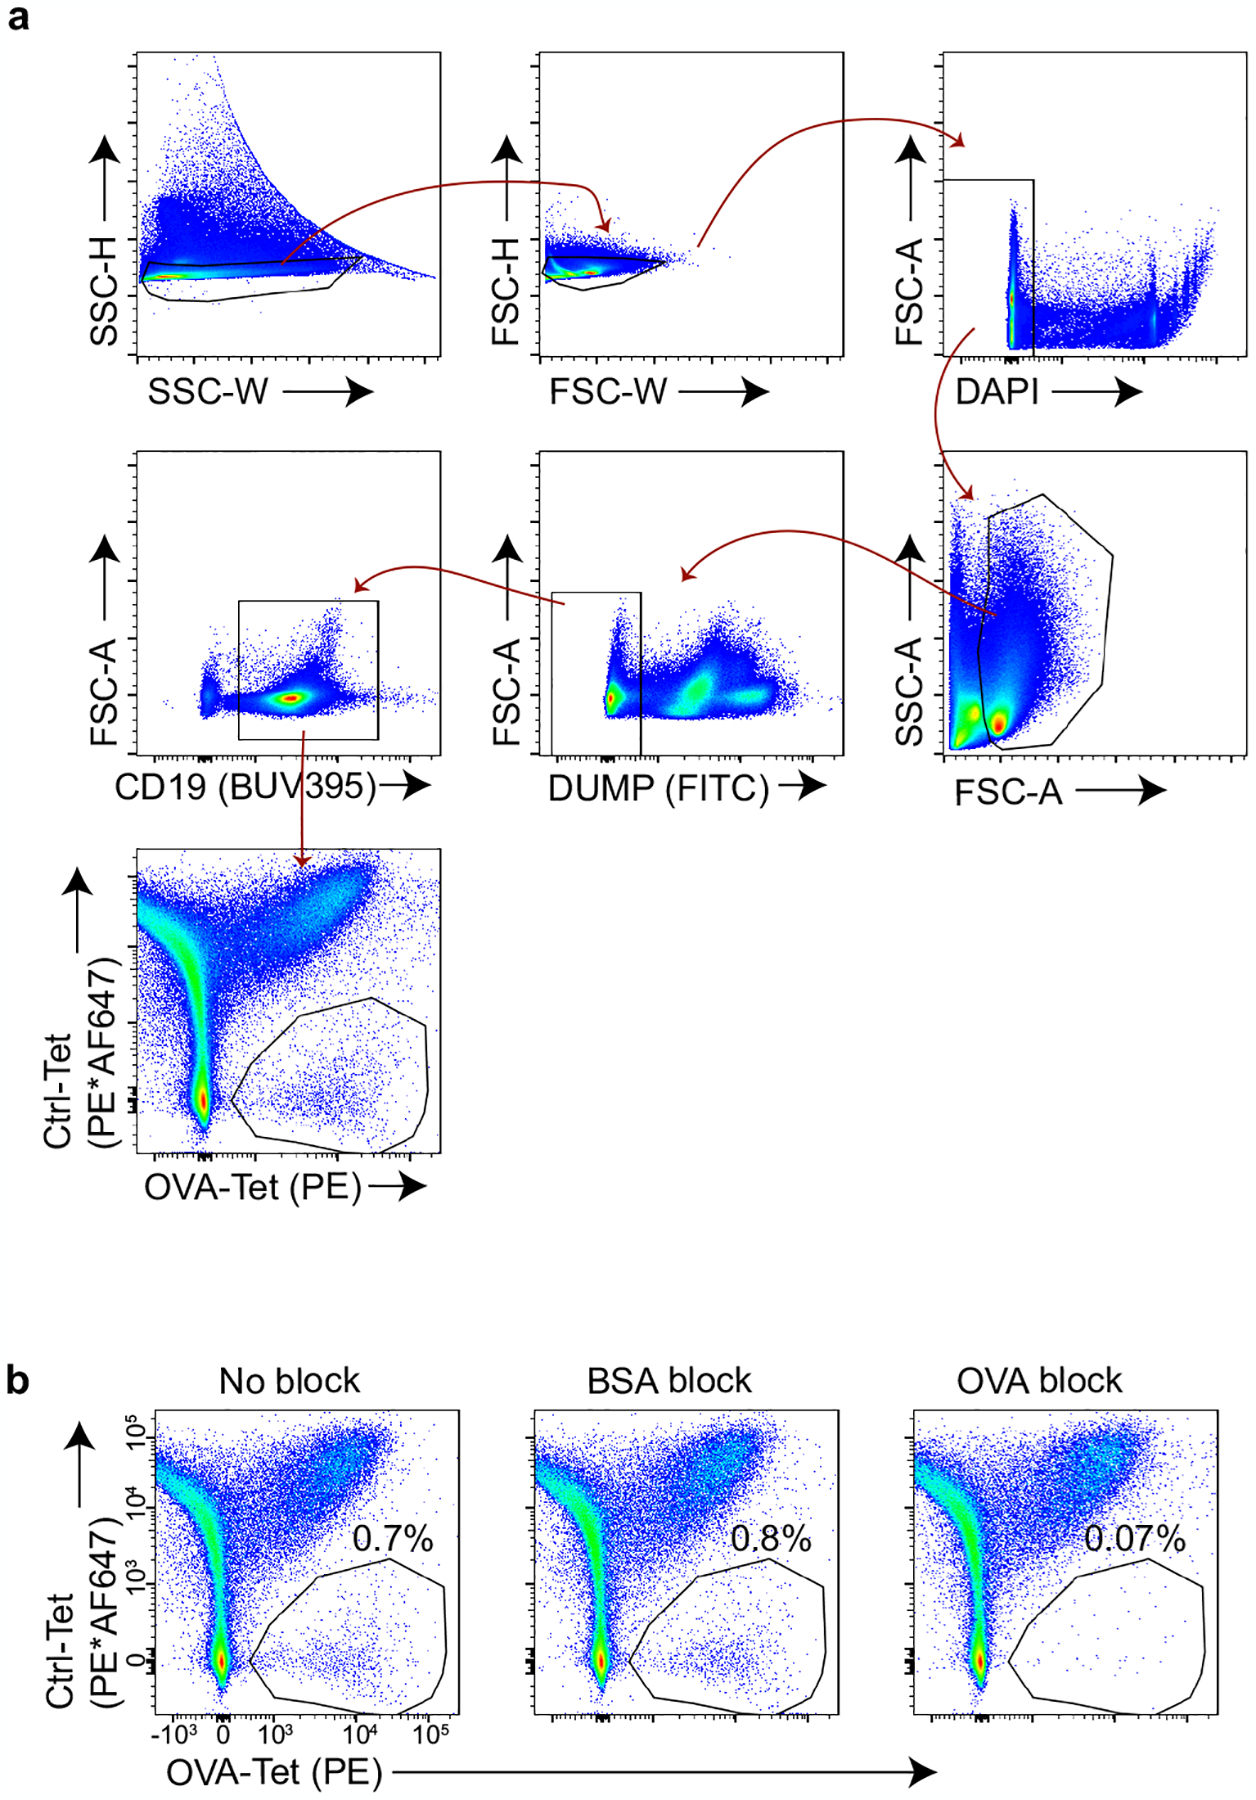
a, Representative flow plots showing the gating scheme used to identify OVA-specific B cells. Spleen cell suspensions from a WT mouse were stained with OVA- and control (Ctrl)-tetramers followed by magnetic bead enrichment of tetramer+ cells (15, see Methods). Briefly, SSC-H/W and FSC-H/W were used to exclude doublets, DAPI allowed for dead cell exclusion, and a dump channel consisting of Gr-1, CD11c, F4/80 and Thy1.2 was used to exclude non-B cells. Gating on the OVA-Tet+Ctrl-Tetneg population identifies cells that bind to OVA and excludes those that recognize the non-OVA components of the tetramer reagent. b, Confirmation that OVA-Tet+Ctrl-Tetneg B cells are OVA-specific. Whole spleen samples from WT mice were incubated in 300 μM of monomeric BSA or OVA beginning 20 min prior to tetramer staining15 (see Methods). Note the loss of the OVA-Tet+Ctrl-Tetneg population in the preparation preincubated with monomeric OVA.
Extended Data Fig. 5 |. Antigen-specific B cell recognition of t-mOVA during pregnancy.
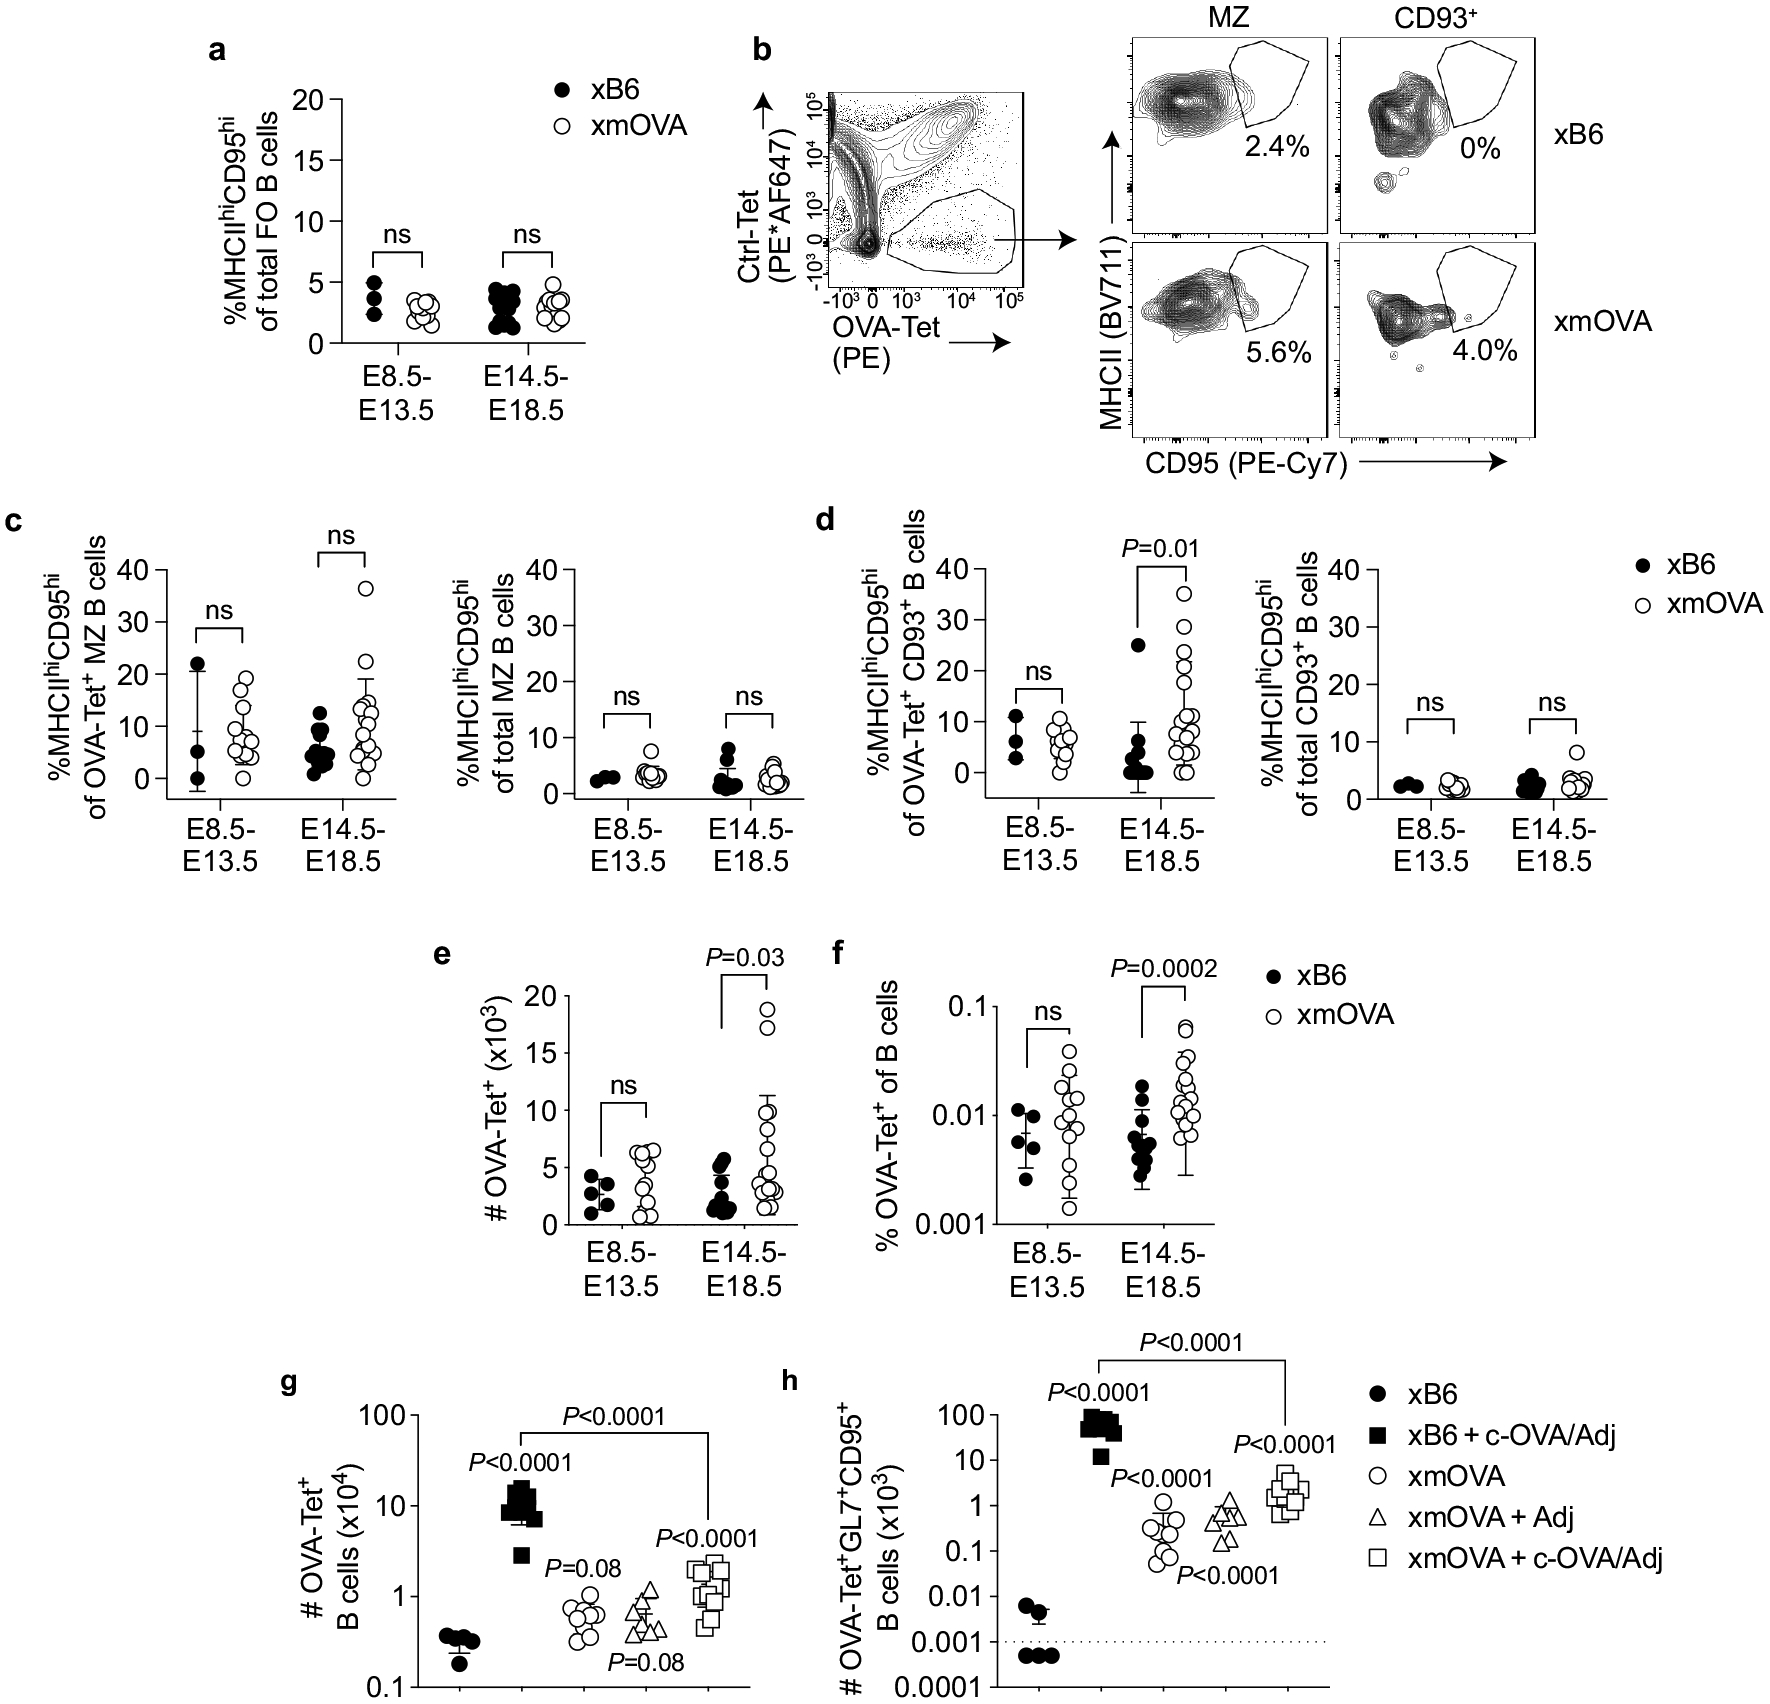
a, Total follicular (FO) splenic B cells from xB6 and xmOVA matings show a similar frequency of CD95hiMHCIIhi cells at mid (E8.5–13.5) and late gestation (E14.5–18.5), demonstrating that the increased frequency of CD95hiMHCIIhi cells among OVA-specific FO B cells in late gestation xmOVA mice (Fig. 2a, b) was antigen-driven. P-values were determined by two-tailed, unpaired t-test. Data were accumulated over 22 independent experiments and all mice are displayed. b–d, Phenotypic analysis of non-follicular splenic B cell subsets during mid- and late-gestation. Marginal zone (MZ) and CD93+ transitional splenic B cells were gated as DUMPnegCD19+IgMhiCD21/35hi and DUMPnegCD19+CD21/35lo/negCD93+ cells, respectively, and then assessed for CD95 and MHCII expression. b, Representative flow plots (E17.5) are from n = 13 xB6 and n = 17 xmOVA late gestation pregnancies. c, d, Quantification of CD95/MHCII expression from xB6 and xmOVA pregnancies. For OVA-specific (OVA-Tet+) cells, there was variable but significant t-mOVA-driven CD95/MHCII upregulation at late gestation (E14.5–18.5) in CD93+ but not MZ B cells (left graphs). This upregulation was much less dramatic than that seen for follicular B cells (Fig. 2b). A similar frequency of CD95hiMHCIIhi cells was seen for the total population of CD93+ and MZ B cells in xB6 and xmOVA pregnancies (right graphs). P-values were determined by two-tailed, unpaired t-test. Bars show mean±s.d. Data were accumulated over 22 independent experiments and all mice are displayed. e, f, OVA-specific (OVA-Tet+) B cells slightly expand in late gestation in xmOVA pregnancies. An increase in the absolute number (e) and frequency (f) of OVA-specific B cells becomes evident in late gestation (E14.5–18.5) only in xmOVA pregnancies. P-values were determined by two-tailed, unpaired t-test. Data were accumulated over 22 independent experiments and all mice are displayed. g, h, Antigen-specific B cell suppression by t-mOVA. Absolute number of total (g) or CD95+GL7+ GC phenotype (h) OVA-specific B cells 6 days after i.v. vaccination with 5×10⁴ OT-II cells ± c-OVA ± poly(I:C) (Adj) on E11.5 or E12.5. Padj Adjusted P-values were determined by ordinary one-way ANOVA with Šídák’s multiple comparisons test. Each group was compared to the xB6 control group, and the xB6+c-OVA/Adj group was compared to the xmOVA+c-OVA/Adj group. Bars show mean±s.d. The dashed line (h) indicates the limit of detection. This analysis employed the same samples used for Fig. 2c, d. Data were accumulated over 26 independent experiments and all mice are displayed.
Extended Data Fig. 6 |. Although reduced in comparison to the response seen in virgin mice, c-OVA elicits similar levels of OT-II cell expansion and OT-II Tfh differentiation in xB6 and xmOVA pregnant mice, and does not induce OT-II Tfr differentiation.
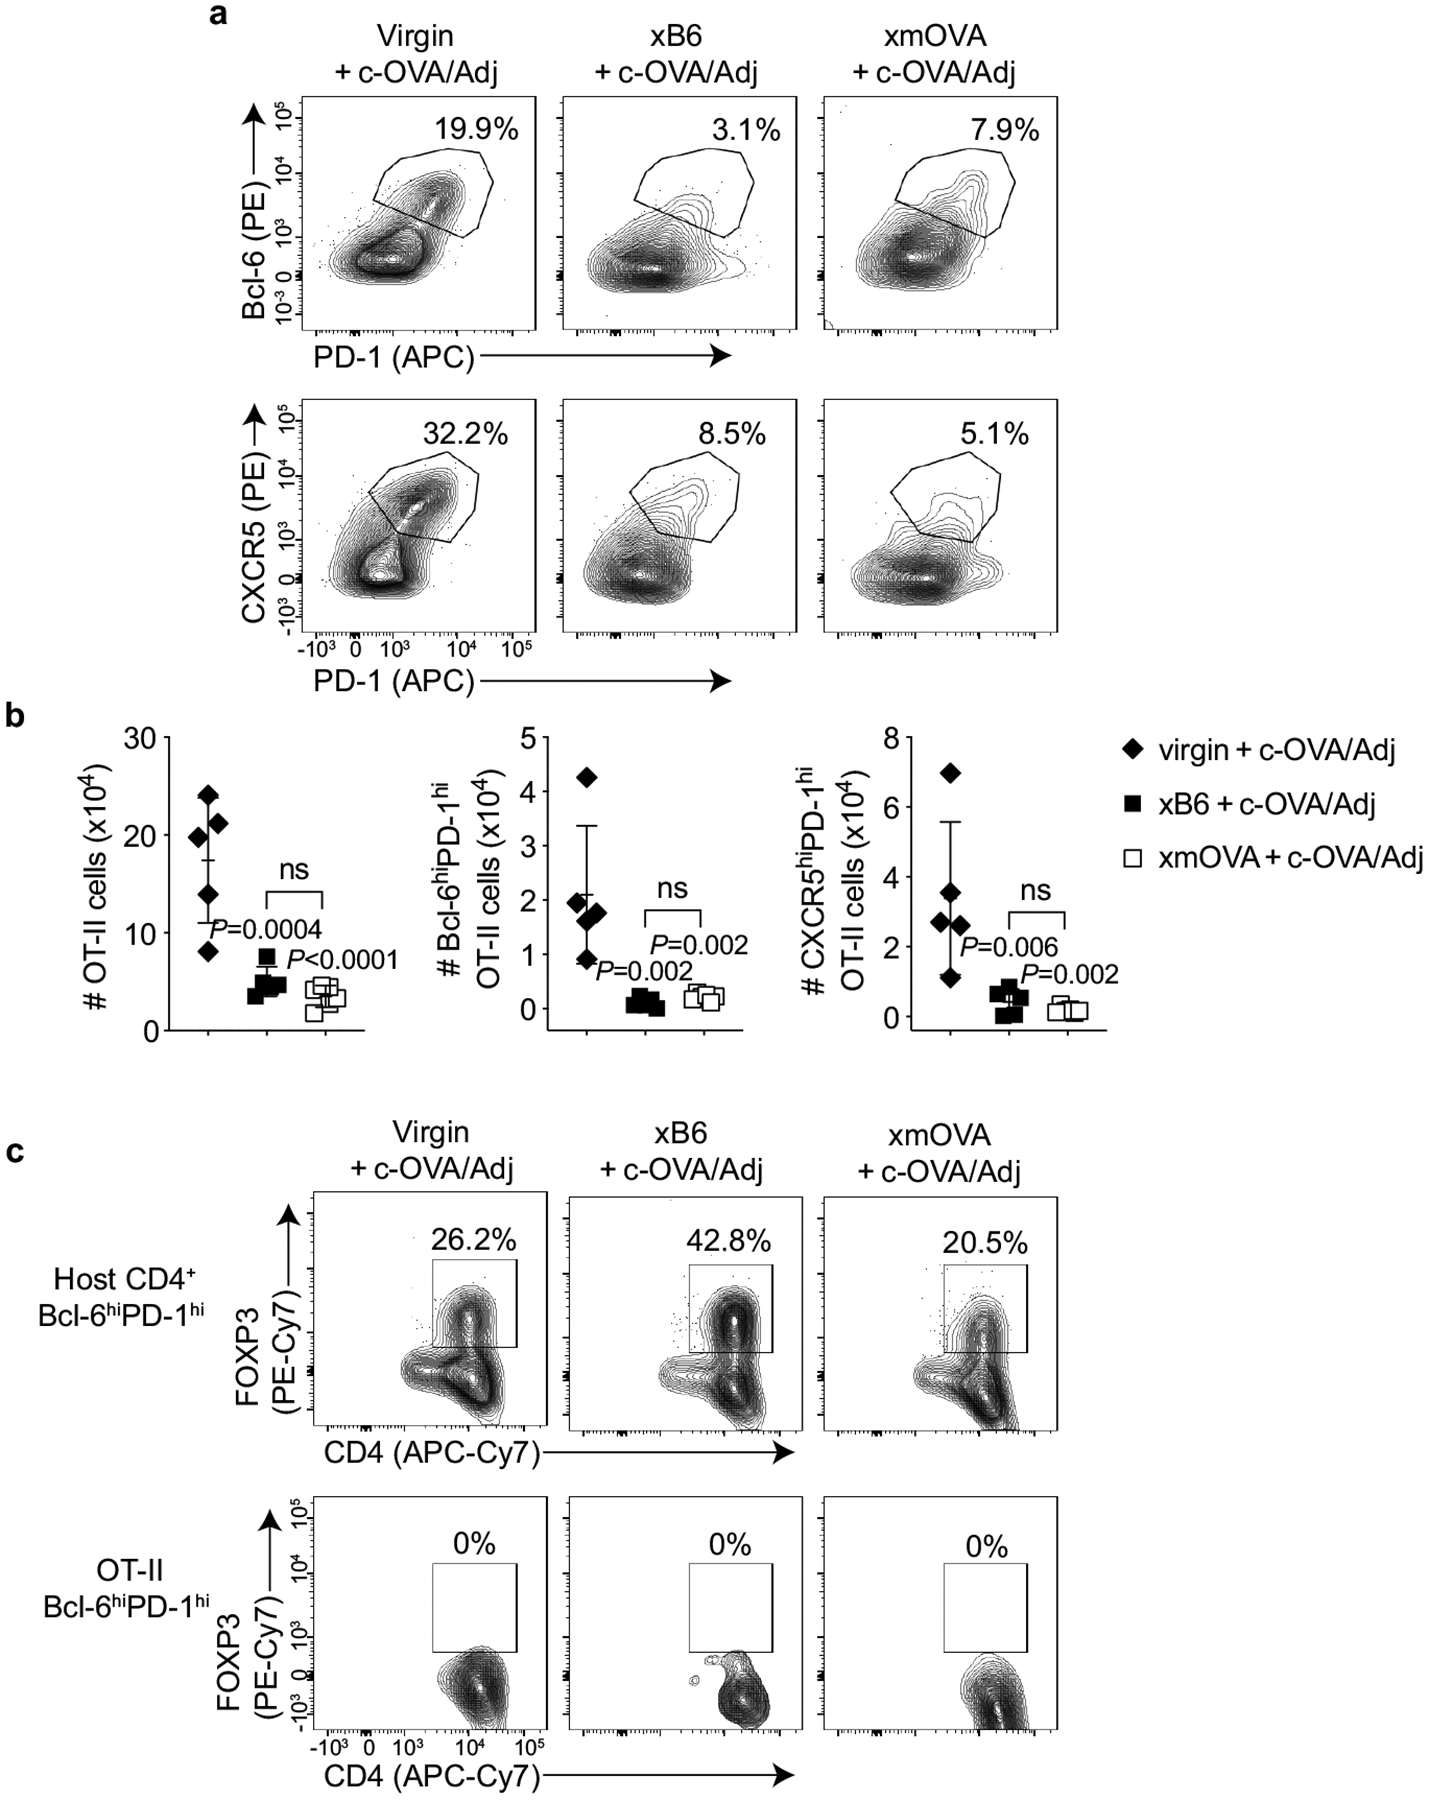
a, Representative flow plots (n = 5/group) showing the frequency of Bcl-6hiPD-1hi and CXCR5hiPD-1hi OT-II cells among total OT-II cells five days after adoptive transfer into virgin mice or on E11.5–12.5 into WT pregnant mice mated as indicated. All groups received the vaccination protocol used in Fig. 2c, d that generated a strong OVA-specific B cell response in control pregnancies (i.v. adjuvant [poly(I:C)] + c-OVA) at the time of OT-II transfer. Analysis on day 5 post-transfer was chosen for this experiment as it was the peak of OT-II expansion. b, Quantification of results from (a) showing that both the absolute number of OT-II cells and those with Tfh phenotype are diminished in pregnant mice compared to virgins. Presumably, this reflects an antigen non-specific effect of pregnancy. Adjusted P-values were determined by ordinary one-way ANOVA with Šídák’s multiple comparisons test. Each group was compared to the virgin+c-OVA/Adj group, and the xB6+c-OVA/Adj group was compared to the xmOVA+c-OVA/Adj group. Bars show mean±s.d. Data were accumulated over 4 independent experiments and all mice are shown. c, Representative flow plots showing the frequency of FOXP3+ cells among Bcl-6hiPD-1hi Tfh phenotype OT-II cells for the three groups shown in (a, b).
Extended Data Fig. 7 |. Additional characteristics of t-mOVA and demonstration of sialic acid at trophoblast membranes in contact with maternal blood.
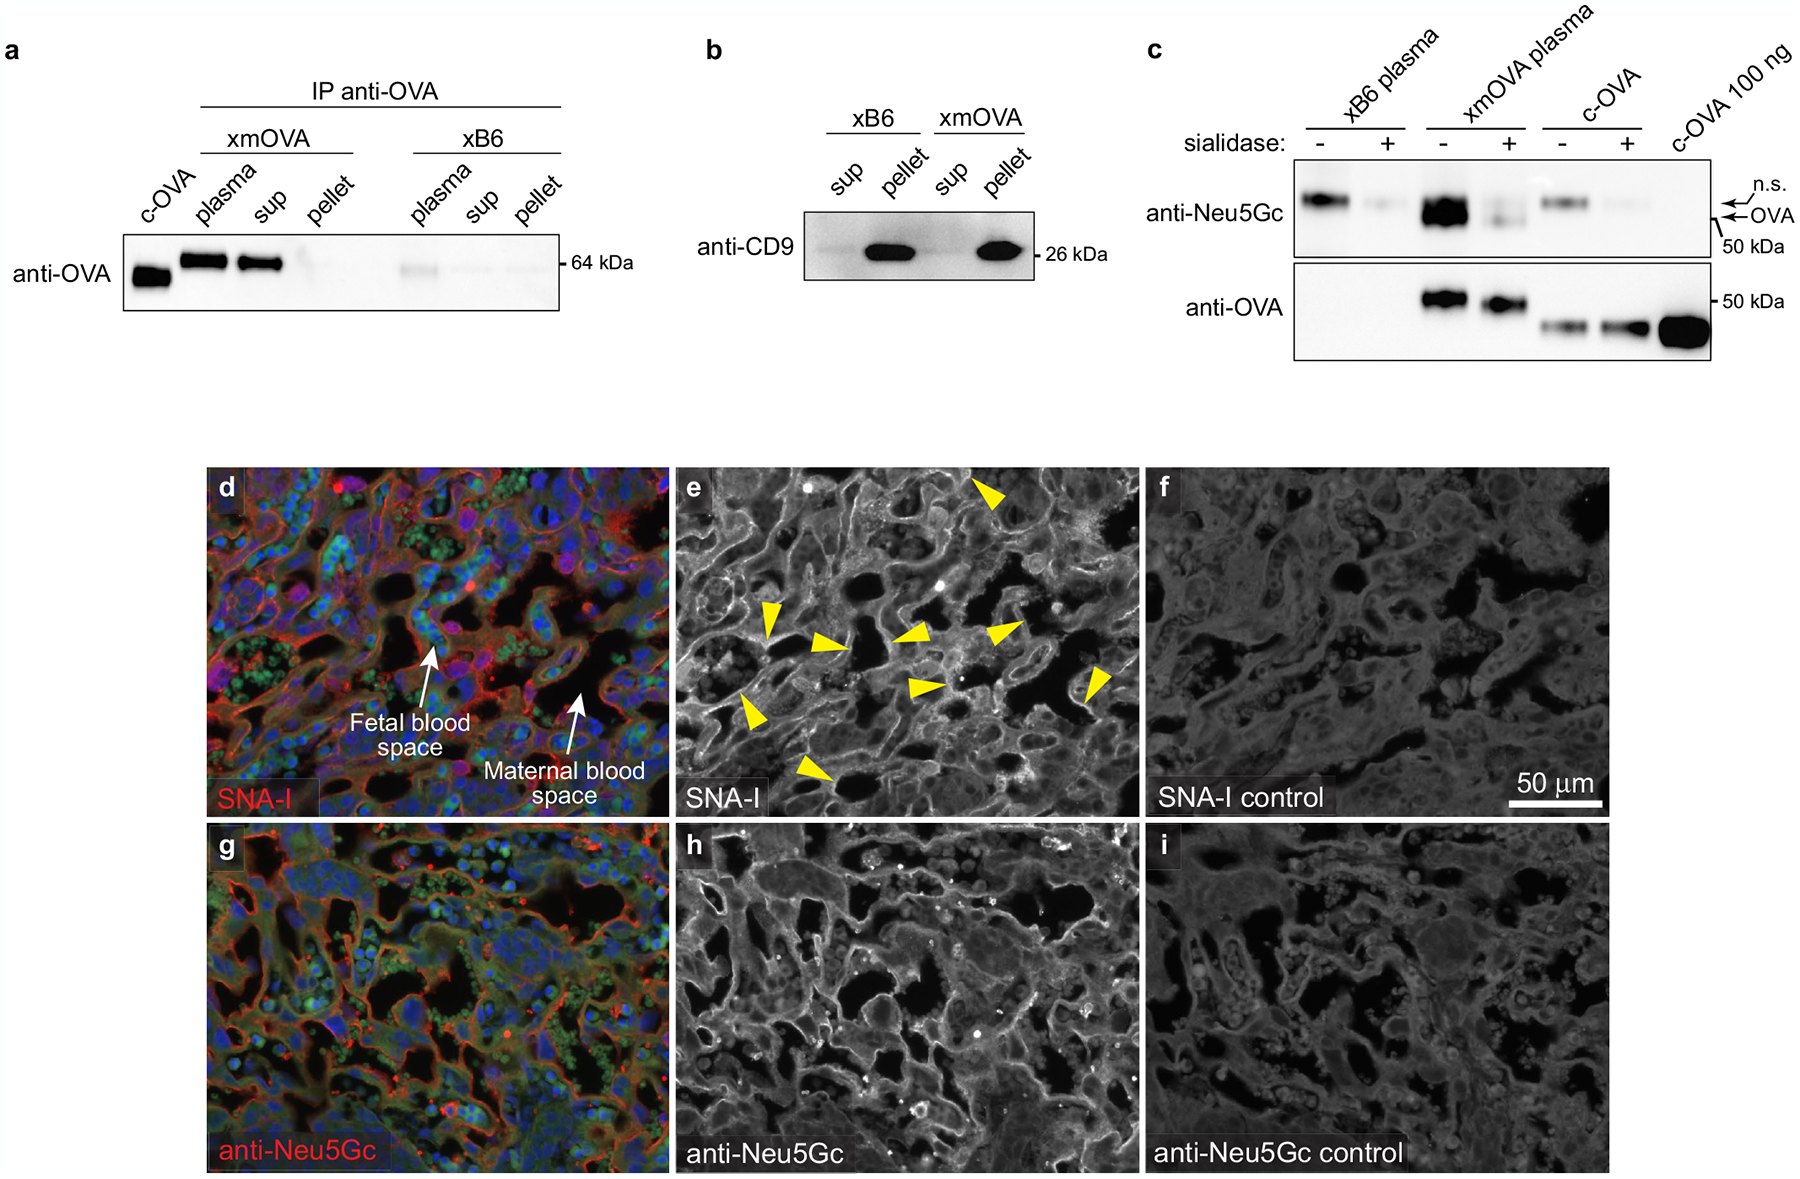
a, b, Shed t-mOVA is present within the non-pelletable, non-exosomal fraction of maternal plasma. Equal volumes of plasma from xB6- and xmOVA-mated mice (E18.5) were subjected to differential centrifugation (see Methods) followed by either anti-OVA immunoprecipitation and anti-OVA immunoblotting (a) or immunoblotting for the exosome-specific marker CD9 (b). We analyzed three different fractions: “clarified plasma” (i.e., the plasma after an initial low-speed (10,000×g) centrifugation), and the “sup” and “pellet” fractions from 110,000×g ultracentrifugation. Anti-OVA immunoblotting identified mOVA in both the clarified plasma and 110,000xg “sup” fractions, but not in the 110,000×g “pellet” fraction where exosomes reside, as demonstrated by the anti-CD9 immunoblotting. Data are representative of 3 (a) and 2 (b) separate experiments. c, Shed t-mOVA contains N-glycolylneuraminic acid (Neu5Gc), the sialic acid variant required for strong α(2,6)-Sia binding to mouse CD2252. Equal volumes of plasma respectively pooled from 3 xB6-mated and xmOVA-mated mice (E16.5–18.5) were subjected to differential centrifugation, anti-OVA immunoprecipitation on the 110,000×g supernatant, sialidase or mock digestion as indicated, and then anti-Neu5Gc immunoblotting. c-OVA was similarly immunoprecipitated and sialidase/mock-treated, or loaded directly onto the gel. As expected, Neu5Gc is absent from c-OVA. The non-specific (n.s.) band is likely free IgG heavy chain. Data are representative of 2 separate experiments. For gel source data, see Supplementary Fig. 1. d–i, Distribution of α(2,6)-Sia and Neu5Gc in the mouse placental labyrinth. Placental sections prepared from mice on E12.5 were stained with SNA-I (d–f) or anti-Neu5Gc antibodies (g–i). For the SNA-I control (f), the adjacent section was pretreated with neuraminidase A; for the anti-Neu5Gc control (i), free Neu5Gc was added in with the primary antibody. Fetal and maternal blood spaces were respectively identified by the presence of DAPI+ (blue counterstain) nucleated or DAPIneg enucleated RBCs, both of which are autofluorescent on the green channel. Note the SNA-I staining on trophoblast membranes in direct contact with maternal blood (arrowheads). This staining was not as continuous as the staining for Neu5Gc, which was present in all trophoblast membranes in contact with maternal blood. The small round structures showing strong Neu5Gc staining are morphologically consistent with platelets. Images are representative of 3 independent experiments.
Extended Data Fig. 8 |. CD22 and LYN mediate B cell suppression to t-mOVA.
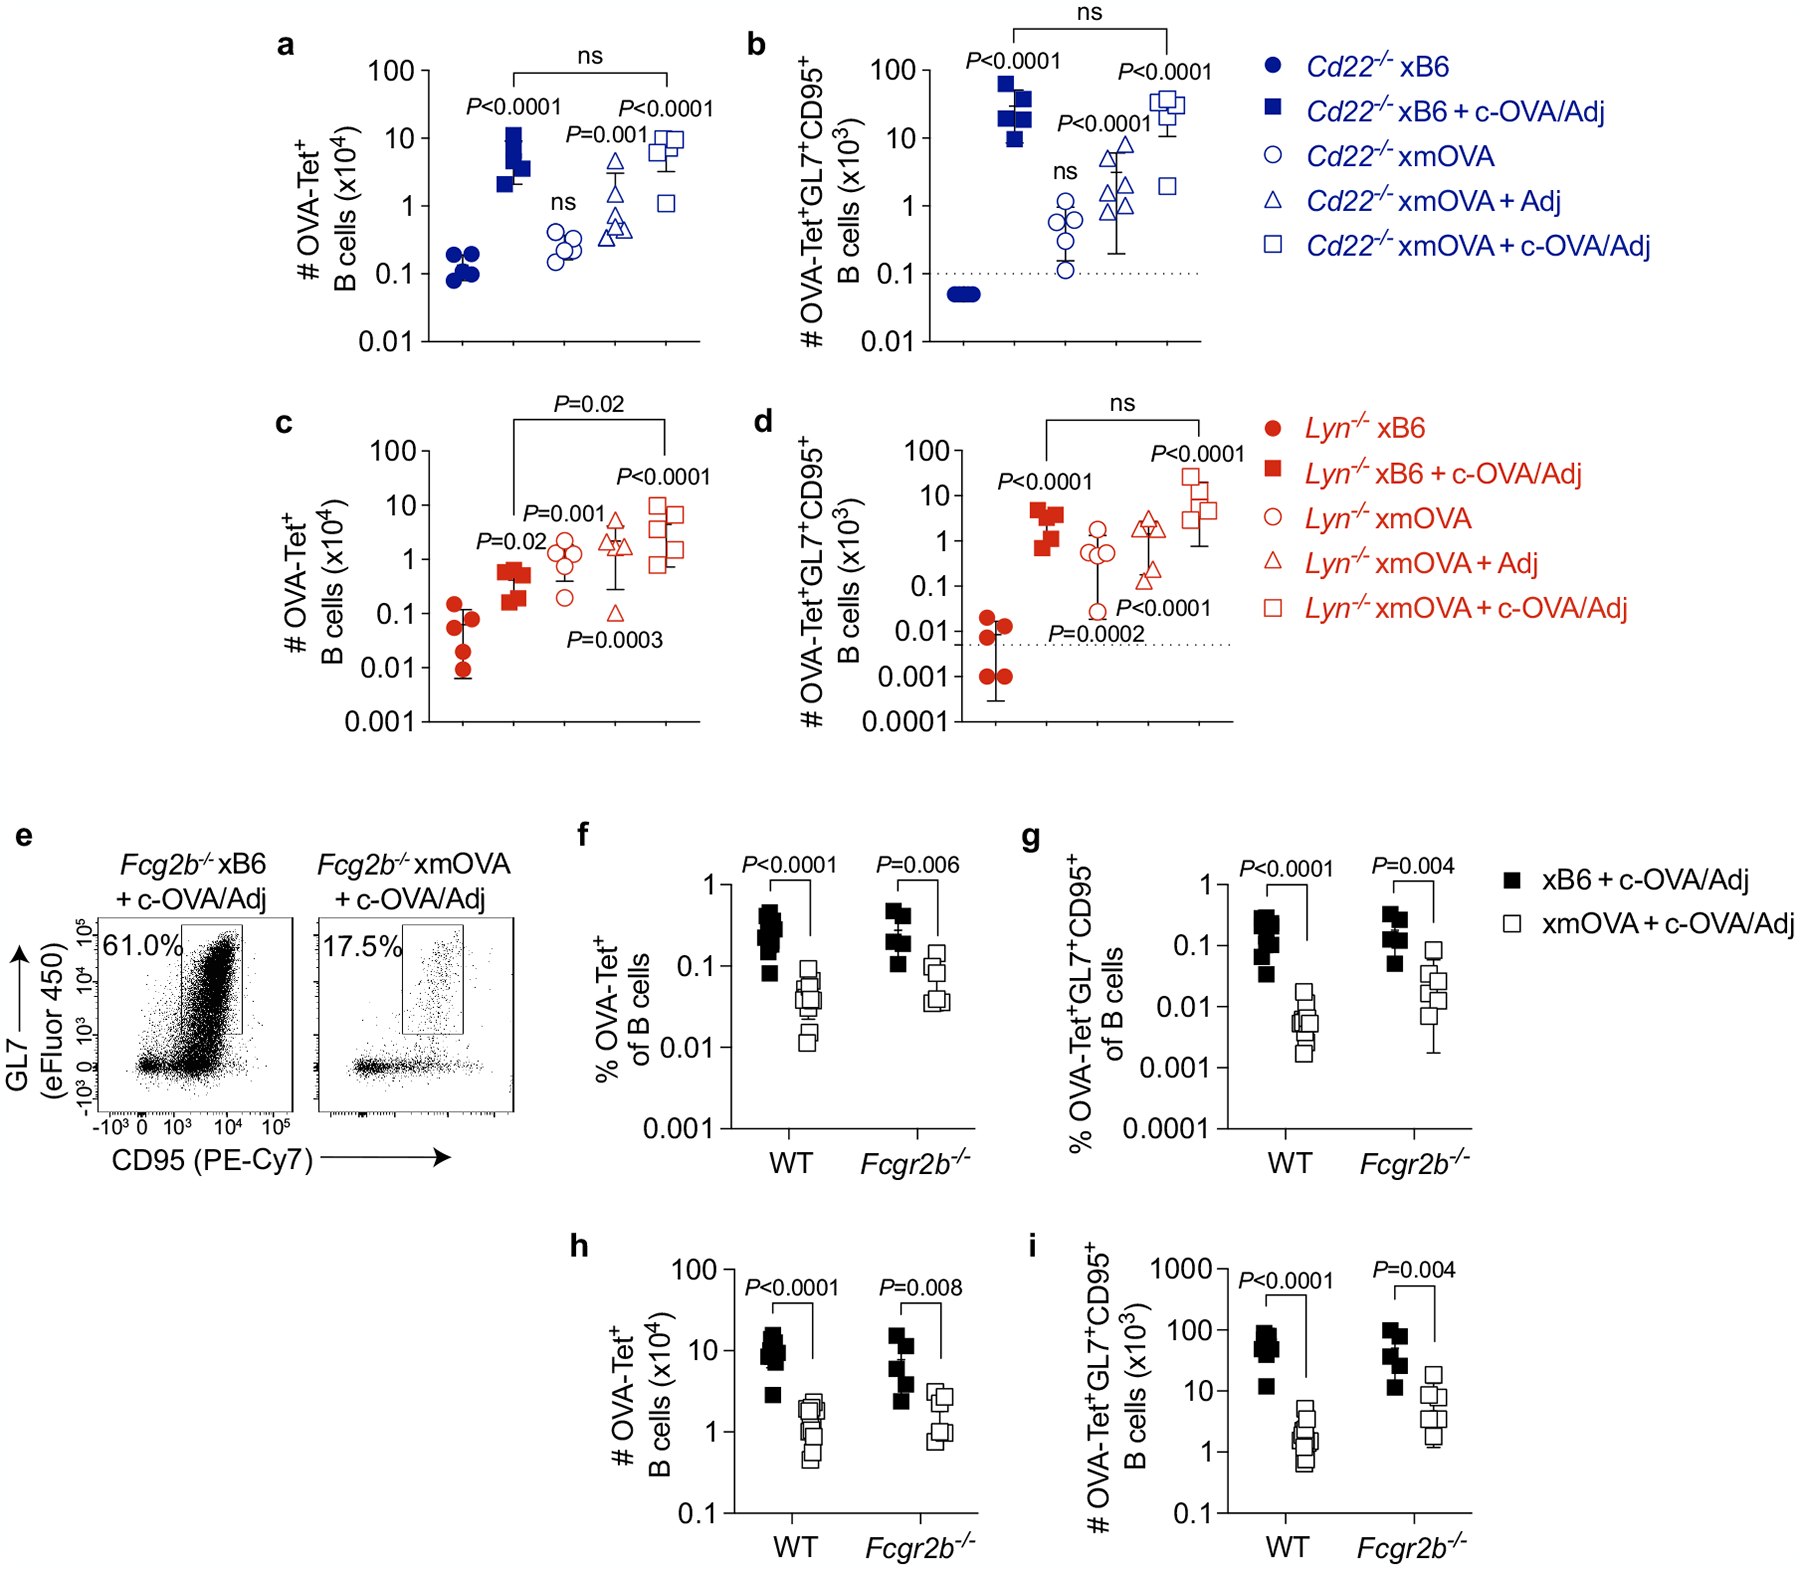
a–d, Absolute number of total (a, c) and GL7+CD95+ GC phenotype (b, d) OVA-specific B cells in pregnant Cd22−/− and Lyn−/− mice 6 days after i.v. vaccination with 5×10⁴ OT-II cells ± c-OVA ± poly(I:C) (Adj) on E11.5 or E12.5. Adjusted P-values were determined by ordinary one-way ANOVA with Šídák’s multiple comparisons test. Each group was compared to the xB6 control group, and the xB6+c-OVA/Adj group was compared to the xmOVA+c-OVA/Adj group. Bars show mean±s.d. This analysis employed the same samples used for Fig. 3c, d. The Lyn−/− and Cd22−/− data were accumulated over 14 and 11 independent experiments, respectively, and all mice are displayed. See Extended Data Fig. 5g, h for corresponding WT data. Note that in Lyn−/− but not WT nor Cd22−/− mice, the number of GC phenotype OVA-specific B cells in xmOVA pregnancies approaches that seen in xB6 pregnancies following c-OVA/Adj immunization. The dashed line (b, d) indicates the limit of detection. e-i, Antigen-specific B cell suppression to t-mOVA in pregnant Fcgr2b−/− mice. Representative flow plots (e), frequencies of total (f) or GL7+CD95+ GC phenotype (g) OVA-specific B cells, and absolute number of total (h) or GL7+CD95+ GC phenotype (i) OVA-specific B cells in pregnant WT or Fcgr2b−/− mice 6 days after i.v. vaccination with 5×10⁴ OT-II cells ± c-OVA ± poly(I:C) (Adj) on E11.5 or E12.5. WT data are from Fig. 2c, d and Extended Data Fig. 5g, h and were accumulated over 26 independent experiments. Fcgr2b−/− data were accumulated over 4 independent experiments. All mice are shown. The flow plots show OVA-tetramer+ B cells gated from a fixed number of total B cells across all groups. P-values were determined by two-tailed, unpaired t-test. Bars show mean±s.d.
Extended Data Fig. 9 |. Analysis of sialylated glycopeptides in pregnant mouse and human plasma.
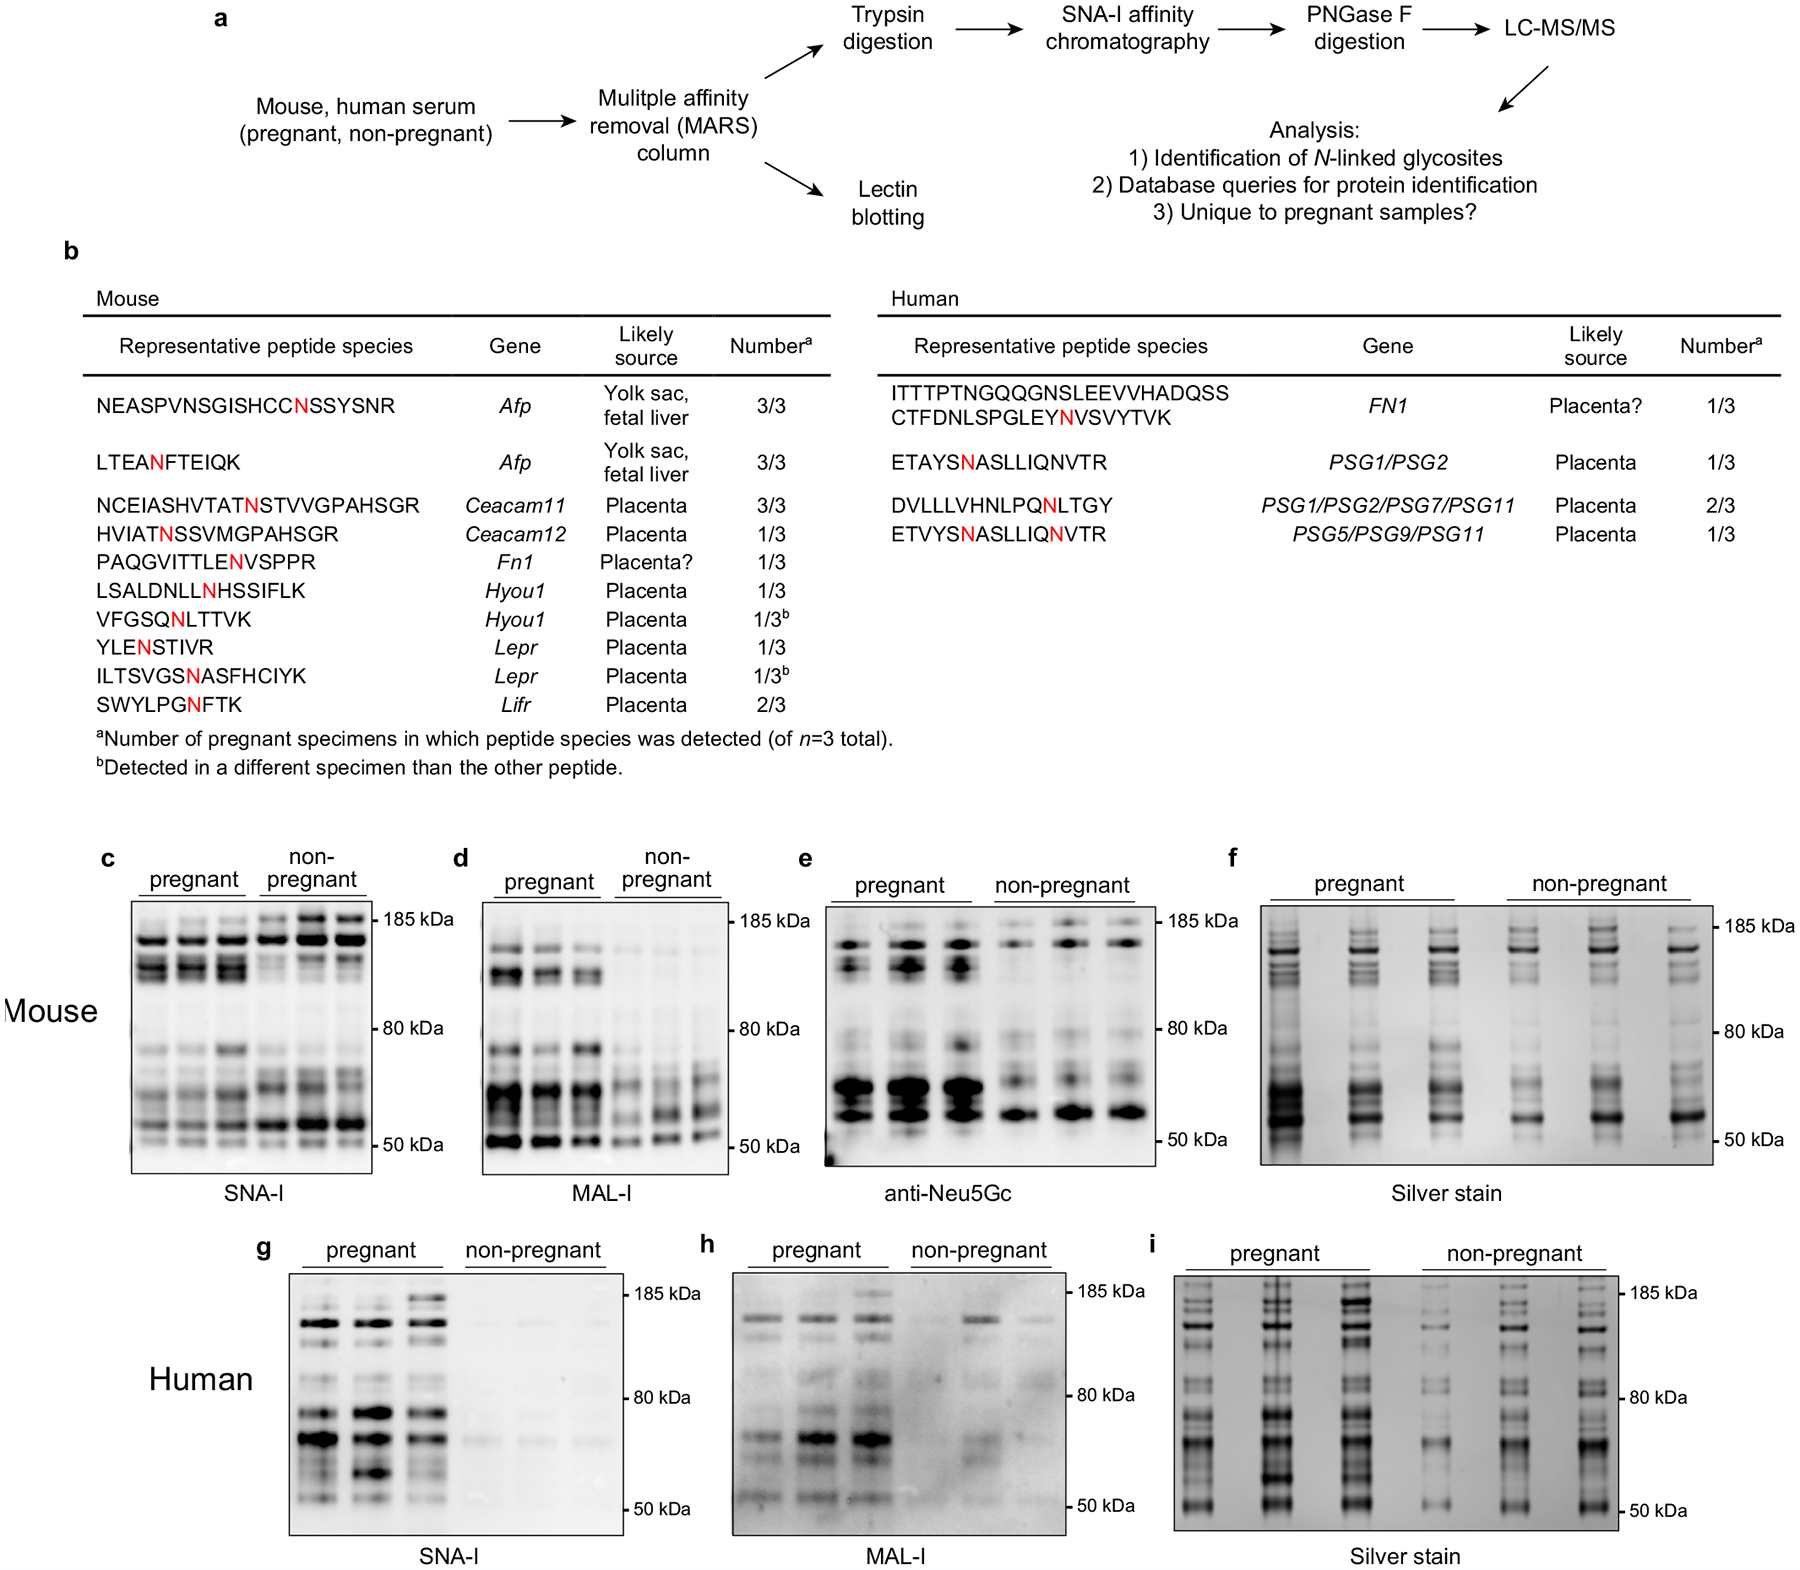
a, Workflow. Plasma (n = 3/group) from non-pregnant or pregnant mice (E15.5–17.5) and humans (collected at delivery) was first run over species-specific Multiple Affinity Removal System (MARS) columns to remove high abundance proteins, whose presence would obscure the detection of other glycopeptides. In one analysis (top), the MARS-depleted plasma was analyzed by mass spectrometry to identify endogenous proteins of potential placental origin bearing N-linked glycans with terminal α(2,6)-Sia. Specifically, the depleted plasma was first subjected to trypsin digestion followed by SNA-I lectin chromatography to isolate α(2,6)-Sia containing glycopeptides. These peptides were then deglycosylated using PNGase F and then subjected to LC-MS/MS. Detected peptides representing true N-glycosites were identified as those bearing the consensus N-X-S/T/C motif with an asparagine → aspartic acid substitution, which occurs as a result of the PNGase F digestion. In addition (bottom), the depleted plasma was subjected to SNA-I and MAL-I lectin blotting, to reveal the overall pattern and prevalence of α(2,6)- and α(2,3)-linked sialylated glycoproteins, respectively. b, Identification of proteins unique to pregnant plasma that contain N-linked glycans with α(2,6)-Sia. Peptides with N-glycosites present in at least one pregnant specimen but absent from all three non-pregnant specimens were tallied. For mice, there were 30 such peptides, corresponding to 26 proteins, and for humans, there were 68 such peptides, corresponding to 53 proteins. For the mouse proteins, database queries (biogps.org)53 identified 7 (27% of total) of the encoding genes to be likely expressed primarily if not exclusively by the conceptus. These genes and corresponding representative peptide species are shown in the table (with the N-glycosites colored red), and include Lepr (encoding the Leptin receptor), a recently identified marker of sinusoidal trophoblast giant cells54, Lifr (LIF receptor alpha subunit), which is expressed by a number of trophoblast subtypes54, Ceacam11 and Ceacam12, which are expressed by spongiotrophoblasts54, and Afp (α-fetoprotein), which is expressed by the yolk sac and fetal liver55,56. The pregnant mice were from xmOVA matings but OVA sequences were not identified, suggesting that this mass spectrometry experiment identified only a subset of the shed proteins, perhaps only those with high abundance or with favorable ionization properties. For the human proteins, we found that 7 of the encoding genes were likely expressed primarily if not exclusively by the placenta. These included PSG1/2/7/5/9/11, i.e., members of the PSG gene family encoding Pregnancy Specific Glycoproteins, which are known to be the most abundant protein species released from the trophoblasts into maternal blood57. Peptide assignments were redundant due to shared sequences. PSG1 has recently been shown to carry primarily α(2,3)-Sia with a small amount of α(2,6)-Sia58. Both mouse and human pregnant plasma contained unique peptides derived from fibronectin (Fn1 and FN1). While fibronectin is abundant in non-pregnant plasma, fibronectin isolated from the human placenta is more heavily glycosylated, carrying polylactosamine chains59. Of note, many of the sialoglycopeptides unique to pregnancy but not obviously derived from the conceptus appeared instead to be produced by the liver (not shown), suggesting that the endocrine state of pregnancy might systemically alter protein sialylation. Complete data is available at the ProteomeXchange under identifier PXD029966 (http://proteomecentral.proteomexchange.org). c–i, Lectin blotting. Volumes of MARS column eluates corresponding to equivalent volumes of starting plasma were subjected to SDS-PAGE followed by lectin blotting, Neu5Gc immunoblotting, and silver staining. Although sialylated glycoproteins were more abundant in pregnant plasma specimens, it is important to emphasize that these blotting experiments alone do not demonstrate that the corresponding proteins were derived from the placenta. Many were likely derived from the liver, in accord with our mass spectrometry data. For gel source data, see Supplementary Fig. 1. The experiment was performed once.
Extended Data Fig. 10 |. LYN deficiency allows for partial OT-II cell priming in response to t-mOVA.
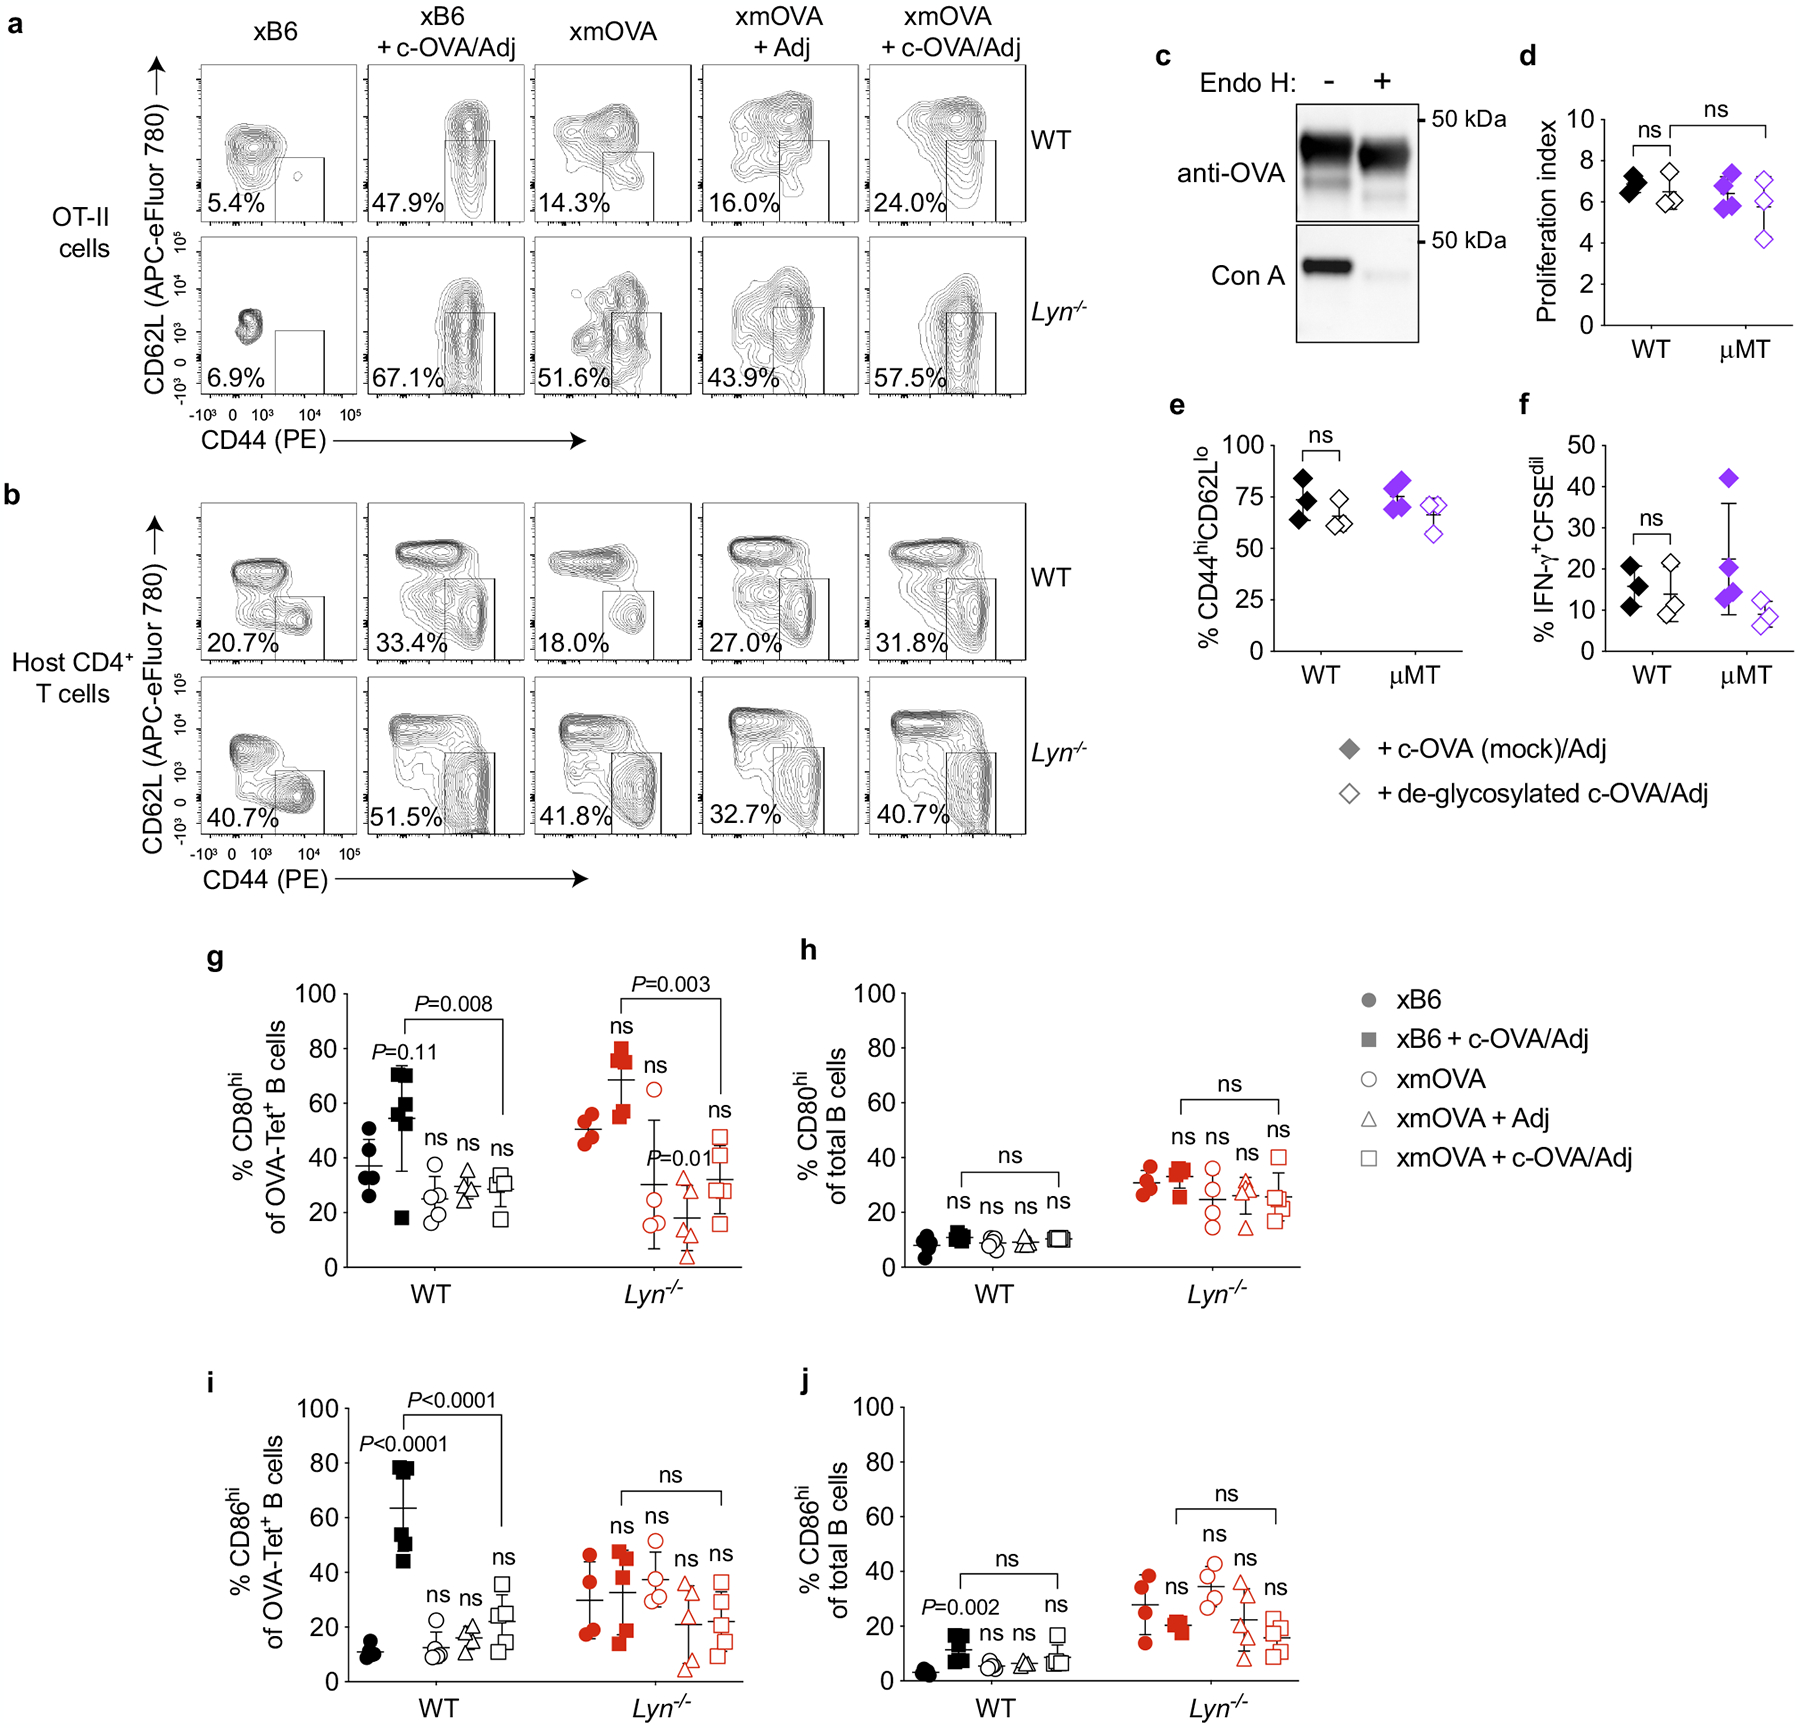
a, b, Analysis of CD44 and CD62L expression. Representative flow plots (n ≥ 5 mice/group) (a) showing the frequency of CD44hiCD62Llo OT-II cells among total OT-II cells 6 days after adoptive transfer into WT or Lyn−/− pregnant mice mated as indicated; the CD44hiCD62Llo gate was set based upon host CD4 cells for each cytometry run, which is shown in (b). Some groups received i.v. adjuvants (poly(I:C)+anti-CD40 antibodies) ± c-OVA at the time of OT-II transfer. See Fig. 4c for summary data. c–f, Assessment of the immunogenicity of Endoglycosidase H- (Endo H-) deglycosylated c-OVA. The extent of deglycosylation in Endo H- or mock (−)-treated c-OVA was determined via Concanavalin A (Con A) lectin blotting (c). Proliferation index (d), activation marker expression (e), and IFN-γ production (f) of CFSE-labeled OT-II cells were determined 6 days after transfer into virgin WT and μMT females, with 300 μg mock-treated or deglycosylated c-OVA given i.p. together with adjuvants (poly(I:C)+anti-CD40 antibodies) on the same day as the OT-II transfer. Bars show mean±s.d. P-values were determined by two-tailed, unpaired t-test. Data were accumulated from 3 independent experiments and all mice are shown. g–j, Upregulation of CD80 and CD86 by antigen-specific B cells is suppressed by t-mOVA in WT and Lyn−/− pregnant mice. Frequency of CD80hi or CD86hi OVA-Tetramer+ (g, i) or total (h, j) B cells 6 days after i.v. vaccination with 5×10⁴ OT-II cells ± c-OVA ± poly(I:C) (Adj) on E11.5 or E12.5. Adjusted P-values were determined by ordinary one-way ANOVA with Šídák’s multiple comparisons test. Each group was compared to the control xB6 group, and the xB6+c-OVA/Adj group was compared to the xmOVA+c-OVA/Adj group. Bars show mean±s.d. Data were accumulated over 39 independent experiments and all mice are shown.
Supplementary Material
Acknowledgements
This work was supported by NIH grant K08AI137209 (to G.R.); the UCSF Department of Laboratory Medicine and School of Medicine (to A.E.); and the UCSF Parnassus Flow Cytometry Core Facility with funding from DRC Center Grant NIH P30 DK063720. We thank D. Hirshhorn-Cymerman for helpful discussions, A. DeFranco for comments on the manuscript, C. Mineo for mice, D. Mueller for providing the tetramer synthesis protocol and S. Gaw for providing plasma collected from healthy mothers.
Footnotes
Online content
Any methods, additional references, Nature Research reporting summaries, source data, extended data, supplementary information, acknowledgements, peer review information; details of author contributions and competing interests; and statements of data and code availability are available at https://doi.org/10.1038/s41586-022-04471-0.
Competing interests S.J.F. is a consultant for Novo Nordisk, and J.Z. is a consultant for Walking Fish Therapeutics. G.R., J.F.B., S.T.T., T.I.M., S.M., D.R. and A.E. declare no competing interests.
Supplementary information The online version contains supplementary material available at https://doi.org/10.1038/s41586-022-04471-0.
Data availability
The MS proteomics data are publicly available within the ProteomeXchange Consortium (http://proteomecentral.proteomexchange.org) under the dataset identifier PXD029966. All other data generated and analysed during this study are included in this published article (and its Supplementary Information files). Source data are provided with this paper.
References
- 1.Janeway CA Jr. The immune system evolved to discriminate infectious nonself from noninfectious self. Immunol. Today 13, 11–16 (1992). [DOI] [PubMed] [Google Scholar]
- 2.Erlebacher A Mechanisms of T cell tolerance towards the allogeneic fetus. Nat. Rev. Immunol 13, 23–33 (2013). [DOI] [PubMed] [Google Scholar]
- 3.Jiang TT et al. Regulatory T cells: new keys for further unlocking the enigma of fetal tolerance and pregnancy complications. J. Immunol 192, 4949–4956 (2014). [DOI] [PMC free article] [PubMed] [Google Scholar]
- 4.Erlebacher A, Vencato D, Price KA, Zhang D & Glimcher LH Constraints in antigen presentation severely restrict T cell recognition of the allogeneic fetus. J. Clin. Invest 117, 1399–1411 (2007). [DOI] [PMC free article] [PubMed] [Google Scholar]
- 5.Barton BM, Xu R, Wherry EJ & Porrett PM Pregnancy promotes tolerance to future offspring by programming selective dysfunction in long-lived maternal T cells. J. Leukoc. Biol 101, 975–987 (2017). [DOI] [PMC free article] [PubMed] [Google Scholar]
- 6.Jasti S, Farahbakhsh M, Nguyen S, Petroff BK & Petroff MG Immune response to a model shared placenta/tumor-associated antigen reduces cancer risk in parous mice. Biol. Reprod 96, 134–144 (2017). [DOI] [PMC free article] [PubMed] [Google Scholar]
- 7.Kinder JM et al. CD8+ T cell functional exhaustion overrides pregnancy-induced fetal antigen alloimmunization. Cell Rep. 31, 107784 (2020). [DOI] [PMC free article] [PubMed] [Google Scholar]
- 8.Tay CS, Tagliani E, Collins MK & Erlebacher A Cis-acting pathways selectively enforce the non-immunogenicity of shed placental antigen for maternal CD8 T cells. PLoS ONE 8, e84064 (2013). [DOI] [PMC free article] [PubMed] [Google Scholar]
- 9.Ehst BD, Ingulli E & Jenkins MK Development of a novel transgenic mouse for the study of interactions between CD4 and CD8 T cells during graft rejection. Am. J. Transplant 3, 1355–1362 (2003). [DOI] [PubMed] [Google Scholar]
- 10.Filatenkov AA et al. CD4 T cell-dependent conditioning of dendritic cells to produce IL-12 results in CD8-mediated graft rejection and avoidance of tolerance. J. Immunol 174, 6909–6917 (2005). [DOI] [PubMed] [Google Scholar]
- 11.Moldenhauer LM et al. Cross-presentation of male seminal fluid antigens elicits T cell activation to initiate the female immune response to pregnancy. J. Immunol 182, 8080–8093 (2009). [DOI] [PubMed] [Google Scholar]
- 12.Rowe JH, Ertelt JM, Aguilera MN, Farrar MA & Way SS Foxp3+ regulatory T cell expansion required for sustaining pregnancy compromises host defense against prenatal bacterial pathogens. Cell Host Microbe 10, 54–64 (2011). [DOI] [PMC free article] [PubMed] [Google Scholar]
- 13.Rowe JH, Ertelt JM, Xin L & Way SS Pregnancy imprints regulatory memory that sustains anergy to fetal antigen. Nature 490, 102–106 (2012). [DOI] [PMC free article] [PubMed] [Google Scholar]
- 14.Bouaziz JD et al. Therapeutic B cell depletion impairs adaptive and autoreactive CD4+ T cell activation in mice. Proc. Natl Acad. Sci. USA 104, 20878–20883 (2007). [DOI] [PMC free article] [PubMed] [Google Scholar]
- 15.Taylor JJ et al. Deletion and anergy of polyclonal B cells specific for ubiquitous membrane-bound self-antigen. J. Exp. Med 209, 2065–2077 (2012). [DOI] [PMC free article] [PubMed] [Google Scholar]
- 16.Harvey DJ, Wing DR, Kuster B & Wilson IB Composition of N-linked carbohydrates from ovalbumin and co-purified glycoproteins. J. Am. Soc. Mass. Spectrom 11, 564–571 (2000). [DOI] [PubMed] [Google Scholar]
- 17.Perdicchio M et al. Sialic acid-modified antigens impose tolerance via inhibition of T-cell proliferation and de novo induction of regulatory T cells. Proc. Natl Acad. Sci. USA 113, 3329–3334 (2016). [DOI] [PMC free article] [PubMed] [Google Scholar]
- 18.Meyer SJ, Linder AT, Brandl C & Nitschke L B cell Siglecs—news on signaling and its interplay with ligand binding. Front. Immunol 9, 2820 (2018). [DOI] [PMC free article] [PubMed] [Google Scholar]
- 19.Hibbs ML et al. Multiple defects in the immune system of Lyn-deficient mice, culminating in autoimmune disease. Cell 83, 301–311 (1995). [DOI] [PubMed] [Google Scholar]
- 20.Chu CL & Lowell CA The Lyn tyrosine kinase differentially regulates dendritic cell generation and maturation. J. Immunol 175, 2880–2889 (2005). [DOI] [PubMed] [Google Scholar]
- 21.Nancy P et al. Chemokine gene silencing in decidual stromal cells limits T cell access to the maternal–fetal interface. Science 336, 1317–1321 (2012). [DOI] [PMC free article] [PubMed] [Google Scholar]
- 22.Abeln M et al. Sialic acid is a critical fetal defense against maternal complement attack. J. Clin. Invest 129, 422–436 (2019). [DOI] [PMC free article] [PubMed] [Google Scholar]
- 23.Hromatka BS et al. Polysialic acid enhances the migration and invasion of human cytotrophoblasts. Glycobiology 23, 593–602 (2013). [DOI] [PMC free article] [PubMed] [Google Scholar]
- 24.Chen Q et al. Evidence for differential glycosylation of trophoblast cell types. Mol. Cell Proteomics 15, 1857–1866 (2016). [DOI] [PMC free article] [PubMed] [Google Scholar]
- 25.Pfrengle F, Macauley MS, Kawasaki N & Paulson JC Copresentation of antigen and ligands of Siglec-G induces B cell tolerance independent of CD22. J. Immunol 191, 1724–1731 (2013). [DOI] [PMC free article] [PubMed] [Google Scholar]
- 26.Tokatlian T et al. Innate immune recognition of glycans targets HIV nanoparticle immunogens to germinal centers. Science 363, 649–654 (2019). [DOI] [PMC free article] [PubMed] [Google Scholar]
- 27.Archambault AS et al. Cutting edge: conditional MHC class II expression reveals a limited role for B cell antigen presentation in primary and secondary CD4 T cell responses. J. Immunol 191, 545–550 (2013). [DOI] [PMC free article] [PubMed] [Google Scholar]
- 28.Brodie EJ, Infantino S, Low MSY & Tarlinton DM Lyn, lupus, and (B) lymphocytes, a lesson on the critical balance of kinase signaling in immunity. Front. Immunol 9, 401 (2018). [DOI] [PMC free article] [PubMed] [Google Scholar]
- 29.Lateef A & Petri M Management of pregnancy in systemic lupus erythematosus. Nat. Rev. Rheumatol 8, 710–718 (2012). [DOI] [PubMed] [Google Scholar]
- 30.Laubli H & Varki A Sialic acid-binding immunoglobulin-like lectins (Siglecs) detect self-associated molecular patterns to regulate immune responses. Cell. Mol. Life Sci 77, 593–605 (2020). [DOI] [PMC free article] [PubMed] [Google Scholar]
- 31.Hogquist KA et al. T cell receptor antagonist peptides induce positive selection. Cell 76, 17–27 (1994). [DOI] [PubMed] [Google Scholar]
- 32.Barnden MJ, Allison J, Heath WR & Carbone FR Defective TCR expression in transgenic mice constructed using cDNA-based α- and β-chain genes under the control of heterologous regulatory elements. Immunol. Cell Biol 76, 34–40 (1998). [DOI] [PubMed] [Google Scholar]
- 33.Hildner K et al. Batf3 deficiency reveals a critical role for CD8α+ dendritic cells in cytotoxic T cell immunity. Science 322, 1097–1100 (2008). [DOI] [PMC free article] [PubMed] [Google Scholar]
- 34.Kitamura D, Roes J, Kuhn R & Rajewsky K A B cell-deficient mouse by targeted disruption of the membrane exon of the immunoglobulin mu chain gene. Nature 350, 423–426 (1991). [DOI] [PubMed] [Google Scholar]
- 35.Kim JM, Rasmussen JP & Rudensky AY Regulatory T cells prevent catastrophic autoimmunity throughout the lifespan of mice. Nat. Immunol 8, 191–197 (2007). [DOI] [PubMed] [Google Scholar]
- 36.McKenna HJ et al. Mice lacking Flt3 ligand have deficient hematopoiesis affecting hematopoietic progenitor cells, dendritic cells, and natural killer cells. Blood 95, 3489–3497 (2000). [PubMed] [Google Scholar]
- 37.Rickert RC, Roes J & Rajewsky K B lymphocyte-specific, Cre-mediated mutagenesis in mice. Nucleic Acids Res. 25, 1317–1318 (1997). [DOI] [PMC free article] [PubMed] [Google Scholar]
- 38.Miyake Y et al. Critical role of macrophages in the marginal zone in the suppression of immune responses to apoptotic cell-associated antigens. J. Clin. Invest 117, 2268–2278 (2007). [DOI] [PMC free article] [PubMed] [Google Scholar]
- 39.Mason DY, Jones M & Goodnow CC Development and follicular localization of tolerant B lymphocytes in lysozyme/anti-lysozyme IgM/IgD transgenic mice. Int. Immunol 4, 163–175 (1992). [DOI] [PubMed] [Google Scholar]
- 40.Lewandoski M, Meyers EN & Martin GR Analysis of Fgf8 gene function in vertebrate development. Cold Spring Harb. Symp. Quant. Biol 62, 159–168 (1997). [PubMed] [Google Scholar]
- 41.Chan VW, Meng F, Soriano P, DeFranco AL & Lowell CA Characterization of the B lymphocyte populations in Lyn-deficient mice and the role of Lyn in signal initiation and down-regulation. Immunity 7, 69–81 (1997). [DOI] [PubMed] [Google Scholar]
- 42.Otipoby KL et al. CD22 regulates thymus-independent responses and the lifespan of B cells. Nature 384, 634–637 (1996). [DOI] [PubMed] [Google Scholar]
- 43.Tanigaki K et al. Endothelial Fcγ receptor IIB activation blunts insulin delivery to skeletal muscle to cause insulin resistance in mice. Diabetes 65, 1996–2005 (2016). [DOI] [PMC free article] [PubMed] [Google Scholar]
- 44.Quah BJ, Warren HS & Parish CR Monitoring lymphocyte proliferation in vitro and in vivo with the intracellular fluorescent dye carboxyfluorescein diacetate succinimidyl ester. Nat. Protoc 2, 2049–2056 (2007). [DOI] [PubMed] [Google Scholar]
- 45.Dahlgren MW et al. T follicular helper, but not Th1, cell differentiation in the absence of conventional dendritic cells. J. Immunol 194, 5187–5199 (2015). [DOI] [PubMed] [Google Scholar]
- 46.Okeke EB, Okwor I & Uzonna JE Regulatory T cells restrain CD4+ T cells from causing unregulated immune activation and hypersensitivity to lipopolysaccharide challenge. J. Immunol 193, 655–662 (2014). [DOI] [PubMed] [Google Scholar]
- 47.van Rooijen N & van Nieuwmegen R Elimination of phagocytic cells in the spleen after intravenous injection of liposome-encapsulated dichloromethylene diphosphonate. An enzyme-histochemical study. Cell Tissue Res. 238, 355–358 (1984). [DOI] [PubMed] [Google Scholar]
- 48.Hong S et al. B cells are the dominant antigen-presenting cells that activate naive CD4+ T cells upon immunization with a virus-derived nanoparticle antigen. Immunity 49, 695–708.e4 (2018). [DOI] [PubMed] [Google Scholar]
- 49.Maley F, Trimble RB, Tarentino AL & Plummer TH Jr. Characterization of glycoproteins and their associated oligosaccharides through the use of endoglycosidases. Anal. Biochem 180, 195–204 (1989). [DOI] [PubMed] [Google Scholar]
- 50.Liu H, Gaza-Bulseco G, Chumsae C & Newby-Kew A Characterization of lower molecular weight artifact bands of recombinant monoclonal IgG1 antibodies on non-reducing SDS–PAGE. Biotechnol. Lett 29, 1611–1622 (2007). [DOI] [PubMed] [Google Scholar]
- 51.Drake PM et al. A lectin affinity workflow targeting glycosite-specific, cancer-related carbohydrate structures in trypsin-digested human plasma. Anal. Biochem 408, 71–85 (2011). [DOI] [PMC free article] [PubMed] [Google Scholar]
- 52.Collins BE et al. High-affinity ligand probes of CD22 overcome the threshold set by cis ligands to allow for binding, endocytosis, and killing of B cells. J. Immunol 177, 2994–3003 (2006). [DOI] [PubMed] [Google Scholar]
- 53.Wu C, Jin X, Tsueng G, Afrasiabi C & Su AI BioGPS: building your own mash-up of gene annotations and expression profiles. Nucleic Acids Res. 44, D313–D316 (2016). [DOI] [PMC free article] [PubMed] [Google Scholar]
- 54.Marsh B & Blelloch R Single nuclei RNA-seq of mouse placental labyrinth development. eLife 9, e60266 (2020). [DOI] [PMC free article] [PubMed] [Google Scholar]
- 55.Dziadek MA & Andrews GK Tissue specificity of alpha-fetoprotein messenger RNA expression during mouse embryogenesis. EMBO J. 2, 549–554 (1983). [DOI] [PMC free article] [PubMed] [Google Scholar]
- 56.Jones EA, Clement-Jones M, James OF & Wilson DI Differences between human and mouse alpha-fetoprotein expression during early development. J. Anat 198, 555–559 (2001). [DOI] [PMC free article] [PubMed] [Google Scholar]
- 57.Moore T & Dveksler GS Pregnancy-specific glycoproteins: complex gene families regulating maternal–fetal interactions. Int. J. Dev. Biol 58, 273–280 (2014). [DOI] [PubMed] [Google Scholar]
- 58.Mendoza M et al. Glycan characterization of pregnancy-specific glycoprotein 1 and its identification as a novel Galectin-1 ligand. Glycobiology 30, 895–909 (2020). [DOI] [PMC free article] [PubMed] [Google Scholar]
- 59.Zhu BC et al. Human placental (fetal) fibronectin: increased glycosylation and higher protease resistance than plasma fibronectin. Presence of polylactosamine glycopeptides and properties of a 44-kilodalton chymotryptic collagen-binding domain: difference from human plasma fibronectin. J. Biol. Chem 259, 3962–3970 (1984). [PubMed] [Google Scholar]
Associated Data
This section collects any data citations, data availability statements, or supplementary materials included in this article.
Supplementary Materials
Data Availability Statement
The MS proteomics data are publicly available within the ProteomeXchange Consortium (http://proteomecentral.proteomexchange.org) under the dataset identifier PXD029966. All other data generated and analysed during this study are included in this published article (and its Supplementary Information files). Source data are provided with this paper.


