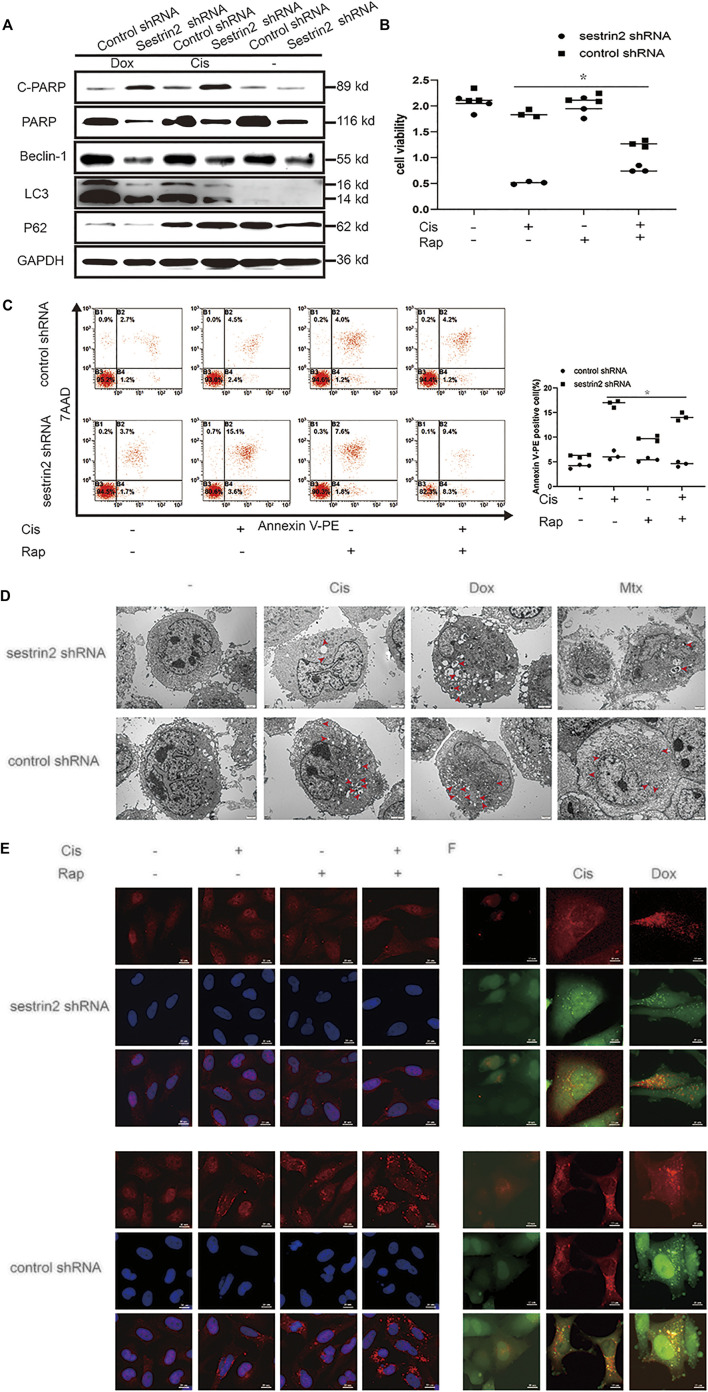
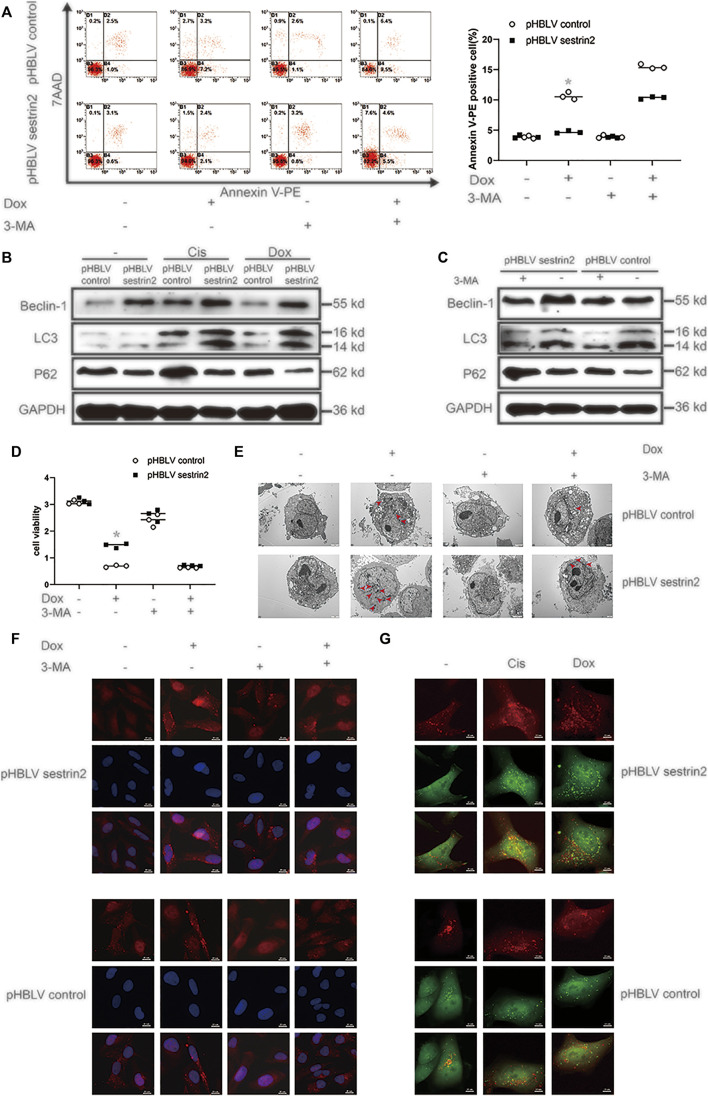
In the original article, there was a mistake in Figures 3D,E, 4E as published. The transmission electron microscopy shown in Figures 3D, 4E, and immunofluorescence in Figure 3E were mistakenly used.
FIGURE 3.
Knockdown of SESN2 resulted in inhibited autophagy and increased apoptosis of osteosarcoma cells treated with chemotherapy. After treatment with Cis (20 μmol/L), Dox (0.2 μg/ml), or Mtx (50 μmol/L) for 24 h, SESN2-knockdown and control cells were subjected to western blot to detect the expression of cleaved and total PARP, LC3, and P62 expression levels (A) (n = 3). SESN2-knockdown HOS cells were treated with Cis (20 μmol/L) for 24 h with or without rapamycin (100 nmol/L) for 6 h. Proliferation was analysed by CCK-8 assay (B) (n = 3), apoptosis was assessed by Annexin V-PE/PI staining (C) (n = 3), and LC3 puncta formation was analysed by immunofluorescence (E) (n = 3, scale bar = 20 µm). Intracellular autophagosomes were observed by TEM (D) (n = 3, scale bar = 2 µm), and autophagic flux was monitored by fluorescence microscopy in HOS cells with transient expression of GFP-RFP-LC3 in HOS cells (F) (n = 3, scale bar = 10 µm). The data are presented as the mean ± SD. *p < 0.05 vs. the Control shRNA group.
FIGURE 4.
SESN2 regulates autophagy and reduces the sensitivity of osteosarcoma cells to chemotherapy. In the presence or absence of 3-MA (5 mM), SESN2-overexpressing and control HOS cells were treated with Dox (0.2 μg/ml) for 24 h, and apoptosis was analysed by flow cytometry (A) (n = 3). After treatment with Cis (20 μmol/L) or Dox (0.2 μg/ml), the expression levels of LC3 and P62 in SESN2-overexpressing and control HOS cells were detected by western blot (B) (n = 3). The expression levels of LC3 and P62 in SESN2-overexpressing and control HOS cells treated with 3-MA (5 mM) were detected by western blot (C) (n = 3). In the presence or absence of 3-MA (5 mM), SESN2-overexpressing and control HOS cells were treated with Dox (0.2 μg/ml) for 24 h, cell activity was detected by CCK-8 (D) (n = 3), intracellular autophagosomes were observed by TEM (E) (n = 3, scale bar = 2 µm), and intracellular LC3 puncta formation was analysed by immunofluorescence (F) (n = 3, scale bar = 20 µm). After treatment with Cis (20 μmol/L) or Dox (0.2 μg/ml), autophagosome formation in HOS cells with ectopic SESN2 expression was monitored by immunofluorescence through transfection with RFP-GFP-LC3 lentivirus after upregulating SESN2 (G) (n = 3, scale bar = 10 µm). The data are presented as the mean ± SD. *p < 0.05 vs. the pHBLV control group.
The red arrows in the figure legends of Figures 3, 4 are autophagosomes.
The authors apologize for this error and state that this does not change the scientific conclusions of the article in any way. The original article has been updated.
Publisher’s note
All claims expressed in this article are solely those of the authors and do not necessarily represent those of their affiliated organizations, or those of the publisher, the editors and the reviewers. Any product that may be evaluated in this article, or claim that may be made by its manufacturer, is not guaranteed or endorsed by the publisher.


