

Summary
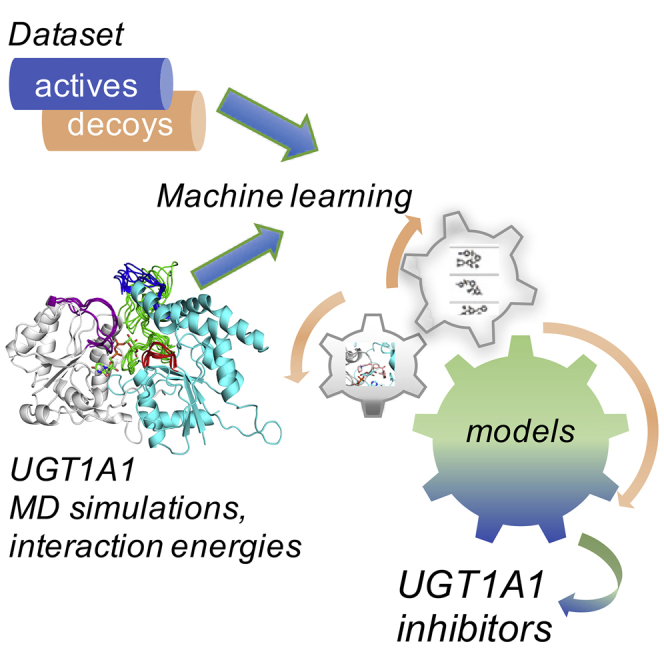
UDP-glucuronosyltransferases (UGTs) are responsible for 35% of the phase II drug metabolism. In this study, we focused on UGT1A1, which is a key UGT isoform. Strong inhibition of UGT1A1 may trigger adverse drug/herb-drug interactions, or result in disorders of endobiotic metabolism. Most of the current machine learning methods predicting the inhibition of drug metabolizing enzymes neglect protein structure and dynamics, both being essential for the recognition of various substrates and inhibitors. We performed molecular dynamics simulations on a homology model of the human UGT1A1 structure containing both the cofactor- (UDP-glucuronic acid) and substrate-binding domains to explore UGT conformational changes. Then, we created models for the prediction of UGT1A1 inhibitors by integrating information on UGT1A1 structure and dynamics, interactions with diverse ligands, and machine learning. These models can be helpful for further prediction of drug-drug interactions of drug candidates and safety treatments.
Subject areas: Drugs, Computational chemistry, Bioinformatics, Artificial intelligence
Graphical abstract
Highlights
-
•
UGTs are responsible for 35% of the phase II drug metabolism reactions
-
•
We created machine learning models for prediction of UGT1A1 inhibitors
-
•
Our simulations suggested key residues of UGT1A1 involved in the substrate binding
Drugs; Computational chemistry; Bioinformatics; Artificial intelligence
Introduction
Drug metabolizing enzymes (DMEs) are involved in the metabolism of endogenous molecules, xenobiotics, and drugs (Testa et al., 2012). They play a key role in the detoxification of organisms by modifying toxic substances and drugs to facilitate their elimination (Grant, 1991; Rowland et al., 2013). In some cases, the metabolites are more toxic, thereby inducing severe side effects and adverse drug reactions (Shimada, 2006), or their inhibition can lead to drug–drug interactions (DDI) (Prueksaritanont et al., 2013). Although phase I drug metabolism (or functionalization) involves mainly oxidation-reduction reactions, phase II metabolism (or conjugation) reactions catalyze the covalent addition of polar groups like sulfate, glutathione, glucuronic acid, or others to a broad range of substrates (Almazroo et al., 2017; Testa et al., 2012). Numerous compounds (e.g. bilirubin, steroids, paracetamol, etc.) are conjugated directly by phase II enzymes without a preceding phase I reaction (Kaivosaari et al., 2011; Testa et al., 2012). Although conjugation reactions generally create water-soluble and inactive metabolites, reactive conjugated metabolites have also been reported (Bauer et al., 1995; Osborne et al., 1992; Shimada, 2006).
Uridine-diphosphate (UDP)-glucuronosyl transferase (UGT) metabolism accounts for up to 35% of all phase II DME reactions (Testa et al., 2012). UGT is a superfamily of phase II DMEs catalyzing the covalent addition of glucuronic acid to a wide range of substrates (Oda et al., 2015; Rowland et al., 2013) in the lumen of the endoplasmic reticulum (Meech and Mackenzie, 1997). Most human UGTs are physiologically highly expressed in the liver but are also present in other tissues like the intestine, the kidneys, the stomach, and the lungs (Ohno and Nakajin, 2009). Based on evolutionary divergence, mammalian UGTs can be divided into two families, UGT1 and UGT2. Human enzymes belonging to the UGT1 family all share an identical C-terminal domain which is responsible for the binding of the cofactor uridine diphosphate glucuronic acid (UDPGA) and contains a Rosmannfold motif; and a characteristic N-terminal domain, containing highly variable regions, which is responsible for the substrate binding and accounts for the selectivity of the different isoenzymes (Figure 1) (Miners and Mackenzie, 1991; Ritter et al., 1992; Tukey and Strassburg, 2000). UGTs exhibit distinct but overlapping substrate specificity, and multiple UGT isoforms can be co-expressed in a given tissue (Court, 2005). The isoenzyme UGT1A1 is of particular importance accounting for 15% of all UGT drug metabolism (Williams et al., 2004). It also plays an exclusive role in glucuronidation and, therefore, the detoxification of the endogenous heme breakdown by-product, bilirubin (Bosma, 2003).
Figure 1.

Homology model of the human UGT1A1 (Locuson et al.)
UGT1A1is bound to the cofactor UDPGA and contains the cofactor-binding (in white) and the substrate-binding (in cyan) domains. The cofactor and key enzymatic residues are in licorice representation.
Strong UGT1A1 inhibition may trigger adverse drug/herb-drug interactions, or can result in metabolic disorders of the endobiotic metabolism (Li et al., 2019; Liu et al., 2019; Lv et al., 2019).Numerous drugs, including virus protease inhibitors, tyrosine kinase inhibitors, and antifungal agents, have been reported to induce unconjugated hyperbilirubinemia or increase the concentration of cytotoxic agents through UGT1A1 inhibition in clinic (Goon et al., 2016; Lv et al., 2019; Steventon, 2020). Therefore, the European Medicines Agency (EMA) and the US Food and Drug Administration (FDA) recommend testing for possible UGT1A1 inhibitor status over the course of drug development (Lv et al., 2019; Prueksaritanont et al., 2013) to avoid possible DDI.
Here, we focus on the prediction of inhibitors of UGT1A1. The prediction of DMEs inhibition is a challenging task (Kato, 2020) because of their promiscuous nature. Thus, it is important to consider protein structure and dynamics of DMEs, both being essential for the recognition of the various substrates and inhibitors. Structural information is also important to understand the molecular mechanism of the UGT catalyzed glucuronidation and its inhibition in all their complexity. Up to now, no experimental structures of the UGT1 family have been resolved. There are two crystal structures available only for the cofactor-binding domain of UGT2B7 (Miley et al., 2007) and UGT2B15 (Zhang et al., 2020). Multiple homology models of the human UGT1A1 have been published using the former structure together with plant and bacterial homologs (Laakkonen and Finel, 2010; Li and Wu, 2007; Locuson and Tracy, 2007). We have exploited such information to build prediction models of UGT inhibition using structure-based and machine learning (ML) approaches. Previously, we have developed similar models to predict the inhibition of cytochrome P450 (Goldwaser et al., 2022; Martiny et al., 2015) and phase II sulfotransferases (Martiny et al., 2013). Machine learning approaches have become fundamental in all stages of drug discovery and development (Carracedo-Reboredo et al., 2021; Mao et al., 2021). During the last decade, several ML models have been developed to predict the site of metabolism for UGT-catalyzed reactions (Cai et al., 2019; Hwang et al., 2020; Peng et al., 2014; Sorich et al., 2004, 2008). To the best of our knowledge, no predictive models have been reported to date for UGT inhibition.
In the present study, we integrated structural and ligand-based information in different machine learning approaches to generate predictive models of UGT inhibition. We ran molecular dynamics simulations on the human UGT1A1 structure containing both the cofactor- and the substrate-binding domains to consider conformational changes in its active site, critical for the accommodation of the diverse substrates and inhibitors, and performed docking simulations with a collection of experimentally validated UGT1A1 ligands to gain information on enzyme-inhibitor interactions. We performed a rational selection of ligand-based descriptors and successfully trained ML models for the prediction of UGT1A1 inhibitors with around 90% accuracy.
Results and discussion
Our study combines structure-based modeling and machine learning to build models for predicting UGT1A1 inhibition. The workflow is shown in Figure 2. For the dataset preparation, we collected known ligands of UGT1A1, inhibitors and substrates, from the ChEMBL, DrugBank, and PubChem databases. We performed curation of the collected compounds (see method details) and finally, 89 actives (listed in the Supplemental Information (SI) and 450 decoys were retained for docking and ML datasets. Approximately 5 times more decoys than actives were used because of the lack of experimentally validated inactive molecules in the dataset. The training and external test sets were constructed by randomly dividing both the final actives and decoys, according to a ratio of 70 and 30%, respectively.
Figure 2.

Workflow of the models’ development.
The models’ development includes datasets preparation, UGT1A1 homology modeling, molecular dynamics simulations, docking-scoring and machine learning to train different models for the prediction of UGT1A1 inhibitors.
We performed MD simulations of UGT1A1 to address its conformational flexibility and the large substrate spectrum of the enzyme. The homology model of UGT1A1 with the bound cofactor UDPGA built by Locuson et al. (Locuson and Tracy, 2007) was used as a starting structure for our MD simulations. Selected MD conformations were used for a subsequent ensemble docking step with the active UGT1A1 ligands. Finally, ML models were created to predict molecules inhibiting UGT1A1, incorporating interactions with six UGT1A1 conformations selected after the ensemble docking.
Molecular dynamics simulations
To address the degree of structural flexibility and the conformational adaptation of the binding pocket in light of the structural variety of the active compounds, we performed three 100-ns long MD simulations in the presence of the cofactor. Root-mean-square deviation (RMSD) was calculated over time with respect to the starting structure to monitor conformational evolution (Figure 3A). All three runs quickly diverted from the initial conformation reaching relatively high differences (up to 9 Å). The radius of gyration was calculated to examine further the behavior of the enzyme dynamics (Figure 3B). Alteration in the radius of gyration generally corresponds to the overall changes in compactness. For the first MD run, we observed variations as high as 2.5 Å, which, together with a visual inspection of the trajectory, revealed larger interdomain opening-closing motions (dissociation/approaching of the domain tips). To further investigate the underlying conformational changes, especially focusing on the catalytically important pocket regions, we monitored the variations in the substrate-binding pocket volume Figure 3C; for its definition, see the list of residues in SI. In some conformations, its volume reached 1.5 to 2 times the size of the starting structure. The large variations in the substrate-binding pocket volume and the opening toward the lumen can facilitate access to the catalytic site and accommodate the diverse substrates. RMSD-based clustering of the MD trajectories enabled the extraction of 57 enzyme conformations with diverse binding pockets (see method details).
Figure 3.

Monitored parameters during the three 100-ns long MD simulations
(A) Root-mean-square deviation (RMSD) of the backbone atoms with respect to the starting structure.
(B) Radius of gyration (Rgyr).
(C) the volume of the substrate binding pocket.
Ensemble docking and MD-derived structures best retrieving the UGT1A1 binders
In order to select the protein conformations best distinguishing between active and inactive compounds, we performed virtual screening of the active and decoy molecules of the training set using docking-scoring with AutoDock Vina (Trott and Olson, 2010) into the 57 centroid conformations of UGT1A1. Enrichment curves representing the percentage of actives retrieved at a percentage of screened actives and decoys were calculated by retaining the best score of interaction energies (IE) computed by docking-scoring for each compound in each protein conformation. The area under the receiver operating characteristic curve (AUC) revealed six best UGT1A1 conformations (see Figure S1): MD6, MD7, MD47, MD52, MD53, and MD54. The computed IE scores for these six UGT1A1 conformations were then used as protein-ligand interactions-based descriptors for the ML modeling.
Interestingly, we found that even though there is a large flexibility of the substrate binding-pocket, in these six conformations, key residues for the catalytic reaction remained less flexible, and kept their orientation within the binding pocket. A key element of the enzymatic reaction of UGT1A1 is the deprotonation of the substrate by residue H39 for a nucleophilic attack (Li and Wu, 2007; Miley et al., 2007; Patana et al., 2008). This histidine, together with other catalytic residues, S38 and F153 (Offen et al., 2006), kept their backbone part rigid whereas their side chains showed rotational flexibility, which enables some degree of freedom to adapt to the binding of the different ligands while maintaining the necessary catalytic configuration (Figure 4). The position and orientation of these catalytic residues are very similar to what is found in the plant flavonoid 3-O-glycosyltransferase VvGT1 (PDB: 2C9Z) (Offen et al., 2006), where the corresponding residues are H20, S18, and F121, respectively. Other regions, especially loop segments at the entrance and the edge of the substrate-binding pocket, show considerable fluctuation among the 6 conformations, including residues 34–39, 99–109, 175–210, and 307–316 (Figure 5). The flexibility of these loops also promotes the admission and the accommodation of the diverse ligands and further emphasizes the importance of considering enzyme dynamics in docking experiments, and therefore, in enzyme inhibition prediction studies.
Figure 4.

Key residues of flavonoid 3-O-glycosyltransferase and UGT1A1.
The orientations of key enzymatic residues in the homologous plant flavonoid 3-O-glycosyltransferase (in green) and the six UGT1A1 conformations used in the ML models (cofactor-binding domains in white, substrate-binding domains in cyan). Residue labels belonging to the UGT1A1 conformations are underlined whereas labels corresponding to the plant homologue are not.
Figure 5.

Flexible loop regions of UGT1A1.
Flexible loop regions of the six MD conformations of UGT1A1 at the entrance and the edge of the substrate-binding pocket, residues 34–39 (in red), 99–109 (in blue), 175–210 (in green), and 307–316 (in purple). The cofactor-binding domain is in white, the substrate-binding domain in cyan, the cofactor is in licorice representation.
Descriptor calculation and machine learning modeling
Then, we developed classification ML models for the prediction of UGT1A1 inhibitors. Physicochemical molecular descriptors of the training set’s molecules were calculated using the MOE software (Molecular Operating Environment (MOE), Release 2016). Initially, we calculated 354 2D and 3D MOE descriptors. Highly correlated descriptors with an absolute value of the Pearson correlation coefficient greater than or equal to 0.85 and descriptors with near null variance were removed. This selection resulted in a total of 162 descriptors. The IE scores of the compounds of the training set calculated for the six selected UGT1A1 conformations were added as structure-based descriptors accounting for the protein-ligand interactions. To avoid overfitting and decrease the calculation time, we selected the best descriptors based on their relative importance in predicting the interaction with UGT1A1. The selection comprised of building a number of Random Forest (RF) models on the training dataset and selecting the subset of descriptors with the highest Gini importance (Kantardzic, 2019). The Gini impurity index is a measure of the probability of incorrectly classifying a randomly selected element in a dataset. Thus, we performed 1000 RF runs with the 162 MOE and 6 IE descriptors with the default values of ntree, mtry, and sampsize (Table S1) to calculate the mean importance of the 168 descriptors, according to the diminution of the Gini criterion (see method details and Figure S2). The first 25 descriptors (including 4 IEs) were most important for the model performance (see Table S2). Then, the importance decreased slowly, and we decided to consider all the descriptors showing an importance greater than 0.5, including thus a total of 56 MOE and the 6 IEs. The most important descriptors are related to polarity, lipophilicity, and charges. Principal component analysis (PCA) was performed on the 56 best MOE descriptors, and the training and the external test sets are shown in the subspace spanned by the first two PCs in Figure 6. Overall, the training and test sets’ compounds covered similar chemical space. Thus, our models are applicable within a domain given by the “soft” drug-like filter thresholds (see method details). Of interest, even though our negative dataset contains decoys instead of real non-inhibitors, Figure 6C shows that an important part of the actives is in different chemical space.
Figure 6.

Chemical space of the training and external test sets as described by the principal component analysis (PCA)
The first two components, Dim 1 and Dim 2, and their representation in % of the total variance are indicated.
(A) PCA of the actives of training versus test sets.
(B) PCA of the decoys of training versus test sets.
(C) PCA of all actives versus decoys.
Performance of the ML models in predicting binders of UGT1A1
Firstly, we created initial RF and Support Vector Machine (SVM) models using only MOE descriptors without parameter optimization. These preliminary RF and SVM models showed unsatisfactory performance (shown in Tables S3 and S4), in particular in terms of sensitivity (between 50 and 67% on the cross-validation (CV). Taking into account that our non-inhibitor molecules are decoys, the sensitivity performance is the most reliable assessment evaluation. Because of the strong imbalance in our dataset between the number of active molecules and decoys, the optimization of hyper parameters (see Figure 3S and method details), including sample size and weight for RF and SVM, respectively, is critical to build robust predictive models.
Next, we built RF and SVM models: (1) with the 168 descriptors, including 6 IEs; (2) with the best 62 descriptors, including 6 IEs, by optimizing the hyper parameters (see in method details and Figure S3 and Table S1). Cross-validation was applied for the RF and SVM modeling. The performances of the best RF and SVM models created and applied on the training and external validation test sets are summarized in Tables 1 and 2, respectively. The area under the receiver operating characteristic curve (AUC), balanced accuracy (BA), sensitivity, specificity and Matthew’s correlation coefficient were calculated. The AUC and BA values showed that all the RF and SVM models have excellent predictive powers for the discrimination of the UGT1A1 active molecules. The RF model with ‘56 MOE +6 IE’ descriptors showed better sensitivity on the cross-validation compared to the sensitivity of the ‘162 MOE +6 IE’ model.
Table 1.
Performances of the optimized RF models with MOE and IE descriptors on the training set (cross-validation CV) and the external validation test set
| Descriptors | Dataset | AUC % | BA % | Sensitivity % | Specificity % | MCC % |
|---|---|---|---|---|---|---|
| 56 MOE + 6 IE | Internal CV | 91.2 | 91.3 | 91.1 | 91.4 | 74.5 |
| External | 93.7 | 93.7 | 92.6 | 94.8 | 81.8 | |
| 162 MOE + 6 IE | Internal CV | 90.6 | 90.2 | 88.0 | 92.4 | 74.1 |
| External | 94.4 | 94.4 | 92.6 | 96.3 | 85.3 |
Table 2.
Performances of the optimized SVM models with MOE and IE descriptors on the training set (cross-validation CV) and the external validation test set
| Descriptors | Dataset | AUC % | BA % | Sensitivity % | Specificity % | MCC % |
|---|---|---|---|---|---|---|
| 56 MOE + 6 IE | Internal CV | 91.3 | 91.0 | 90.2 | 91.8 | 74.3 |
| External | 90.7 | 90.7 | 88.9 | 92.5 | 74.5 | |
| 162 MOE + 6 IE | Internal CV | 90.2 | 88.9 | 88.1 | 89.7 | 68.7 |
| External | 92.6 | 92.6 | 92.6 | 92.5 | 77.1 |
Similarly, the SVM models showed excellent performance, and the SVM model with ‘56 MOE +6 IE’ descriptors showed improved sensitivity and MCC on the cross-validation compared to those of the ‘162 MOE +6 IE’ model. Thus, our rational selection of the best 62 descriptors using the Gini index slightly improves the performance of the predictive models by diminishing the noise of the less discriminating descriptors; moreover, it also decreases the computational prediction time. The performance on the external test set was excellent, slightly better than the internal CV performance. Although the diversity was ensured between the molecules of the training and the external test sets with a maximal chemical similarity of 0.80, the better performance on the external dataset may be because of the random choice of the molecules for the external set. Some over-performances on external datasets have also been observed in other ML modeling studies (Goldwaser et al., 2022; Green et al., 2021).
Binding positions of UGT1A1 ligands
Various small and bulky compounds are known to be metabolized by UGT1A1. The predicted binding positions of three different substrates of UGT1A1 as docked into the MD47 structure are shown in Figure 7. Bilirubin was present in our training set. Quercetin and raloxifene, being in the external test sets, were successfully predicted to be binders of UGT1A1 by the two RF and the two SVM models, ‘56 MOE +6 IE’ and ‘162 MOE +6 IE’. The poses were selected based on the best predicted IEs among the six different UGT1A1 MD conformations. The top scored poses of quercetin (IE = −8.0 kcal/mol), raloxifene (IE = −10.2 kcal/mol), and bilirubin (IE = −10.0 kcal/mol) are shown in Figure 7. Of interest, the binding pose of quercetin corresponds to that of the crystal structure of quercetin bound to the plant flavonoid 3-O-glycosyltransferase VvGT1 (PDB: 2C9Z) (Offen et al., 2006). Based on the docking pose, we predicted that the binding of quercetin to UGT1A1 involves hydrogen bonds with H39 and S38, and aromatic interactions with F153, as in the crystal structure 2C9Z (H20, S18, F121). Similarly, raloxifene (its 6-O-glucuronidation site) (Guo et al., 2022) is in hydrogen bonding with H39 and S38 and in aromatic interactions with F153 in UGT1A1. In the predicted pose of bilirubin, the two carboxylic groups that should be metabolized are in hydrogen bonding with the cofactor sugar group and the catalytic H39, respectively. The (-CH2-)2 side chain of the first propionic group is in hydrophobic contact with F153. The second propionic group is in an intramolecular hydrogen bonding, as in the solution structure of bilirubin (Nogales and Lightner, 1995), and similarly to bilirubin bound to other proteins (e.g. see in thestructures PDB: 4I3D, 2VUE). V109 stabilizes the pyrrole group, and the two pyrroline cycles are stabilized by L175 and F181, and by P194 and F217, respectively. The docking pose of bilirubin suggests that it adopts a conformation similar to its structure in solution (Nogales and Lightner, 1995).
Figure 7.

Docking conformations of three substrates of UGT1A1 docked into MD47 (in cartoon, cofactor-binding domain in white, substrate-binding domain in cyan); UDPGA and key residues are shown in cyan sticks
(A) The top scored pose of quercetin is shown in salmon sticks. UDP and quercetin of the PDB structure of the homologous plant flavonoid 3-O-glycosyltransferase (PDB: 2C9Z) are shown in yellow sticks.
(B) The top scored pose of raloxifene (in salmon sticks).
(C) The top scored pose of bilirubin (in salmon sticks).
To further investigate the predicted binding modes of raloxifene, bilirubin, and quercetin, additional 50-ns long MD simulations were performed starting from the docking complexes shown in Figure 7. In the case of raloxifene, its 6-O-glucuronidation site remained in close contact with the catalytic S38, its benzothiophene part maintained a stable contact with F153 whereas its piperidine tail displayed more flexibility. At the beginning of the dynamics the piperidine tail of raloxifene tightly covered the cofactor whereas with time, it lifted slightly in direction of a sub-pocket of Q107, P194, F181 and F217 (see Figure S4A). Bilirubin also remained in the vicinity of F153 throughout the simulation maintaining their hydrophobic contacts. One of the carboxylic groups kept its orientation toward the sugar ring of the cofactor even though their distance slightly increased. Bilirubin also showed a similar movement toward this sub-pocket being in contacts with F181 and F217. Of interest, the above discussed configuration of bilirubin within the substrate-binding pocket, similar to what was observed in solution and bound to other proteins, was preserved throughout the entire simulation despite the large flexibility capability of bilirubin (see Figure S4B). Quercetin stayed in a stable position during the first 15 ns, primarily stabilized by the aromatic interactions with F153, after which it started shifting into the same sub-pocket of F181 and F217, distancing itself from the catalytic site (see Figure S4C).
Conclusions
In this study, we integrated structure-based modeling and machine learning techniques to build the first prediction models of UGT1A1 inhibition. We performed molecular dynamics simulations of the enzyme in the presence of the cofactor to gain insight into the structural variability of the catalytic site. We observed large conformational variability, which is crucial for accommodating the diverse substrates and inhibitors. RMSD-based clustering of the MD trajectories enabled us to extract a set of diverse enzyme conformations. Ensemble docking of experimentally validated active compounds and decoys identified 6 enzyme conformations that can efficiently differentiate between active and non-active compounds. We found that although loop regions in the substrate-binding cavity exhibit large flexibility, the catalytically essential residues maintain their relative positions among the identified conformations. The docking of quercetin suggested that its catalytic pose within the substrate-binding pocket matches that experimentally found for the plant flavonoid 3-O-glycosyltransferase VvGT1 but quercetin moved a lot during the MD simulations. Bilirubin was stabilized by a hydrogen bond of one of its carboxylic groups that should be metabolized with the cofactor sugar group and hydrophobic contacts with F153. We found that the contacts of the glucuronidation site of raloxifene with the catalytic residue S38, as well as its hydrophobic contacts with F153, remained stable during the simulations. The MD simulations with bound substrates suggested an additional sub-pocket in the area of F181 and F217 that could also be important for the wide substrate recognition and binding. Finally, we created ML models using RF and SVM techniques, integrating a rational selection of ligand-based descriptors together with information on the enzyme-ligand interactions. The excellent performance of around 90% accuracy and sensitivity obtained with the selected 56 MOE and 6 IE descriptors suggests that our models can be employed to identify new UGT1A1 inhibitors. To the best of our knowledge, the ML models reported here are the first for predicting UGT inhibition. They can be helpful for further prediction of drug-drug interactions of new drug candidates and safety treatments while also providing structural information on the enzyme-ligand interactions.
Limitations of the study
Our predictive models were developed based on a homology model of the human UGT1A1 structure containing the cofactor- and the substrate-binding domains. A future X-ray structure of the human UGT1A1 containing the two domains would be helpful to improve the performance of the models for the prediction of UGT1A1 inhibitors.
STAR★Methods
Key resources table
| REAGENT or RESOURCE | SOURCE | IDENTIFIER |
|---|---|---|
| Deposited data | ||
| ChEMBL database | ChEMBL Database - EMBL-EBI | https://www.ebi.ac.uk |
| DrugBank database | OMx Personal Health Analytic | https://go.drugbank.com |
| PubChem database | National Center for Biotechnology Information | https://pubchem.ncbi.nlm.nih.gov |
| Maybridge® HitFinder™ chemical library | ThermoFisher Sci. | http://www.maybridge.com |
| Software and algorithms | ||
| CHARMM | Chemistry at HARvard Macromolecular Mechanics | https://www.charmm.org |
| CHARMM-GUI | Lehigh University | https://www.charmm-gui.org/ |
| NAMD | Scalable Molecular Dynamics, University of Illinois | https://www.ks.uiuc.edu/Research/namd/ |
| VMD v.1.3.9 | Visual Molecular Dynamics, University of Illinois | http://www.ks.uiuc.edu |
| PropKa On-line | Alessandro Pedretti & Giulio Vistoli | https://www.ddl.unimi.it |
| AutoDockTools v.1.5.6 | The Scripps Research Institute, CCSB | https://autodock.scripps.edu/ |
| AutoDock Vina 1.1.2 | The Scripps Research Institute, CCSB | https://vina.scripps.edu/ |
| Pipeline Pilot - BIOVIA - Dassault Systèmes®, v.20.1 | Discngine | https://www.3ds.com › |
| CORINA Classic v.4.3 | Molecular Networks | www.mn-am.com |
| MOE | Chemical Computing Group | https://www.chemcomp.com/ |
| FAF-Drugs4 server | RPBS platform | https://fafdrugs4.rpbs.univ-paris-diderot.fr/ |
| R software v.3.5 | The R Project for Statistical Computing | https://www.r-project.org |
Resource availability
Lead contact
Further information and requests for resources should be directed to and will be fulfilled by the lead contact, Maria A. Miteva (maria.mitev@inserm.fr).
Materials availability
This study did not generate new materials.
Method details
Protein structure preparation
The homology model of Locuson et al. (Locuson and Tracy, 2007) of the human UGT1A1 bound to the cofactor UDPGA was used as starting structure. UDPGA parameters were determined using CHARMM General Force Field (CGenFF) 2.5 (Vanommeslaeghe et al., 2010). The pKa values of the protein titratable groups were calculated with PROPKA (Sondergaard et al., 2011), and the protonation states were assigned at pH 7.0. The structure was solvated by CHARMM-GUI (Jo et al., 2008; Lee et al., 2016), and placed in a rectangular water box of TIP3 water molecules extending 15 Å in all directions from the protein surface (120 Å × 120 Å x 120 Å); the NaCl concentration was set to 0.15 M. The system was energy minimized using the steepest descent (SD) algorithm with harmonic restraints applied to the heavy atoms decreasing every 100 steps and adapting the values 50, 10, 1, and 0.1 kcal/mol/Å2. Further minimization was performed without harmonic restraints in the form of successive cycles of SD and Adopted Basis Newton-Raphson (ABNR) minimizations until an RMS energy gradient tolerance of 0.01 kcal/mol/Å was met. Energy minimization was performed with CHARMM using the additive all-atom CHARMM force field C36m (Huang and MacKerell, 2013).
Molecular dynamics simulations
The system was equilibrated at 300 K for 100 ps in an NVT, then for 5 ns in an NpT ensemble at 1 atm pressure. Equilibration was performed with NAMD (Phillips et al., 2020) with the same force field, C36m. Langevin dynamics was used with a damping coefficient of 1 ps−1 for the constant temperature control. The Nose-Hoover method was used for the constant pressure control, with a piston oscillation period of 50 ps and a piston oscillation decay of 25 fs. The integration time step was 1 fs. The dielectric constant was set to 1 for energy evaluation. The particle mesh Ewald (PME) method was used to calculate electrostatic interactions with a grid spacing of 1 Å or less, having the order of 6. The real space summation was truncated at 12.0 Å, and the width of the Gaussian distribution was set to 0.34 Å-1. Van der Waals interactions were reduced to zero by ‘switch’ truncation operating between 10.0 and 12.0 Å.
MD production runs were performed with NAMD. Three parallel 100-ns long MD simulations were run for the cofactor-bound UGT1A1 starting from the equilibrated conformation, with different random initial velocity distributions according to the Maxwell-Boltzmann distribution at 300 K. The integration time step was 2 fs; other parameters were identical to the 5 ns NpT equilibration run. The coordinates were saved every 5 ps, generating a total of 60 000 conformations.
Additional 50-ns long MD simulations were performed of the cofactor-bound UGT1A1 in the presence of different substrates, bilirubin, quercetin, and raloxifene, starting from the complexes retrieved from the docking simulations. The parameters of the substrates were determined by CGenFF 2.5. The same MD protocol was then applied as detailed above for the cofactor-bound UGT1A1 without bound substrate.
Clustering of the protein conformations
The Quality Threshold (QT) algorithm (Heyer et al., 1999), as implemented in VMD (Humphrey et al., 1996), was used to perform conformational clustering of the MD generated conformations. A distance function defined as the RMSD difference, calculated for the heavy atoms of the substrate-binding pocket, was used for clustering with a minimal distance of 1.5 Å. The centroid conformations of the 57 most populated clusters (numbered by the rank of population, i.e. the most populated cluster has the centroid conformation called MD1) covering 90 % of all the generated conformations were used in the subsequent docking simulations.
Dataset preparation
We collected 113 known ligands of UGT1A1, inhibitors and substrates, from the ChEMBL (ebi.ac.uk/chembl), DrugBank (go.drugbank.com), and PubChem (pubchem.ncbi.nlm.nih.gov) databases. Substrates were also included as they could cause concentration-dependent enzyme inhibition, a commonly observed phenomenon for metabolic enzymes (Wu, 2011). Among the collected 113 actives, 10 compounds had activity between 20 μM and 50 μM, and only 4 compounds had activity above 50 μM. To increase the applicability domain of our models, we thus decided to retain the compounds with activity below 50 μM (IC50). The four compounds showing very low activity (>50 μM) were not included into the dataset. Decoys (putatively inactive molecules) for docking and ML model validation were taken from the diverse chemical compound collection Maybridge® HitFinder™ (maybridge.com), prepared as detailed in (Martiny et al., 2013). In order to build predictive models with applicability that covers drug-like molecules while maintaining chemical diversity, for all actives and decoys, we performed: i) filtering using the FAF-Drugs4 server (Lagorce et al., 2017) and an in-house developed ‘soft’ drug-like filter (molecular weight ≤1000 Da, number of H-bond donors ≤8, number of H-bond acceptors ≤12, number of rotatable bonds ≤20, logP between −7 and 10, and number of heteroatoms ≤15) without removing toxic/reactive/PAINS (Pan Assay Interference) compounds; ii) diversity clustering using FCFP_4 with a Tanimoto similarity criterion of 0.8 as implemented in Pipeline Pilot v.20.1 (BIOVIA Pipeline Pilot, Release, 2020, v.20.1). The 3D structures of the compounds were generated using CORINA Classic v.4.3 (CORINA Classic, Release, 2019, v.4.3), and the compounds were protonated at pH 7.0 using the FAF-Drugs4 server.
Ensemble docking
We performed docking simulations of the final dataset compounds into the centroid protein conformations of the 57 most populated clusters using the software AutoDock Vina 1.1.2 (Trott and Olson, 2010), which employs gradient-based conformational docking and an empirical scoring function predicting protein-ligand interaction energy (IE, in kcal/mol). The protein conformations and the ligands were pre-processed with AutoDockTools (Morris et al., 2009), the solvent molecules were removed, non-polar hydrogens were merged, and Gasteiger charges were assigned. A grid box of 24 Å × 20 Å x 22 Å was used with 1 Å spacing in the substrate-binding cavity. The maximum number of binding modes was set to 10, and the exhaustiveness of the global search to 8. The protein was kept rigid while the ligands were handled flexibly.
Machine learning classification modeling
Random forest (RF) classification (Breiman, 2001) was performed using the Random Forest R library (Liaw and Wiener, 2002) of the statistical software package R. Multiple decision trees were built with bootstrap samples from the training data. A small subset of descriptors was randomly selected to make decisions at each tree node to introduce diversity between the trees of the RF. The classification was obtained by taking the results of all the trees through a majority vote. To find the optimal size of the forest, ‘ntree’ (number of trees), and the optimal number of descriptors, ’mtry’ (number of selected descriptors), for each model, we ran RF calculations performing an exhaustive nested-loop search of the ntree (128–1024) and mtry (5–50) parameters. As the dataset is imbalanced, the parameter ’sampsize’ (numbers of actives and decoys) was also optimized. We selected the combinations of ntree, mtry, and sampsize parameters for each model that yielded the best internal balanced accuracy (BA) while retaining the lowest acceptable ntree (see Table S1 and Figure S3). Five-fold cross-validation (CV) procedure was repeated ten times.
Support vector machine (SVM) approaches are based on the minimization principle from statistical learning theory and place data into hyperspaces through different kernel functions for its separation into datasets for classification or regression modeling (Cortes and Vapnik, 1995). For the nonlinearly separable cases, the kernel function allows SVM to transfer the data points into a higher-dimensional space where linear separation is possible. To build classification models, we also used the SVM algorithms implemented in the R package with the Caret library (Kuhn, 2008). The descriptors were centered around a mean of 0 and scaled to have a variance of 1. The radial basis function kernel (SVM-Rad) was used. The ‘cost’ parameter was optimized in the range of 20 to 218 through a five-fold cross-validation procedure that was repeated ten times. The best combinations of the hyperparameter cost, scaling function gamma (optimized in the range of 2-14 to 20), and ‘weight’ are shown in Table S1 and Figure S3).
Assessment of the quality of the models
Different statistical quantities were evaluated to assess the predictive ability of the models. Sensitivity, or the true positive rate, is the fraction of true positives among all positively classified instances (Equation 1), specificity is the true negative rate (Equation 2), and balanced accuracy (BA) is an overall performance estimator used in the case of imbalanced datasets (Equation 3). The area under the receiver operating characteristic curve (AUC) was also calculated. The AUC ranges from 0 to 1. Values of 0.8 or greater generally indicate good to excellent performance of a predictive model. The Matthew’s correlation coefficient (MCC, Equation 4) was calculated to measure the quality of binary classifications according to the following formulas:
| (Equation 1) |
| (Equation 2) |
| (Equation 3) |
| (Equation 4) |
where TP and TN are the true positive and true negative, and FP and FN the false positive and false negative instances, respectively.
Acknowledgments
The authors thank Université Paris Cité, Inserm Instute, Ecole Normale Supérieure Paris-Saclay and the French ANR agency (grant MetABC) for supporting this research. We thank S. Timouma for helpful discussion.
Author contributions
All authors contributed to the study conception and design. Material preparation and data collection were performed by B.D. and Y.B. All authors contributed to the analysis. The first draft of the manuscript was written by B.D. and Y.B. All authors read and approved the final manuscript.
Declaration of interests
The authors declare no competing interests.
Published: November 18, 2022
Footnotes
Supplemental information can be found online at https://doi.org/10.1016/j.isci.2022.105290.
Supplemental information
Data and code availability
-
•
This article includes all data generated or analyzed during this study.
-
•
This article does not report original code.
-
•
Any additional information required to reanalyze the data reported in this paper is available from the lead contact upon request.
References
- Almazroo O.A., Miah M.K., Venkataramanan R. Drug metabolism in the liver. Clin. Liver Dis. 2017;21:1–20. doi: 10.1016/j.cld.2016.08.001. [DOI] [PubMed] [Google Scholar]
- Bauer T.M., Ritz R., Haberthür C., Ha H.R., Hunkeler W., Sleight A.J., Scollo-Lavizzari G., Haefeli W.E. Prolonged sedation due to accumulation of conjugated metabolites of midazolam. Lancet. 1995;346:145–147. doi: 10.1016/s0140-6736(95)91209-6. [DOI] [PubMed] [Google Scholar]
- BIOVIA Pipeline Pilot, Release2020, v.20.1.
- Bosma P.J. Inherited disorders of bilirubin metabolism. J. Hepatol. 2003;38:107–117. doi: 10.1016/s0168-8278(02)00359-8. [DOI] [PubMed] [Google Scholar]
- Breiman L. Random forests. Mach. Learn. 2001;45:5–32. doi: 10.1023/a:1010933404324. [DOI] [Google Scholar]
- Cai Y., Yang H., Li W., Liu G., Lee P.W., Tang Y. Computational prediction of site of metabolism for UGT-catalyzed reactions. J. Chem. Inf. Model. 2019;59:1085–1095. doi: 10.1021/acs.jcim.8b00851. [DOI] [PubMed] [Google Scholar]
- Carracedo-Reboredo P., Liñares-Blanco J., Rodríguez-Fernández N., Cedrón F., Novoa F.J., Carballal A., Maojo V., Pazos A., Fernandez-Lozano C. A review on machine learning approaches and trends in drug discovery. Comput. Struct. Biotechnol. J. 2021;19:4538–4558. doi: 10.1016/j.csbj.2021.08.011. [DOI] [PMC free article] [PubMed] [Google Scholar]
- CORINA Classic, Release (2019). v.4.3 (Molecular Networks GmbH and Altamira, LLC).
- Cortes C., Vapnik V. Support-vector networks. Mach. Learn. 1995;20:273–297. doi: 10.1023/a:1022627411411. [DOI] [Google Scholar]
- Court M.H. Isoform-selective probe substrates for in vitro studies of human UDP-glucuronosyltransferases. Methods Enzymol. 2005;400:104–116. doi: 10.1016/S0076-6879(05)00007-8. [DOI] [PubMed] [Google Scholar]
- Goldwaser E., Laurent C., Lagarde N., Fabrega S., Nay L., Villoutreix B.O., Jelsch C., Nicot A.B., Loriot M.A., Miteva M.A. Machine learning-driven identification of drugs inhibiting cytochrome P450 2C9. PLoS Comput. Biol. 2022;18:e1009820. doi: 10.1371/journal.pcbi.1009820. [DOI] [PMC free article] [PubMed] [Google Scholar]
- Goon C.P., Wang L.Z., Wong F.C., Thuya W.L., Ho P.C.L., Goh B.C. UGT1A1 mediated drug interactions and its clinical relevance. Curr. Drug Metab. 2016;17:100–106. doi: 10.2174/1389200216666151103121253. [DOI] [PubMed] [Google Scholar]
- Grant D.M. Detoxification pathways in the liver. J. Inherit. Metab. Dis. 1991;14:421–430. doi: 10.1007/BF01797915. [DOI] [PubMed] [Google Scholar]
- Green A.J., Mohlenkamp M.J., Das J., Chaudhari M., Truong L., Tanguay R.L., Reif D.M. Leveraging high-throughput screening data, deep neural networks, and conditional generative adversarial networks to advance predictive toxicology. PLoS Comput. Biol. 2021;17:e1009135. doi: 10.1371/journal.pcbi.1009135. [DOI] [PMC free article] [PubMed] [Google Scholar]
- Guo Y., Shah A., Oh E., Chowdhury S.K., Zhu X. Determination of acyl-O-and N-glucuronide using chemical derivatization coupled with liquid chromatography-high-resolution mass spectrometry. Drug Metab. Dispos. 2022;50:716–724. doi: 10.1124/dmd.122.000832. [DOI] [PubMed] [Google Scholar]
- Heyer L.J., Kruglyak S., Yooseph S. Exploring expression data: identification and analysis of coexpressed genes. Genome Res. 1999;9:1106–1115. doi: 10.1101/gr.9.11.1106. [DOI] [PMC free article] [PubMed] [Google Scholar]
- Huang J., MacKerell A.D., Jr. CHARMM36 all-atom additive protein force field: validation based on comparison to NMR data. J. Comput. Chem. 2013;34:2135–2145. doi: 10.1002/jcc.23354. [DOI] [PMC free article] [PubMed] [Google Scholar]
- Humphrey W., Dalke A., Schulten K. VMD: visual molecular dynamics. J. Mol. Graph. 1996;14:33–38. doi: 10.1016/0263-7855(96)00018-5. [DOI] [PubMed] [Google Scholar]
- Hwang S., Shin H.K., Shin S.E., Seo M., Jeon H.N., Yim D.E., Kim D.H., No K.T. PreMetabo: an in silico phase I and II drug metabolism prediction platform. Drug Metab. Pharmacokinet. 2020;35:361–367. doi: 10.1016/j.dmpk.2020.05.007. [DOI] [PubMed] [Google Scholar]
- Jo S., Kim T., Iyer V.G., Im W. CHARMM-GUI: a web-based graphical user interface for CHARMM. J. Comput. Chem. 2008;29:1859–1865. doi: 10.1002/jcc.20945. [DOI] [PubMed] [Google Scholar]
- Kaivosaari S., Finel M., Koskinen M. N-glucuronidation of drugs and other xenobiotics by human and animal UDP-glucuronosyltransferases. Xenobiotica. 2011;41:652–669. doi: 10.3109/00498254.2011.563327. [DOI] [PubMed] [Google Scholar]
- Kantardzic M. Wiley-IEEE Press; 2019. Data Mining: Concepts, Models, Methods, and Algorithms. [Google Scholar]
- Kato H. Computational prediction of cytochrome P450 inhibition and induction. Drug Metab. Pharmacokinet. 2020;35:30–44. doi: 10.1016/j.dmpk.2019.11.006. [DOI] [PubMed] [Google Scholar]
- Kuhn M. Building predictive models inRUsing thecaretPackage. J. Stat. Softw. 2008;28 doi: 10.18637/jss.v028.i05. [DOI] [Google Scholar]
- Laakkonen L., Finel M. A molecular model of the human UDP-glucuronosyltransferase 1A1, its membrane orientation, and the interactions between different parts of the enzyme. Mol. Pharmacol. 2010;77:931–939. doi: 10.1124/mol.109.063289. [DOI] [PubMed] [Google Scholar]
- Lagorce D., Bouslama L., Becot J., Miteva M.A., Villoutreix B.O. FAF-Drugs4: free ADME-tox filtering computations for chemical biology and early stages drug discovery. Bioinformatics. 2017;33:3658–3660. doi: 10.1093/bioinformatics/btx491. [DOI] [PubMed] [Google Scholar]
- Lee J., Cheng X., Swails J.M., Yeom M.S., Eastman P.K., Lemkul J.A., Wei S., Buckner J., Jeong J.C., Qi Y., et al. CHARMM-GUI input generator for NAMD, GROMACS, AMBER, OpenMM, and CHARMM/OpenMM simulations using the CHARMM36 additive force field. J. Chem. Theory Comput. 2016;12:405–413. doi: 10.1021/acs.jctc.5b00935. [DOI] [PMC free article] [PubMed] [Google Scholar]
- Li C., Wu Q. Adaptive evolution of multiple-variable exons and structural diversity of drug-metabolizing enzymes. BMC Evol. Biol. 2007;7:69. doi: 10.1186/1471-2148-7-69. [DOI] [PMC free article] [PubMed] [Google Scholar]
- Li J., Olaleye O.E., Yu X., Jia W., Yang J., Lu C., Liu S., Yu J., Duan X., Wang Y., et al. High degree of pharmacokinetic compatibility exists between the five-herb medicine XueBiJing and antibiotics comedicated in sepsis care. Acta Pharm. Sin. B. 2019;9:1035–1049. doi: 10.1016/j.apsb.2019.06.003. [DOI] [PMC free article] [PubMed] [Google Scholar]
- Liaw A., Wiener M. Classification and regression by randomForest. R. News. 2002;2:18–22. [Google Scholar]
- Liu X.Y., Lv X., Wang P., Ai C.Z., Zhou Q.H., Finel M., Fan B., Cao Y.F., Tang H., Ge G.B. Inhibition of UGT1A1 by natural and synthetic flavonoids. Int. J. Biol. Macromol. 2019;126:653–661. doi: 10.1016/j.ijbiomac.2018.12.171. [DOI] [PubMed] [Google Scholar]
- Locuson C.W., Tracy T.S. Comparative modelling of the human UDP-glucuronosyltransferases: insights into structure and mechanism. Xenobiotica. 2007;37:155–168. doi: 10.1080/00498250601129109. [DOI] [PubMed] [Google Scholar]
- Lv X., Xia Y., Finel M., Wu J., Ge G., Yang L. Recent progress and challenges in screening and characterization of UGT1A1 inhibitors. Acta Pharm. Sin. B. 2019;9:258–278. doi: 10.1016/j.apsb.2018.09.005. [DOI] [PMC free article] [PubMed] [Google Scholar]
- Mao J., Akhtar J., Zhang X., Sun L., Guan S., Li X., Chen G., Liu J., Jeon H.N., Kim M.S., et al. Comprehensive strategies of machine-learning-based quantitative structure-activity relationship models. iScience. 2021;24:103052. doi: 10.1016/j.isci.2021.103052. [DOI] [PMC free article] [PubMed] [Google Scholar]
- Martiny V.Y., Carbonell P., Chevillard F., Moroy G., Nicot A.B., Vayer P., Villoutreix B.O., Miteva M.A. Integrated structure- and ligand-based in silico approach to predict inhibition of cytochrome P450 2D6. Bioinformatics. 2015;31:3930–3937. doi: 10.1093/bioinformatics/btv486. [DOI] [PubMed] [Google Scholar]
- Martiny V.Y., Carbonell P., Lagorce D., Villoutreix B.O., Moroy G., Miteva M.A. In silico mechanistic profiling to probe small molecule binding to sulfotransferases. PLoS One. 2013;8:e73587. doi: 10.1371/journal.pone.0073587. [DOI] [PMC free article] [PubMed] [Google Scholar]
- Meech R., Mackenzie P.I. Structure and function of uridine diphosphate glucuronosyltransferases. Clin. Exp. Pharmacol. Physiol. 1997;24:907–915. doi: 10.1111/j.1440-1681.1997.tb02718.x. [DOI] [PubMed] [Google Scholar]
- Miley M.J., Zielinska A.K., Keenan J.E., Bratton S.M., Radominska-Pandya A., Redinbo M.R. Crystal structure of the cofactor-binding domain of the human phase II drug-metabolism enzyme UDP-glucuronosyltransferase 2B7. J. Mol. Biol. 2007;369:498–511. doi: 10.1016/j.jmb.2007.03.066. [DOI] [PMC free article] [PubMed] [Google Scholar]
- Miners J.O., Mackenzie P.I. Drug glucuronidation in humans. Pharmacol. Ther. 1991;51:347–369. doi: 10.1016/0163-7258(91)90065-t. [DOI] [PubMed] [Google Scholar]
- Molecular Operating Environment (MOE), Release (2016). Chemical Computing Group Inc., 1010 Sherbooke St. West, Montreal, QC, Canada, H3A 2R7.
- Morris G.M., Huey R., Lindstrom W., Sanner M.F., Belew R.K., Goodsell D.S., Olson A.J. AutoDock4 and AutoDockTools4: automated docking with selective receptor flexibility. J. Comput. Chem. 2009;30:2785–2791. doi: 10.1002/jcc.21256. [DOI] [PMC free article] [PubMed] [Google Scholar]
- Nogales D., Lightner D.A. On the structure of bilirubin in solution. 13C[1H] heteronuclear Overhauser effect NMR analyses in aqueous buffer and organic solvents. J. Biol. Chem. 1995;270:73–77. doi: 10.1074/jbc.270.1.73. [DOI] [PubMed] [Google Scholar]
- Oda S., Fukami T., Yokoi T., Nakajima M. A comprehensive review of UDP-glucuronosyltransferase and esterases for drug development. Drug Metab. Pharmacokinet. 2015;30:30–51. doi: 10.1016/j.dmpk.2014.12.001. [DOI] [PubMed] [Google Scholar]
- Offen W., Martinez-Fleites C., Yang M., Kiat-Lim E., Davis B.G., Tarling C.A., Ford C.M., Bowles D.J., Davies G.J. Structure of a flavonoid glucosyltransferase reveals the basis for plant natural product modification. EMBO J. 2006;25:1396–1405. doi: 10.1038/sj.emboj.7600970. [DOI] [PMC free article] [PubMed] [Google Scholar]
- Ohno S., Nakajin S. Determination of mRNA expression of human UDP-glucuronosyltransferases and application for localization in various human tissues by real-time reverse transcriptase-polymerase chain reaction. Drug Metab. Dispos. 2009;37:32–40. doi: 10.1124/dmd.108.023598. [DOI] [PubMed] [Google Scholar]
- Osborne R., Thompson P., Joel S., Trew D., Patel N., Slevin M. The analgesic activity of morphine-6-glucuronide. Br. J. Clin. Pharmacol. 1992;34:130–138. doi: 10.1111/j.1365-2125.1992.tb04121.x. [DOI] [PMC free article] [PubMed] [Google Scholar]
- Patana A.S., Kurkela M., Finel M., Goldman A. Mutation analysis in UGT1A9 suggests a relationship between substrate and catalytic residues in UDP-glucuronosyltransferases. Protein Eng. Des. Sel. 2008;21:537–543. doi: 10.1093/protein/gzn030. [DOI] [PubMed] [Google Scholar]
- Peng J., Lu J., Shen Q., Zheng M., Luo X., Zhu W., Jiang H., Chen K. In silico site of metabolism prediction for human UGT-catalyzed reactions. Bioinformatics. 2014;30:398–405. doi: 10.1093/bioinformatics/btt681. [DOI] [PubMed] [Google Scholar]
- Phillips J.C., Hardy D.J., Maia J.D.C., Stone J.E., Ribeiro J.V., Bernardi R.C., Buch R., Fiorin G., Hénin J., Jiang W., et al. Scalable molecular dynamics on CPU and GPU architectures with NAMD. J. Chem. Phys. 2020;153:044130. doi: 10.1063/5.0014475. [DOI] [PMC free article] [PubMed] [Google Scholar]
- Prueksaritanont T., Chu X., Gibson C., Cui D., Yee K.L., Ballard J., Cabalu T., Hochman J. Drug-drug interaction studies: regulatory guidance and an industry perspective. AAPS J. 2013;15:629–645. doi: 10.1208/s12248-013-9470-x. [DOI] [PMC free article] [PubMed] [Google Scholar]
- Ritter J.K., Chen F., Sheen Y.Y., Tran H.M., Kimura S., Yeatman M.T., Owens I.S. A novel complex locus UGT1 encodes human bilirubin, phenol, and other UDP-glucuronosyltransferase isozymes with identical carboxyl termini. J. Biol. Chem. 1992;267:3257–3261. [PubMed] [Google Scholar]
- Rowland A., Miners J.O., Mackenzie P.I. The UDP-glucuronosyltransferases: their role in drug metabolism and detoxification. Int. J. Biochem. Cell Biol. 2013;45:1121–1132. doi: 10.1016/j.biocel.2013.02.019. [DOI] [PubMed] [Google Scholar]
- Shimada T. Xenobiotic-metabolizing enzymes involved in activation and detoxification of carcinogenic polycyclic aromatic hydrocarbons. Drug Metab. Pharmacokinet. 2006;21:257–276. doi: 10.2133/dmpk.21.257. [DOI] [PubMed] [Google Scholar]
- Søndergaard C.R., Olsson M.H.M., Rostkowski M., Jensen J.H. Improved treatment of ligands and coupling effects in empirical calculation and rationalization of pKa values. J. Chem. Theory Comput. 2011;7:2284–2295. doi: 10.1021/ct200133y. [DOI] [PubMed] [Google Scholar]
- Sorich M.J., McKinnon R.A., Miners J.O., Winkler D.A., Smith P.A. Rapid prediction of chemical metabolism by human UDP-glucuronosyltransferase isoforms using quantum chemical descriptors derived with the electronegativity equalization method. J. Med. Chem. 2004;47:5311–5317. doi: 10.1021/jm0495529. [DOI] [PubMed] [Google Scholar]
- Sorich M.J., Smith P.A., Miners J.O., Mackenzie P.I., McKinnon R.A. Recent advances in the in silico modelling of UDP glucuronosyltransferase substrates. Curr. Drug Metab. 2008;9:60–69. doi: 10.2174/138920008783331167. [DOI] [PubMed] [Google Scholar]
- Steventon G. Uridine diphosphate glucuronosyltransferase 1A1. Xenobiotica. 2020;50:64–76. doi: 10.1080/00498254.2019.1617910. [DOI] [PubMed] [Google Scholar]
- Testa B., Pedretti A., Vistoli G. Reactions and enzymes in the metabolism of drugs and other xenobiotics. Drug Discov. Today. 2012;17:549–560. doi: 10.1016/j.drudis.2012.01.017. [DOI] [PubMed] [Google Scholar]
- Trott O., Olson A.J. AutoDock Vina: improving the speed and accuracy of docking with a new scoring function, efficient optimization, and multithreading. J. Comput. Chem. 2010;31:455–461. doi: 10.1002/jcc.21334. [DOI] [PMC free article] [PubMed] [Google Scholar]
- Tukey R.H., Strassburg C.P. Human UDP-glucuronosyltransferases: metabolism, expression, and disease. Annu. Rev. Pharmacol. Toxicol. 2000;40:581–616. doi: 10.1146/annurev.pharmtox.40.1.581. [DOI] [PubMed] [Google Scholar]
- Vanommeslaeghe K., Hatcher E., Acharya C., Kundu S., Zhong S., Shim J., Darian E., Guvench O., Lopes P., Vorobyov I., Mackerell A.D., Jr. CHARMM general force field: a force field for drug-like molecules compatible with the CHARMM all-atom additive biological force fields. J. Comput. Chem. 2010;31:671–690. doi: 10.1002/jcc.21367. [DOI] [PMC free article] [PubMed] [Google Scholar]
- Williams J.A., Hyland R., Jones B.C., Smith D.A., Hurst S., Goosen T.C., Peterkin V., Koup J.R., Ball S.E. Drug-drug interactions for UDP-glucuronosyltransferase substrates: a pharmacokinetic explanation for typically observed low exposure (AUCi/AUC) ratios. Drug Metab. Dispos. 2004;32:1201–1208. doi: 10.1124/dmd.104.000794. [DOI] [PubMed] [Google Scholar]
- Wu B. Substrate inhibition kinetics in drug metabolism reactions. Drug Metab. Rev. 2011;43:440–456. doi: 10.3109/03602532.2011.615320. [DOI] [PubMed] [Google Scholar]
- Zhang L., Zhu L., Qu W., Wu F., Hu M., Xie W., Liu Z., Wang C. Insight into tartrate inhibition patterns in vitro and in vivo based on cocrystal structure with UDP-glucuronosyltransferase 2B15. Biochem. Pharmacol. 2020;172:113753. doi: 10.1016/j.bcp.2019.113753. [DOI] [PubMed] [Google Scholar]
Associated Data
This section collects any data citations, data availability statements, or supplementary materials included in this article.
Supplementary Materials
Data Availability Statement
-
•
This article includes all data generated or analyzed during this study.
-
•
This article does not report original code.
-
•
Any additional information required to reanalyze the data reported in this paper is available from the lead contact upon request.