

Abstract
Continuing to eat even when full leads to excessive calorie consumption and obesity. Thus, understanding brain responses to food cues when satiated has important implications for weight control interventions. We used the late positive potential (LPP, a component of the event-related potentials indexing motivational relevance) to determine the extent to which satiety affects brain responses to images of highly palatable foods (high-fat, high-sugar), high-and low-motivationally relevant (pleasant, unpleasant) and neutral stimuli in a sample of obese (body mass index [BMI] ≥30 kg/m2) and lean (BMI <25 kg/m2) individuals. Satiated individuals (N=55, 21 with BMI ≥30 kg/m2) were fed a nutritional drink prior to the experimental session and were individually matched with 55 unsatiated individuals who saw the same images during a passive viewing task. Satiety did not affect LPP response to food-related or motivationally relevant cues in either BMI <25 kg/m2 or BMI ≥30 kg/m2 individuals (p=.6). Irrespective of satiety, all participants showed larger LPPs as a function of the images’ motivational relevance. There were no differences in LPP amplitude between BMI <25 kg/m2 and BMI ≥30 kg/m2 individuals for any picture category, including food. However, within group comparisons showed that BMI <25 kg/m2 individuals had larger LPPs to low motivationally relevant pleasant images than to food-related cues (p<.001); this difference was not significant for BMI ≥30 kg/m2 individuals. Although satiety does not affect LPP responses to food-related cues, these results highlight the importance of evaluating reactivity to food-related cues in relation to other motivationally relevant stimuli.
Keywords: cue-reactivity, ERPs, incentive salience, satiety, reward, obesity, motivational relevance, food, brain
Neurobehavioral theories suggest that individuals with obesity (body mass index [BMI] ≥30 kg/m2) have difficulty moderating food intake because they attribute excessive incentive salience to food-related cues (Berridge et al., 2010; Hendrikse et al., 2015; Stice & Burger, 2019). Incentive salience refers to the motivational properties of a stimulus (Robinson & Berridge, 1993), and through Pavlovian associations, cues predicting rewards – including food – can acquire incentive salience (Berridge et al., 2010; Volkow et al., 2013). Stimuli with high levels of incentive salience (i.e., motivational relevance), capture attention, activate affective states, and motivate behaviors (Berridge et al., 2010; Johnson, 2013). Thus, cues associated with foods high in fat and sugar are hypothesized to hyperactivate the brain’s motivational systems, and as a result, trigger excessive food consumption in individuals with BMI ≥30 kg/m2 (Berthoud, 2004, 2012).
While enhanced reward responses to food-related cues are an implied characteristic of obesity, studies in humans have yielded inconsistent results (Field et al., 2016; Hendrikse et al., 2015; Nijs et al., 2008; Nijs & Franken, 2012). Using behavioral and neurophysiological measures it has been shown that for individuals with BMI ≥30 kg/m2, images of high‐calorie foods are more motivationally relevant than images of low-calorie foods and neutral objects (Appelhans et al., 2011; Carbine et al., 2017; Hall, 2012; Meule & Kübler, 2014). Yet, this does not necessarily mean that individuals with BMI ≥30 kg/m2 respond excessively to high-calorie foods (Versace & Schembre, 2015). Without an emotional “context” to compare responses to food cues, we cannot determine whether the magnitude of this response is abnormally high. In fact, when directly compared to non-food-related pleasant and unpleasant cues, food-related images evoke neuroaffective responses similar to those evoked by stimuli with moderate motivational relevance (e.g., romance, attack): larger than the responses evoked by neutral stimuli, but significantly smaller than those evoked by stimuli with high motivational relevance (e.g., erotica, mutilations) (Versace, Kypriotakis, Basen-Engquist, & Schembre, 2016).
Hunger also contributes to the level of motivational relevance that individuals attribute to food-related cues (Robinson & Berridge, 1993; Stice & Burger, 2019). Human electrophysiological data show that, irrespective of BMI (Stockburger et al., 2008, 2009; Nijs et al., 2008), individuals respond more strongly to food-related cues when in a fasting versus non-fasting state. Yet, observing higher reactivity to food-related cues when the subject is food deprived is hardly surprising: enhanced processing of food-related stimuli in a deprived state can be seen as an evolutionarily adaptive response in which food-related cues become more motivationally relevant to more effectively guide the organism towards food and restore depleted energy. More relevant to understanding the neurophysiological mechanisms underlying excessive eating is to study how satiety affects brain responses to food and food-related cues.
A recent meta-analysis of neuroimaging data suggests that the brains of individuals with BMI ≥30 kg/m2 are more sensitive to hunger than to satiety (Devoto et al., 2018). When assessing brain responses to food rewards, Gobbi et al. (2020) recently observed that satiety affects women with BMI ≥30 kg/m2 to a lesser degree than women with BMI <25 kg/m2. Researchers have hypothesized that an attentional bias toward food cues could potentially lead individuals with BMI ≥30 kg/m2 to continue consuming sugary foods because of difficulties in shifting attention away from food cues (Mason et al., 2019). In fact, individuals with BMI <25 kg/m2 show decreased activation to food cues after eating (LaBar et al., 2001), whereas food cues continue to elicit neural responses in individuals with BMI ≥30 kg/m2 after eating (Martin et al., 2010). An important caveat to the literature is that most of the studies evaluating the effects that satiety has on reactivity to cues in individuals with different BMI status included only comparisons between food-related and neutral cues. What remains unclear is the extent to which BMI ≥30 kg/m2 and BMI <25 kg/m2 individuals respond differently to food-related cues presented in the context of other motivationally relevant cues after eating, rather than fasting.
In this study, we fed participants a nutritional drink prior to an experimental session in which we recorded event-related potentials (ERPs, a direct measure of brain activity) to passively viewed images depicting highly palatable foods (i.e., high-fat, high-sugar), high- and low-motivationally relevant (pleasant, unpleasant) and neutral contents. Measuring reactivity to non-food-related motivationally relevant cues is necessary to accurately interpret reactivity to food-related cues and scale it within a broad motivational context (Oliver et al., 2016; Versace et al., 2017). To assess neuroaffective responses to the images, we analyzed the amplitude of the late positive potential (LPP), the most replicable and reliable electrophysiological index of motivational relevance (Lang & Bradley, 2010; Olofsson et al., 2008). The LPP usually reaches its highest amplitude over centro-parietal sensors between 400–800 ms post-stimulus onset (e.g., Cesarei & Codispoti, 2011; Cuthbert et al., 2000) and it is thought to reflect the engagement of cortico-limbic motivational systems (Keil et al., 2002; Liu et al., 2012; Schupp et al., 2006, p. 2006): both pleasant and unpleasant images increase the amplitude of the LPP as a function of their motivational relevance (Minnix et al., 2013; Schupp et al., 2000; Weinberg & Hajcak, 2010). The LPP is very suitable to study neuroaffective responses to visual stimuli because it is robust to manipulations affecting the images’ perceptual properties (e.g., size, spatial frequency, complexity, color; (Bradley et al., 2007; Cesarei & Codispoti, 2006, 2011; Codispoti et al., 2012) the images’ novelty (motivationally relevant images increase the LPP amplitude even when the same images are presented repeatedly (Bradley et al., 2006; Codispoti et al., 2007; Deweese et al., 2018; Ferrari et al., 2011, 2017; Mastria et al., 2017), and the images’ exposure time (motivationally relevant images increase the LPP amplitude at both brief (e.g., 25 ms) and sustained (e.g., 6 s) presentations (Codispoti et al., 2009).
To determine the extent to which satiety affects brain responses to visually presented cues, we matched satiated participants in this study to unsatiated participants from a nearly identical study (Versace et al., 2016) using age, gender, race, ethnicity, and BMI status. The decision to match participants from two separate studies, rather than randomizing participants to the two satiety conditions, was opportunistic: it allowed us to collect preliminary information about the effects that we could expect to observe in a similar paradigm and guide methodological choices before implementing a randomized trial.
We expected that the amplitude of the LPP would increase as a function of the images’ motivational relevance irrespective of BMI status. We expected satiety to differentially affect reactivity to food-related cues as a function of BMI status: individuals with BMI ≥30 kg/m2 would show higher LPP responses to food-related cues relative to individuals with BMI <25 kg/m2.
Method
Participants
Recruitment was limited to BMI <25 kg/m2 and BMI ≥30 kg/m2 individuals and excluded overweight individuals. We enrolled 58 participants (34 BMI <25 kg/m2, 24 BMI ≥30 kg/m2) from the Houston metropolitan area and the University of Texas MD Anderson Cancer Center employee network. Community participants were recruited via social media outlets and from newspaper advertisements. MD Anderson Cancer Center employees were recruited via postings on the institution’s Intranet site, flyers, and advertisements in the MD Anderson Conquest Magazine. Participants were eligible for the study if they were non-smokers between 21 and 55 years of age, were fluent in English, had access to a telephone and/or Internet, and were neither pregnant nor breastfeeding. Participants were excluded1 from the study if they reported the following: diagnosis of psychiatric disorder or major depression; use of marijuana, cocaine, heroin, or methamphetamine within the past 30 days; a history of seizures or a seizure disorder; diagnosis of an eating disorder; substantial weight changes (±5 kg) in the past 3 months; or current visual or auditory problems that would interfere with the completion of study assessments.
A total of 437 individuals were screened for eligibility via telephone interview or email questionnaire administered via REDCap (Research Electronic Data Capture) hosted at The University of Texas MD Anderson Cancer Center (Harris et al. 2009). In total, 359 individuals were excluded from the study for not meeting eligibility requirements, 19 individuals were eligible but were not enrolled in the study due to scheduling issues, and an additional 4 participants were excluded from the analysis due to poor recording quality during the experimental session (Figure 1). Thus, laboratory data from 34 BMI <25 kg/ m2 and 21 BMI ≥30 kg/ m2 participants were included in the final analyses, yielding a total of 55 participants.
Figure 1.

Diagram of participant recruitment and enrollment. Bold numbers indicate the total number of potential participants/participants in each category.
Unsatiated participants
A sample of unsatiated participants were selected from a previous study in which participants viewed a nearly identical picture-viewing task, however no food was provided to participants prior to the EEG recording session (Versace et al., 2016). The term “unsatiated” here refers only to the fact that no food was provided to participants prior to the EEG recording session; the subjects’ food intake was not restricted prior to the experimental session. Table 1 shows the self-reported satiety ratings for each group. The unsatiated participants reported being neither hungry nor full both at the beginning and at the end of the session. Inclusion criteria and recruitment procedures for unsatiated participants are described in detail in (Versace et al., 2016). Briefly, participants were included in the study if they were between the ages of 18 and 55 years, were fluent in English, and had access to a telephone. Recruitment was limited to BMI <25 kg/m2 and BMI ≥30 kg/ m2 individuals.
Table 1.
Participant characteristics by satiety status and BMI.
| Satiated | Unsatiated | |||
|---|---|---|---|---|
| BMI ≥30 kg/m2 N=21 |
BMI <25 kg/m2 N=34 |
BMI ≥30 kg/m2 N=21 |
BMI <25 kg/m2 N=34 |
|
| BMI (SD) | 35.6 (5.4) | 21.7 (1.8) | 36.4 (6.2) | 21.5 (1.3) |
| Age (SD) | 35.4 (9.8) | 29.6 (8.4) | 36.6 (9.8) | 30.5 (9.4) |
| Male (%) | 52 | 29 | 43 | 41 |
| Hispanic (%) | 19 | 21 | 19 | 29 |
| Race (%) | ||||
| Asian | 24 | 35 | 24 | 41 |
| Black/African American | 43 | 6 | 38 | 3 |
| White | 19 | 47 | 38 | 44 |
| More than one race | 0 | 3 | 0 | 6 |
| Prefer not to say | 14 | 9 | 0 | 6 |
| SLIM Pre EEG | 50 (28) | 51 (19) | 9 (41) | 2 (34) |
| SLIM Post EEG | 37 (35) | 30 (34) | 2 (38) | 1 (34) |
Means and standard deviations () are reported for all variables. Age is reported in years. SLIM = Satiety Labeled Intensity Magnitude scale; a score of 100 indicates greatest imaginable fullness while a score of −100 indicates greatest imaginable hunger.
Matching process
Unsatiated participants were individually matched to satiated participants based on age, gender, race, ethnicity, and BMI status. At the end of the matching process, there were no significant differences between the two samples regarding these variables. Participant characteristics for satiated BMI <25 kg/m2 and BMI ≥30 kg/m2 participants and their unsatiated matches are presented in Table 1. The composition of the BMI <25 kg/m2 and BMI ≥30 kg/m2 groups (collapsing across satiated and unsatiated individuals) was significantly different (X2 (4, N=110)=13.2017, p=.01), such that the BMI <25 kg/m2 group had fewer African-Americans (p=.007) and, on average, was 4 years younger (p=.02) than the BMI ≥30 kg/m2 sample. When age and race were accounted for as covariates in our analyses, the LPP results did not change. As such, we present results from the unadjusted analyses. Furthermore, in the online supplement, we present the results of another analysis in which we used the total sample in the unsatiated group (n=152) and, to control for potential confounds, used propensity scores to weight participants’ observation. The results of the analyses that used propensity scores closely replicated those presented below (see supplement).
Procedures
The study procedures were approved by The University of Texas MD Anderson Cancer Center Institutional Review Board and were performed in accordance with the Declaration of Helsinki. The study included an eligibility screening via either telephone interview or email questionnaire and one in-person laboratory visit. Information about age, height, weight, weight loss history, medical history, including history of diagnosed psychiatric disorders, eating disorders and diet-related chronic diseases, drug use and pregnancy or lactation status were collected during eligibility screening. Eligible participants were invited to attend an in-person visit, where a trained member of the staff explained the study procedures to the potential participants and collected written, informed consent. Once consent was obtained, BMI status was confirmed by measuring weight and height in light clothing, without shoes, and drug use and pregnancy status were verified via self-report. Participants then completed initial hunger and fullness ratings using a validated Satiety Labeled Intensity Magnitude scale (SLIM; Cardello, Schutz, Lesher, & Merrill, 2005), filled in questionnaires about mood (Ross & Mirowsky, 1984) and eating behavior (Schembre et al., 2009) and completed a paper and pencil version of the International Physical Activity Questionnaire (IPAQ; Craig et al., 2003). Subsequently, a Boost (N=28, BMI <25 kg/m2 , N=16 BMI ≥30 kg/m2) or Osmolite (N=6 BMI <25 kg/m2 , N=5 BMI ≥30 kg/m2) nutritional drink containing 25% of daily caloric needs was provided to the participant to be consumed within 15 minutes. Consumption of the drink prior to the experimental session was designed to reduce hunger and ensure equal relative energy intake between participants. Daily caloric needs were calculated using the Mifflin St. Jeor equation (Mifflin et al., 1990) to first estimate participants’ resting energy expenditure. The IPAQ was used to determine participants’ activity factor to estimate total energy expenditure (TEE). 25% of a participant’s TEE determined the amount (in milliliters; ml) they received. Boost and Osmolite shakes had a 1 calorie per ml of shake ratio; water was added to Osmolite shakes to account for the additional water content of Boost shakes. To determine the amount of water added to the Osmolite nutritional drink, 25% TEE was divided by 1.5; the result was then subtracted from the 25% TEE value, and was added (in ml) to the Osmolite drink.
Following consumption of the meal replacement drink, self-reported fullness was recorded using the SLIM. Next, sensors for the electroencephalographic (EEG) assessment were placed and participants viewed a slide show of images depicting palatable foods (i.e., high-fat, high-sugar), emotional (pleasant, unpleasant) and neutral images. Following the EEG session, participants rerated their feelings of hunger using the SLIM, filled out a post-laboratory questionnaire, and received monetary compensation for their time and for parking/travel, totaling $40.
Unsatiated participants followed a similar procedure (Versace et al., 2016), the main exception being the administration of the nutritional drink. Briefly, eligible participants attended an in-person laboratory visit, where a trained member of the staff explained the study procedures and obtained informed consent. BMI status was confirmed by measuring weight and height in light clothing, without shoes, and drug use and pregnancy status were verified via self-report. Then, participants answered a series of questionnaires on eating behavior, mood, and affect, completed SLIM ratings, the EEG sensors were placed, and participants viewed a slide show (see 2.3 Picture viewing paradigm). Following the experimental session, participants completed SLIM ratings to ensure that presentation of food-related images did not affect perceived hunger, filled out a post-laboratory questionnaire and were compensated.
Passive picture viewing paradigm.
Stimuli were presented with a PC using E-Prime software (version 2.0.8.74; PST Inc., Pittsburgh, PA) on a 42-inch high-definition plasma screen approximately 2.25 meters from the participant’s eyes. From this distance, the stimuli subtended a visual angle of 21 degrees. Picture stimuli consisted of seven categories: neutral (24 people, 24 objects), highly motivationally relevant pleasant (24 erotica) and unpleasant (24 mutilations), low motivationally relevant pleasant (24 romantic) and unpleasant (24 attack), unpleasant objects (24 pollution), and palatable foods (12 high-fat, 12 high-sugar). Images were selected from the International Affective Picture System (Lang et al., 2008) and from a database of images used previously in our laboratory (Versace et al., 2016). The IAPS numbers of the pictures selected for the experiment and the mean values of emotional valence and arousal for each category are reported in the supplement.
The picture viewing paradigm was divided into 4 blocks of 48 trials. Within each block, images were presented in pseudo-random sequences with no more than two images of the same category presented consecutively. Each image was presented for 4 seconds and was followed by a random inter-trial interval of 3–5 seconds during which a white fixation cross was presented on a black background. After each block, participants were given a brief 30 second break. The entire picture presentation lasted approximately 30 minutes.
Unsatiated participants completed a nearly identical picture viewing paradigm, with the only difference being the number of images presented in each category: neutral (16 people, 16 objects), highly motivationally relevant pleasant (16 erotica) and unpleasant (16 mutilations), low motivationally relevant pleasant (16 romantic) and unpleasant (16 attack), unpleasant objects (16 pollution), and palatable foods (8 high-fat, 8 high-sugar). All other experimental procedures, including EEG data reduction, were identical.
EEG data reduction and analyses.
We recorded EEG using a 129-channel Geodesic Sensor System amplified with an AC-coupled high-input impedance (200 MΩ) amplifier (Geodesic EEG System 200; Electrical Geodesics, Inc., Eugene, OR), and referenced to Cz. We used a sampling rate of 250 Hz, and data were filtered online by using 0.1 Hz high-pass and 100 Hz low-pass filters. Scalp impedances were kept below 50 KΩ, as suggested by the manufacturer. After data collection, a 30-Hz low-pass filter was applied off-line. Data were visually inspected using the recording reference (i.e., Cz), and channels contaminated by artifacts for more than 50% of the recording were interpolated with use of spherical splines. We interpolated one channel in seven participants and two channels in five participants. Then, we transformed the EEG data to the average reference, an essential step for accurately plotting the scalp topography of dense-array EEG data (Junghofer et al., 2000; Junghöfer et al., 1997), and we corrected eye blinks using a spatial filtering method implemented in BESA version 5.1.8.10 (MEGIS Software GmbH, Gräfelfing, Germany). We used the Brain Vision Analyzer software program (Brain Products GmbH, Munich, Germany) to extract single epochs from the continuous EEG signal, beginning 100 ms before picture onset and ending 800 ms later. Using the segmented data, we identified artifacts affecting sensors within specific trials using the following criteria: EEG amplitude above 100 or below − 100 μV; absolute voltage difference between any two data points within the segment larger than 100 μV. If more than 10% of the sensors within the segment were contaminated by artifacts the whole segment was excluded from the subsequent averages. Overall, fewer than 5% of the segments were excluded. If fewer than 10% of the sensors were contaminated by artifacts, each channel was considered separately and included in the averages if free from artifacts.
The primary unit of analysis was the amplitude of the late positive potential (LPP). In line with what is recommended in the literature (Luck & Gaspelin, 2017), we decided to a-priori select both the time and the spatial regions of interest for our analyses. Previous work has established that the centro-parietal regions of the scalp are most activated during passive viewing picture paradigms (Keil et al., 2002; Francesco Versace et al., 2011). Hence, consistent with our previous studies (Deweese, Robinson, Cinciripini, & Versace, 2016; Versace et al., 2016), we averaged voltages from 10 central and parietal electrode sites (EGI sensors: 7, 31, 37, 54, 55, 79, 80, 87, 106, 129; see Figure 2 inset for topographic location) between 400 to 700 ms post-stimulus onset separately for each picture category (erotica, mutilations, romance, attack, pollution, food-related, and neutral), for each participant.
Figure 2.

On average, the amplitude of the LPP (see inset for electrode location) increases as a function of motivational relevance in both satiated and unsatiated individuals. LPP values are averaged across BMI <25 kg/m2 and BMI ≥30 kg/m2 individuals. ERO = erotica, MUT = mutilations, ATT = attack, ROM= romance, Food = food-related, POL = pollution, and NEU = neutral. Error bars represent 95% confidence intervals.
Statistical analyses.
Self-reported satiety ratings.
For both groups, self-reported fullness was recorded using the SLIM, and was administered before and after the EEG recording session. Pre- and post-EEG session ratings of fullness (time) were assessed using analysis of variance (ANOVA) with BMI status (BMI <25 kg/m2, BMI ≥30 kg/m2) and satiety status (satiated, unsatiated) as between subjects factors. Where appropriate, significant main effects and interactions were followed up by post-hoc pairwise comparisons, using Bonferroni correction to control for Type I error rate.
Neurophysiological cue reactivity.
We used the amplitude of the LPP as the dependent variable in a repeated measures ANOVA with BMI status (BMI <25 kg/m2, BMI ≥30 kg/m2) and satiety status (satiated, unsatiated) as between-subjects factors and picture category (erotica, mutilations, romance, attack, pollution, food-related, and neutral) as a within-subjects factor. Significant main effects and interactions were followed by planned comparisons tests of least squared means. The results of the analyses that used propensity scores to weight participants’ observations are reported in the online supplement. The results of the propensity score analyses were highly consistent with those presented here.
Results
Self-reported satiety ratings.
Table 1 shows the self-reported satiety ratings for each group. As expected, a significant interaction time by satiety (F(1, 106)=7.99, p<.01) showed that individuals who consumed the meal replacement drink reported feeling more full than people who did not eat, both before (the two groups reported scores of “moderately full” vs. “neither hungry nor full”) and after (“slightly full” vs. “neither hungry nor full”) the EEG session (p<.001). Additionally, people who consumed the meal replacement reported feeling more full before the EEG session compared to after (p<.001). Ratings of fullness for people who did not consume the meal replacement shake did not change significantly (p=.29) nor did they report feeling either hungry or full on the SLIM. Furthermore, there was no effect of BMI on self-reported ratings of fullness before or after the EEG session either when satiated or when unsatiated (F(1, 106)=1.87, p=.17).
Neurophysiological cue reactivity.
Supplement Figure S2 shows the grand averaged ERP waveforms for each picture category (i.e., erotica, mutilations, romance, attack, pollution, food-related, and neutral) collapsing across satiety status and BMI. As expected, for both pleasant and unpleasant images, the amplitude of the LPP increased as a function of the images’ motivational relevance: erotica and mutilations prompted the largest LPPs, followed by images with romantic and violent contents, followed by images of food, pollution, and neutral contents. The statistical analyses conducted on the LPP amplitude confirmed the presence of the main effect of picture category (F(6, 636)=82.22, p<.001) and that no other main effect was significant (Satiety status: F(1, 106)=.02, p=.9; BMI status: F(1, 106)=.04, p=.85)). Neither the three-way interaction of BMI by satiety status by picture category (F(6, 636)=.76, p=.6) nor the two-way interaction satiety status by picture category were significant (F(6, 636)=1.21, p=.3). These results suggest that satiety did not affect neuroaffective electrophysiological responses to food-related or emotional stimuli in either BMI <25 kg/m2 or BMI ≥30 kg/m2 individuals. Figure 2 shows the similar LPP reactivity patterns in the satiated and unsatiated groups.
We did, however, observe a significant interaction of BMI status and picture category, (F(6, 363) = 2.49, p=0.02; Figure 3). Irrespective of satiety status, both BMI ≥30 kg/m2 and BMI <25 kg/m2 individuals showed larger LPPs as a function of the images’ increasing motivational relevance. There were no significant differences in LPP amplitude between BMI <25 kg/m2 and BMI ≥30 kg/m2 individuals for any picture category, including food (p=.9 for all Bonferroni corrected comparisons). However, within group comparisons revealed that while BMI <25 kg/m2 individuals reacted more to low-motivationally relevant pleasant (romantic) pictures than to food-related cues (p<.001), this difference was not significant for BMI ≥30 kg/m2 individuals (p=.9). This reactivity pattern suggests that, even though food-related stimuli hold low motivational relevance when compared to other motivationally relevant stimuli, they might be somewhat more motivationally relevant to BMI ≥30 kg/m2 than to BMI <25 kg/m2 individuals.
Figure 3.
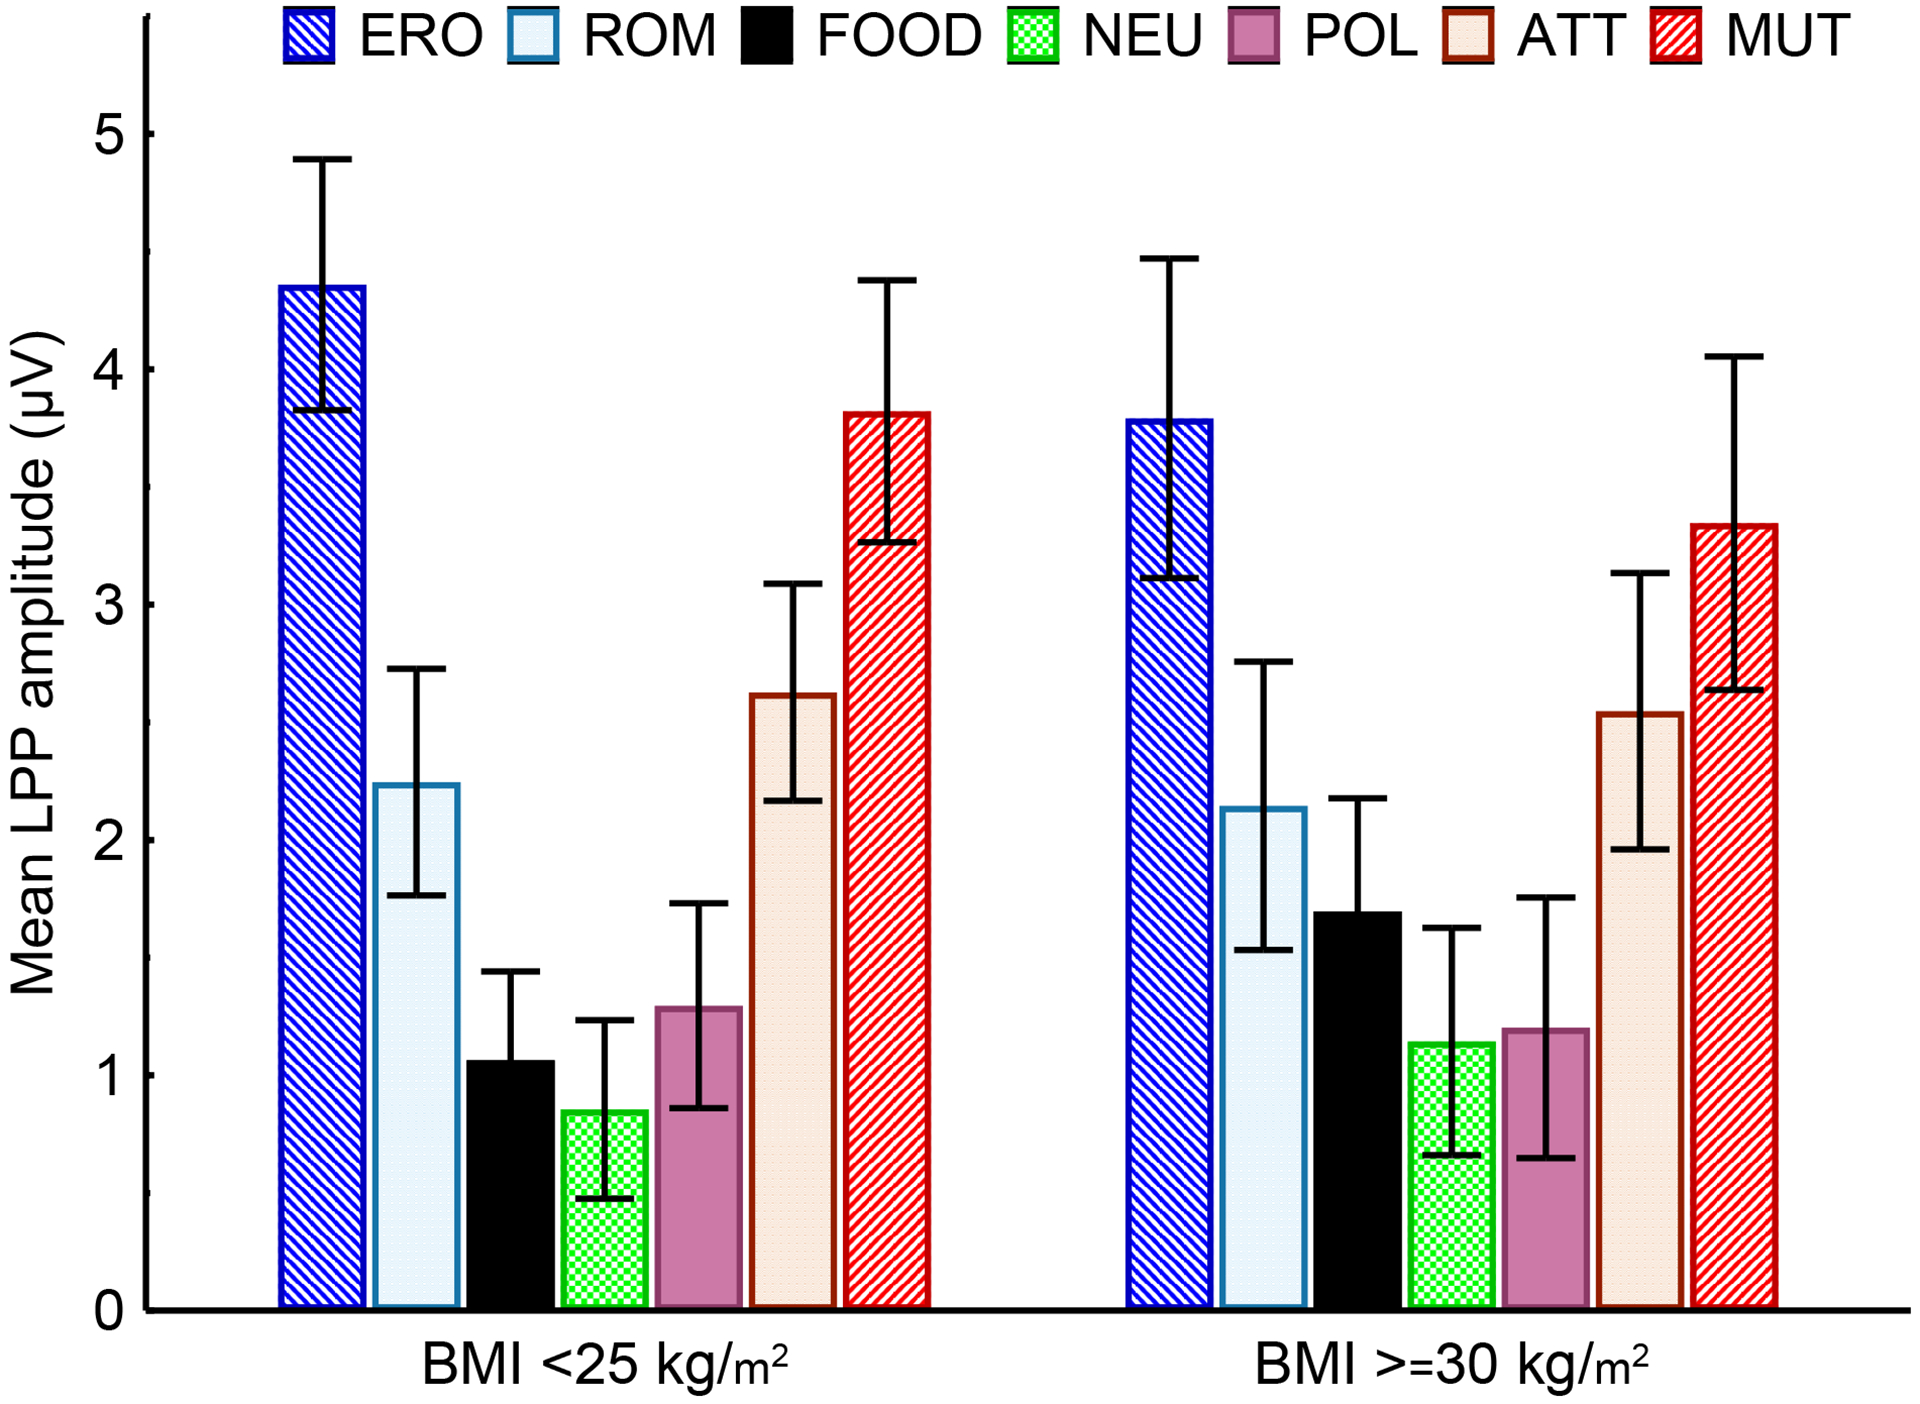
Mean LPP amplitude by picture category for BMI ≥30 kg/m2 (left) and BMI <25 kg/m2 (right) individuals averaged across satiety status.
Individuals with BMI <25 kg/m2 and BMI ≥30 kg/m2 had comparable LPP responses to all categories of stimuli. Individuals with BMI <25 kg/m2 responded more to romance than to food-related cues (p<.0001), BMI ≥30 kg/m2 individuals responded similarly to romance and food-related cues. ERO = erotica, ROM= romance, FOOD = food-related, NEU = neutral, POL = pollution, ATT = attack, and MUT = mutilations. Error bars represent 95% confidence intervals.
Discussion
Here, we used a passive picture viewing paradigm to assess the extent to which satiety differentially affects neuroaffective electrophysiological responses to food-related visual cues as a function of BMI status. We measured ERPs to an array of motivationally relevant visual stimuli in both BMI <25 kg/m2 and BMI ≥30 kg/m2 individuals who were satiated with a nutritional drink prior to the experimental session. We compared their ERPs to those of a matched sample of individuals who did not receive a nutritional drink prior to the experimental session. Our findings indicate that, during a laboratory picture viewing paradigm, satiety does not affect neuroaffective responses to food-related or emotional stimuli in either BMI <25 kg/m2 or BMI ≥30 kg/m2 individuals.
Irrespective of satiety status, we observed comparable LPP responses to food-related visual cues in BMI <25 kg/m2 and BMI ≥30 kg/m2 individuals. Consistent with our previous work (Versace et al., 2016), food-related visual cues elicited LPP responses more similar to those evoked by stimuli with low motivational relevance than to those evoked by highly motivationally relevant stimuli. Pairwise comparisons showed that BMI <25 kg/m2 individuals reacted more to low motivationally relevant pleasant (romantic) pictures than to food-related cues; whereas, this difference was not significant in the BMI ≥30 kg/m2 sample. While these results suggest that visually presented food-related stimuli are somewhat more motivationally relevant to BMI ≥30 kg/m2 than to BMI <25 kg/m2 individuals, the difference that we observed is small.
Although we found no effect of satiety on the neuroaffective responses to visually presented food-related or emotional stimuli, in the neuroimaging literature there is evidence suggesting that BMI ≥30 kg/m2 individuals may continue to respond to food-related cues even when satiated. In a recent meta-analytical review of functional magnetic resonance imaging (fMRI) studies on food perception in BMI ≥30 kg/m2 individuals, Devoto et al. (2018) report more frequent activation in the ventral striatum to visual food cues in satiated BMI ≥30 kg/m2, relative to BMI <25 kg/m2, individuals (see also Kennedy & Dimitropoulos, 2014; Pursey et al., 2014). In the context of the present experiment, however, it is important to note that, with the exception of one study that did not find any difference between responses to food cues and pleasant stimuli (Davids et al., 2010), all the studies reviewed in the meta-analysis included only comparisons between food-related and neutral cues. A distinct advantage of our experimental paradigm is the inclusion of visual stimuli spanning both high and low levels of motivational relevance. The majority of studies observing differences between BMI ≥30 kg/m2 and healthy-weight individuals present food-related cues in the context of neutral cues (see Hendrikse et al., 2015; Kennedy & Dimitropoulos, 2014; Pursey et al., 2014 for review). Animal models show that the brain’s valuation system adjusts to the range of values available at any given time (Padoa-Schioppa, 2009). Thus, when presented with only neutral cues, food-related cues may appear more motivationally relevant (Versace & Schembre, 2015). By including a broad array of motivationally relevant categories in addition to food-related cues, we can more accurately interpret the motivational relevance attributed to visually presented food-related cues (Oliver, Jentink, Drobes, & Evans, 2016; Versace & Schembre, 2015; Versace et al., 2017, 2019). An additional advantage of including a wide array of motivationally relevant stimuli is that it allowed us to have several “active” control conditions to evaluate the reliability of our results. Observing that both satiated and unsatiated individuals had similar responses not just to food-related and neutral images, but also to images belonging to five other motivationally relevant categories supports the soundness of our approach. While the two studies did differ in the number of total pictures per category (24 vs. 16 images per category), we recently showed that increasing the number of pictures per category from 15 to 25 only marginally increased the power to detect differences in between-subjects comparisons with 50 participants per group (Gibney et al., 2020).
We believe that the proximity of a food-cue to a consumable food reward plays a much more important role in determining the motivational relevance of food-related cues. In a recent study (Versace et al., 2019), rather than using the standard passive viewing picture viewing paradigm, we used the cued food delivery task (Deweese et al., 2015) to measure ERPs to food-related cues that either precede or do not precede the delivery of an appetizing food reward (i.e., a chocolate candy) that participants could eat right away. The results showed that neuroaffective electrophysiological responses to cues preceding a consumable food reward were as high as those evoked by the most motivationally relevant stimuli in the set (i.e., erotica), while when cues were not predicting food delivery, the responses were similar to those evoked by stimuli with low motivational relevance (Versace et al., 2019), as we also observed in the findings reported here. This is in contrast to the majority of human laboratory studies employing the cue reactivity paradigm, where the presentation of cues reliably indicates that a reward is not available until after the experimental session. We suggest that postponing availability of tangible rewards may create a floor effect that prevents food cues from eliciting the same response they might elicit in a real-world scenario in which the presence of a cue signals imminent food availability. This is a limitation of most studies in which cues are not immediately followed by delivery of a tangible reward, and may contribute to reduce reactivity to cues and to unreliable and non-replicable results. It is also worth noting that while we did not observe a difference in LPP amplitude modulation to food-related cues as a function of BMI status, it does not mean these individuals are not responding differently to these cues. It is possible that other paradigms or ERP components may be better suited to detect subtle differences in the capture of attentional resources in satiated vs unsatiated individuals (Ilse et al., 2020).
A defining feature in studies reporting robust responses to food-related cues is that participants adhere to a period of restricted food intake prior to the experimental session. In a variety of paradigms, food deprivation (2–24hrs) evokes powerful effects on food-related behaviors: it delays color naming of food-associated words in the modified Stroop task (Nijs et al., 2010), it increases attention paid to food words in the dot-probe task (Placanica et al., 2002), and it results in enhanced activity in higher-order visual-associative regions and the amygdala when processing food-related images (LaBar et al., 2001). In a series of ERP studies designed to assess whether the processing of food-related pictures was selectively modulated by food deprivation, Stockburger and colleagues (2009, 2008) showed that ERP amplitudes to food-related images were enhanced in a deprived, relative to non-deprived, hunger state. The authors suggest that the results of their 2009 study extend previously reported neuroimaging findings to show that variations in hunger status (i.e., 24 h food-deprived versus non-deprived) may engage a similar cortical network of parieto-temporo-occipital regions engaged differentially by salient food stimuli (see Stockburger et al., 2009). However, enhanced perceptual processing of food-related stimuli in a food-restricted state is an anticipated response, as food deprivation enhances perceptual processing of food-related cues which, in turn, results in more focused attention toward those stimuli. This motivationally driven regulation of attention may reflect an evolutionarily adaptive mechanism designed to increase the likelihood of restoring depleted energy (Stockburger et al., 2009) rather than a clinical indicator of obesity.
We acknowledge that we are limited in the present study by the relatively small number of BMI ≥30 kg/m2 participants. However, the overall pattern of brain responses evoked by emotional cues (highly motivationally relevant > low motivationally relevant > neutral) replicates previous findings from our laboratory (Deweese et al., 2016; Stevens et al., 2019; Versace et al., 2016) and others’ (Oliver et al., 2016; Olofsson et al., 2008; Schupp et al., 2004; Weinberg & Hajcak, 2010), thus we are confident in the validity of our results, notwithstanding the small sample size. Additionally, it is important to note that we did not collect self-reported stimulus ratings for the images presented in the current study, as these images were used in a previous study from our laboratory designed to assess brain reactivity to emotional and food-related cues in a sample of individuals similar to those enrolled in the current study (Versace et al., 2016a). Although food-related stimuli are typically rated as highly motivationally salient stimuli in self-report assessments, self-report ratings do not always reliably map onto the ERP findings (Deweese et al., 2018; Versace et al., 2016). For this reason, we opted to focus our attention on the electrophysiological responses evoked by visual stimuli.
While the present study was not designed to assess sensory-specific satiety, a phenomenon that occurs when food consumption reduces liking of congruent food cues, this is an important consideration for future satiety experiments. Recently Zoon et al., (2018) observed a reduction in ERP amplitude to visually presented food-related cues following consumption of foods with a congruent taste profile. Effects were most pronounced in response to images of high calorie sweet foods following consumption of a sweet meal, and occurred during both early (80–150 ms) and late (300–700 ms) stages of visual processing.
It is also important to acknowledge that the findings presented here were collected from matched individuals who took part in two different experiments, rather than from a randomized trial. To statistically control for the influence of selection bias and other external variables on the results, in addition to the analyses presented above, we conducted a propensity score analysis (see online supplement). While a propensity score analysis is not considered necessary in the presence of non-significant findings, it allowed us to demonstrate that the findings observed using the one-to-one matching approach did not change when additional subjects and covariates were included.
In conclusion, our results indicate that satiety does not affect neuroaffective electrophysiological responses to food-related or emotional stimuli in either BMI <25 kg/m2 or BMI ≥30 kg/m2 individuals when measured by the LPP in a standard picture viewing paradigm. Future studies should investigate the extent to which food availability affects cue reactivity in satiated BMI <25 kg/m2 and BMI ≥30 kg/m2 individuals, as this may have important implications for cue-induced eating behaviors and weight-control interventions.
Supplementary Material
Acknowledgments
The authors would like to thank Kimberly Claiborne for coordinating study operations. This research was supported by funds provided to SMS and FV by the UT MD Anderson Cancer Center and by NIH/NCI CCSG award # P30CA016672. The content is solely the responsibility of the authors and does not necessarily represent the official views of the NIH. We have no conflicts of interest to disclose.
Footnotes
The results presented here are part of a larger study (Protocol# 2014-0398) in which the overarching goal was to clarify the extent to which the role of the gut in homeostatic eating behavior interacts with the brain to influence decision-making processes related to hedonic eating. Therefore, criteria for study enrollment included the additional exclusion criteria, not relevant to the data presented in this manuscript.
References
- Appelhans BM, Woolf K, Pagoto SL, Schneider KL, Whited MC, & Liebman R (2011). Inhibiting Food Reward: Delay Discounting, Food Reward Sensitivity, and Palatable Food Intake in Overweight and Obese Women. Obesity, 19(11), 2175–2182. 10.1038/oby.2011.57 [DOI] [PMC free article] [PubMed] [Google Scholar]
- Austin PC (2011). An Introduction to Propensity Score Methods for Reducing the Effects of Confounding in Observational Studies. Multivariate Behavioral Research, 46(3), 399–424. 10.1080/00273171.2011.568786 [DOI] [PMC free article] [PubMed] [Google Scholar]
- Berridge KC, Ho C-Y, Richard JM, & DiFeliceantonio AG (2010). The tempted brain eats: Pleasure and desire circuits in obesity and eating disorders. Brain Research, 1350, 43–64. 10.1016/j.brainres.2010.04.003 [DOI] [PMC free article] [PubMed] [Google Scholar]
- Berthoud H-R (2004). Neural control of appetite: Cross-talk between homeostatic and non-homeostatic systems. Appetite, 43(3), 315–317. 10.1016/j.appet.2004.04.009 [DOI] [PubMed] [Google Scholar]
- Berthoud H-R (2012). The neurobiology of food intake in an obesogenic environment. Proceedings of the Nutrition Society, 71(4), 478–487. 10.1017/S0029665112000602 [DOI] [PMC free article] [PubMed] [Google Scholar]
- Bradley MM, Codispoti M, & Lang PJ (2006). A multi-process account of startle modulation during affective perception. Psychophysiology, 43(5), 486–497. 10.1111/j.1469-8986.2006.00412.x [DOI] [PubMed] [Google Scholar]
- Bradley MM, Hamby S, Löw A, & Lang PJ (2007). Brain potentials in perception: Picture complexity and emotional arousal. Psychophysiology, 44(3), 364–373. 10.1111/j.1469-8986.2007.00520.x [DOI] [PubMed] [Google Scholar]
- Carbine KA, Christensen E, LeCheminant JD, Bailey BW, Tucker LA, & Larson MJ (2017). Testing food-related inhibitory control to high- and low-calorie food stimuli: Electrophysiological responses to high-calorie food stimuli predict calorie and carbohydrate intake. Psychophysiology, 54(7), 982–997. 10.1111/psyp.12860 [DOI] [PubMed] [Google Scholar]
- Cardello AV, Schutz HG, Lesher LL, & Merrill E (2005). Development and testing of a labeled magnitude scale of perceived satiety. Appetite, 44(1), 1–13. 10.1016/j.appet.2004.05.007 [DOI] [PubMed] [Google Scholar]
- Cesarei AD, & Codispoti M (2006). When does size not matter? Effects of stimulus size on affective modulation. Psychophysiology, 43(2), 207–215. 10.1111/j.1469-8986.2006.00392.x [DOI] [PubMed] [Google Scholar]
- Cesarei AD, & Codispoti M (2011). Affective modulation of the LPP and α-ERD during picture viewing. Psychophysiology, 48(10), 1397–1404. 10.1111/j.1469-8986.2011.01204.x [DOI] [PubMed] [Google Scholar]
- Codispoti M, Cesarei AD, & Ferrari V (2012). The influence of color on emotional perception of natural scenes. Psychophysiology, 49(1), 11–16. 10.1111/j.1469-8986.2011.01284.x [DOI] [PubMed] [Google Scholar]
- Codispoti M, Ferrari V, & Bradley MM (2007). Repetition and Event-related Potentials: Distinguishing Early and Late Processes in Affective Picture Perception. Journal of Cognitive Neuroscience, 19(4), 577–586. 10.1162/jocn.2007.19.4.577 [DOI] [PubMed] [Google Scholar]
- Codispoti M, Mazzetti M, & Bradley MM (2009). Unmasking emotion: Exposure duration and emotional engagement. Psychophysiology, 46(4), 731–738. 10.1111/j.1469-8986.2009.00804.x [DOI] [PubMed] [Google Scholar]
- Craig CL, Marshall AL, Sjöström M, Bauman AE, Booth ML, Ainsworth BE, Pratt M, Ekelund U, Yngve A, Sallis JF, & Oja P (2003). International physical activity questionnaire: 12-country reliability and validity. Medicine and Science in Sports and Exercise, 35(8), 1381–1395. 10.1249/01.MSS.0000078924.61453.FB [DOI] [PubMed] [Google Scholar]
- Cuthbert BN, Schupp HT, Bradley MM, Birbaumer N, & Lang PJ (2000). Brain potentials in affective picture processing: Covariation with autonomic arousal and affective report. Biological Psychology, 52(2), 95–111. 10.1016/S0301-0511(99)00044-7 [DOI] [PubMed] [Google Scholar]
- Davids S, Lauffer H, Thoms K, Jagdhuhn M, Hirschfeld H, Domin M, Hamm A, & Lotze M (2010). Increased dorsolateral prefrontal cortex activation in obese children during observation of food stimuli. International Journal of Obesity, 34(1), 94–104. 10.1038/ijo.2009.193 [DOI] [PubMed] [Google Scholar]
- Devoto F, Zapparoli L, Bonandrini R, Berlingeri M, Ferrulli A, Luzi L, Banfi G, & Paulesu E (2018). Hungry brains: A meta-analytical review of brain activation imaging studies on food perception and appetite in obese individuals. Neuroscience & Biobehavioral Reviews, 94, 271–285. 10.1016/j.neubiorev.2018.07.017 [DOI] [PubMed] [Google Scholar]
- Deweese MM, Claiborne KN, Ng J, Dirba DD, Stewart HL, Schembre SM, & Versace F (2015). Dispensing apparatus for use in a cued food delivery task. MethodsX, 2, 446–457. 10.1016/j.mex.2015.11.002 [DOI] [PMC free article] [PubMed] [Google Scholar]
- Deweese MM, Codispoti M, Robinson JD, Cinciripini PM, & Versace F (2018). Cigarette cues capture attention of smokers and never-smokers, but for different reasons. Drug and Alcohol Dependence, 185, 50–57. 10.1016/j.drugalcdep.2017.12.010 [DOI] [PMC free article] [PubMed] [Google Scholar]
- Deweese MM, Robinson JD, Cinciripini PM, & Versace F (2016). Conditioned cortical reactivity to cues predicting cigarette-related or pleasant images. International Journal of Psychophysiology, 101, 59–68. 10.1016/j.ijpsycho.2016.01.007 [DOI] [PMC free article] [PubMed] [Google Scholar]
- Ferrari V, Bradley MM, Codispoti M, & Lang PJ (2011). Repetitive exposure: Brain and reflex measures of emotion and attention. Psychophysiology, 48(4), 515–522. 10.1111/j.1469-8986.2010.01083.x [DOI] [PMC free article] [PubMed] [Google Scholar]
- Ferrari V, Codispoti M, & Bradley MM (2017). Repetition and ERPs during emotional scene processing: A selective review. International Journal of Psychophysiology, 111, 170–177. 10.1016/j.ijpsycho.2016.07.496 [DOI] [PubMed] [Google Scholar]
- Field M, Werthmann J, Franken I, Hofmann W, Hogarth L, & Roefs A (2016). The role of attentional bias in obesity and addiction. Health Psychology, 35(8), 767–780. 10.1037/hea0000405 [DOI] [PubMed] [Google Scholar]
- Gibney KD, Kypriotakis G, Cinciripini PM, Robinson JD, Minnix JA, & Versace F (2020). Estimating statistical power for event-related potential studies using the late positive potential. Psychophysiology, 57(2), e13482. 10.1111/psyp.13482 [DOI] [PMC free article] [PubMed] [Google Scholar]
- Gobbi S, Weber SC, Graf G, Hinz D, Asarian L, Geary N, Leeners B, Hare TA, & Tobler PN (2020). Reduced Neural Satiety Responses in Women Affected by Obesity. Neuroscience, 447, 94–112. 10.1016/j.neuroscience.2020.07.022 [DOI] [PubMed] [Google Scholar]
- Hall PA (2012). Executive control resources and frequency of fatty food consumption: Findings from an age-stratified community sample. Health Psychology: Official Journal of the Division of Health Psychology, American Psychological Association, 31(2), 235–241. 10.1037/a0025407 [DOI] [PubMed] [Google Scholar]
- Hendrikse JJ, Cachia RL, Kothe EJ, McPhie S, Skouteris H, & Hayden MJ (2015). Attentional biases for food cues in overweight and individuals with obesity: A systematic review of the literature. Obesity Reviews, 16(5), 424–432. 10.1111/obr.12265 [DOI] [PubMed] [Google Scholar]
- Ilse A, Donohue SE, Schoenfeld MA, Hopf JM, Heinze H-J, & Harris JA (2020). Unseen food images capture the attention of hungry viewers: Evidence from event-related potentials. Appetite, 155, 104828. 10.1016/j.appet.2020.104828 [DOI] [PubMed] [Google Scholar]
- Johnson AW (2013). Eating beyond metabolic need: How environmental cues influence feeding behavior. Trends in Neurosciences, 36(2), 101–109. 10.1016/j.tins.2013.01.002 [DOI] [PubMed] [Google Scholar]
- Junghöfer M, Elbert T, Leiderer P, Berg P, & Rockstroh B (1997). Mapping EEG-potentials on the surface of the brain: A strategy for uncovering cortical sources. Brain Topography, 9(3), 203–217. 10.1007/BF01190389 [DOI] [PubMed] [Google Scholar]
- Junghofer M, Elbert T, Tucker DM, & Rockstroh B (2000). Statistical control of artifacts in dense array EEG/MEG studies. Psychophysiology, 37(4), 523–532. 10.1111/1469-8986.3740523 [DOI] [PubMed] [Google Scholar]
- Keil A, Bradley MM, Hauk O, Rockstroh B, Elbert T, & Lang PJ (2002). Large-scale neural correlates of affective picture processing. Psychophysiology, 39(5), 641–649. 10.1111/1469-8986.3950641 [DOI] [PubMed] [Google Scholar]
- Kennedy J, & Dimitropoulos A (2014). Influence of feeding state on neurofunctional differences between individuals who are obese and normal weight: A meta-analysis of neuroimaging studies. Appetite, 75, 103–109. 10.1016/j.appet.2013.12.017 [DOI] [PubMed] [Google Scholar]
- LaBar KS, Gitelman DR, Parrish TB, Kim YH, Nobre AC, & Mesulam MM (2001). Hunger selectively modulates corticolimbic activation to food stimuli in humans. Behavioral Neuroscience, 115(2), 493–500. [DOI] [PubMed] [Google Scholar]
- Lang PJ, & Bradley MM (2010). Emotion and the motivational brain. Biological Psychology, 84(3), 437–450. 10.1016/j.biopsycho.2009.10.007 [DOI] [PMC free article] [PubMed] [Google Scholar]
- Lang PJ, Bradley MM, & Cuthbert BN (2008). International affective picture system (IAPS): Affective ratings of pictures and instruction manual. Technical Report A-8. University of Florida, Gainesville, FL. [Google Scholar]
- Liu Y, Huang H, McGinnis-Deweese M, Keil A, & Ding M (2012). Neural Substrate of the Late Positive Potential in Emotional Processing. Journal of Neuroscience, 32(42), 14563–14572. 10.1523/JNEUROSCI.3109-12.2012 [DOI] [PMC free article] [PubMed] [Google Scholar]
- Luck SJ, & Gaspelin N (2017). How to Get Statistically Significant Effects in Any ERP Experiment (and Why You Shouldn’t). Psychophysiology, 54(1), 146–157. 10.1111/psyp.12639 [DOI] [PMC free article] [PubMed] [Google Scholar]
- Martin LE, Holsen LM, Chambers RJ, Bruce AS, Brooks WM, Zarcone JR, Butler MG, & Savage CR (2010). Neural Mechanisms Associated With Food Motivation in Obese and Healthy Weight Adults. Obesity, 18(2), 254–260. 10.1038/oby.2009.220 [DOI] [PubMed] [Google Scholar]
- Mason AE, Jhaveri K, Schleicher S, Almeida C, Hartman A, Wackerly A, Alba D, Koliwad SK, Epel ES, & Aschbacher K (2019). Sweet cognition: The differential effects of glucose consumption on attentional food bias in individuals of lean and obese status. Physiology & Behavior, 206, 264–273. 10.1016/j.physbeh.2019.04.014 [DOI] [PMC free article] [PubMed] [Google Scholar]
- Mastria S, Ferrari V, & Codispoti M (2017). Emotional Picture Perception: Repetition Effects in Free-Viewing and during an Explicit Categorization Task. Frontiers in Psychology, 8. 10.3389/fpsyg.2017.01001 [DOI] [PMC free article] [PubMed] [Google Scholar]
- Meule A, & Kübler A (2014). Double trouble. Trait food craving and impulsivity interactively predict food-cue affected behavioral inhibition. Appetite, 79, 174–182. 10.1016/j.appet.2014.04.014 [DOI] [PubMed] [Google Scholar]
- Mifflin MD, St Jeor ST, Hill LA, Scott BJ, Daugherty SA, & Koh YO (1990). A new predictive equation for resting energy expenditure in healthy individuals. The American Journal of Clinical Nutrition, 51(2), 241–247. 10.1093/ajcn/51.2.241 [DOI] [PubMed] [Google Scholar]
- Minnix JA, Versace F, Robinson JD, Lam CY, Engelmann JM, Cui Y, Brown VL, & Cinciripini PM (2013). The late positive potential (LPP) in response to varying types of emotional and cigarette stimuli in smokers: A content comparison. International Journal of Psychophysiology, 89(1), 18–25. 10.1016/j.ijpsycho.2013.04.019 [DOI] [PMC free article] [PubMed] [Google Scholar]
- Nijs IMT, & Franken IHA (2012). Attentional Processing of Food Cues in Overweight and Obese Individuals. Current Obesity Reports, 1(2), 106–113. 10.1007/s13679-012-0011-1 [DOI] [PMC free article] [PubMed] [Google Scholar]
- Nijs IMT, Franken IHA, & Muris P (2008). Food cue-elicited brain potentials in obese and healthy-weight individuals. Eating Behaviors, 9(4), 462–470. 10.1016/j.eatbeh.2008.07.009 [DOI] [PubMed] [Google Scholar]
- Nijs IMT, Franken IHA, & Muris P (2010). Food-related Stroop interference in obese and normal-weight individuals: Behavioral and electrophysiological indices. Eating Behaviors, 11(4), 258–265. 10.1016/j.eatbeh.2010.07.002 [DOI] [PubMed] [Google Scholar]
- Oliver JA, Jentink KG, Drobes DJ, & Evans DE (2016). Smokers exhibit biased neural processing of smoking and affective images. Health Psychology: Official Journal of the Division of Health Psychology, American Psychological Association, 35(8), 866–869. 10.1037/hea0000350 [DOI] [PMC free article] [PubMed] [Google Scholar]
- Olofsson JK, Nordin S, Sequeira H, & Polich J (2008). Affective picture processing: An integrative review of ERP findings. Biological Psychology, 77(3), 247–265. 10.1016/j.biopsycho.2007.11.006 [DOI] [PMC free article] [PubMed] [Google Scholar]
- Padoa-Schioppa C (2009). Range-Adapting Representation of Economic Value in the Orbitofrontal Cortex. Journal of Neuroscience, 29(44), 14004–14014. 10.1523/JNEUROSCI.3751-09.2009 [DOI] [PMC free article] [PubMed] [Google Scholar]
- Placanica JL, Faunce GJ, & Soames Job RF (2002). The effect of fasting on attentional biases for food and body shape/weight words in high and low Eating Disorder Inventory scorers. The International Journal of Eating Disorders, 32(1), 79–90. 10.1002/eat.10066 [DOI] [PubMed] [Google Scholar]
- Pursey KM, Stanwell P, Callister RJ, Brain K, Collins CE, & Burrows TL (2014). Neural Responses to Visual Food Cues According to Weight Status: A Systematic Review of Functional Magnetic Resonance Imaging Studies. Frontiers in Nutrition, 1. 10.3389/fnut.2014.00007 [DOI] [PMC free article] [PubMed] [Google Scholar]
- Robinson TE, & Berridge KC (1993). The neural basis of drug craving: An incentive-sensitization theory of addiction. Brain Research Reviews, 18(3), 247–291. 10.1016/0165-0173(93)90013-P [DOI] [PubMed] [Google Scholar]
- Rosenbaum PR, & Rubin DB (1983). The central role of the propensity score in observational studies for causal effects. Biometrika, 70(1), 41–55. 10.1093/biomet/70.1.41 [DOI] [Google Scholar]
- Ross CE, & Mirowsky J (1984). COMPONENTS OF DEPRESSED MOOD IN MARRIED MEN AND WOMEN THE CENTER FOR EPIDEMIOLOGIC STUDIES’ DEPRESSION SCALE. American Journal of Epidemiology, 119(6), 997–1004. 10.1093/oxfordjournals.aje.a113819 [DOI] [PubMed] [Google Scholar]
- Schembre S, Greene G, & Melanson K (2009). Development and validation of a weight-related eating questionnaire. Eating Behaviors, 10(2), 119–124. 10.1016/j.eatbeh.2009.03.006 [DOI] [PubMed] [Google Scholar]
- Schupp HT, Cuthbert BN, Bradley MM, Cacioppo JT, Ito T, & Lang PJ (2000). Affective picture processing: The late positive potential is modulated by motivational relevance. Psychophysiology, 37(2), 257–261. 10.1111/1469-8986.3720257 [DOI] [PubMed] [Google Scholar]
- Schupp HT, Cuthbert BN, Bradley MM, Hillman CH, Hamm AO, & Lang PJ (2004). Brain processes in emotional perception: Motivated attention. 10.1080/02699930341000239 [DOI] [Google Scholar]
- Schupp HT, Flaisch T, Stockburger J, & Junghöfer M (2006). Emotion and attention: Event-related brain potential studies. In Anders S, Ende G, Junghofer M, Kissler J, & Wildgruber D (Eds.), Progress in Brain Research (Vol. 156, pp. 31–51). Elsevier. 10.1016/S0079-6123(06)56002-9 [DOI] [PubMed] [Google Scholar]
- Schupp HT, Stockburger J, Codispoti M, Junghöfer M, Weike AI,; Hamm AO (2006). Stimulus novelty and emotion perception: the near absence of habituation in the visual cortex. NeuroReport (Vol 17, 4 - p 365–369. doi: 10.1097/01.wnr.0000203355.88061.c6 [DOI] [PubMed] [Google Scholar]
- Stevens EM, Frank D, Codispoti M, Kypriotakis G, Cinciripini PM, Claiborne K, Deweese MM, Engelmann JM, Green CE, Karam-Hage M, Minnix JA, Ng J, Robinson JD, Tyndale RF, Vidrine DJ, & Versace F (2019). The Late Positive Potentials Evoked by Cigarette-Related and Emotional Images Show no Gender Differences in Smokers. Scientific Reports, 9(1), 1–8. 10.1038/s41598-019-39954-0 [DOI] [PMC free article] [PubMed] [Google Scholar]
- Stice E, & Burger K (2019). Neural vulnerability factors for obesity. Clinical Psychology Review, 68, 38–53. 10.1016/j.cpr.2018.12.002 [DOI] [PMC free article] [PubMed] [Google Scholar]
- Stockburger J, Schmälzle R, Flaisch T, Bublatzky F, & Schupp HT (2009). The impact of hunger on food cue processing: An event-related brain potential study. NeuroImage, 47(4), 1819–1829. 10.1016/j.neuroimage.2009.04.071 [DOI] [PubMed] [Google Scholar]
- Stockburger J, Weike AI, Hamm AO, & Schupp HT (2008). Deprivation selectively modulates brain potentials to food pictures. Behavioral Neuroscience, 122(4), 936–942. 10.1037/a0012517 [DOI] [PubMed] [Google Scholar]
- Stuart EA, King G, Imai K, & Ho D (2011). MatchIt: Nonparametric Preprocessing for Parametric Causal Inference. Journal of Statistical Software. 10.18637/jss.v042.i08 [DOI] [Google Scholar]
- Versace, Engelmann JM, Deweese MM, Robinson JD, Green CE, Lam CY, Minnix JA, Karam-Hage MA, Wetter DW, Schembre SM, & Cinciripini PM (2017). Beyond Cue Reactivity: Non-Drug-Related Motivationally Relevant Stimuli Are Necessary to Understand Reactivity to Drug-Related Cues. Nicotine & Tobacco Research: Official Journal of the Society for Research on Nicotine and Tobacco, 19(6), 663–669. 10.1093/ntr/ntx002 [DOI] [PMC free article] [PubMed] [Google Scholar]
- Versace F, & Schembre SM (2015). “Obesogenic” oversimplification. Obesity Reviews: An Official Journal of the International Association for the Study of Obesity, 16(8), 702–703. 10.1111/obr.12301 [DOI] [PubMed] [Google Scholar]
- Versace F, Frank DW, Stevens EM, Deweese MM, Guindani M, & Schembre SM (2019). The reality of “food porn”: Larger brain responses to food-related cues than to erotic images predict cue-induced eating. Psychophysiology, 56(4), e13309. 10.1111/psyp.13309 [DOI] [PMC free article] [PubMed] [Google Scholar]
- Versace F, Kypriotakis G, Basen-Engquist K, & Schembre SM (2016a). Heterogeneity in brain reactivity to pleasant and food cues: Evidence of sign-tracking in humans. Social Cognitive and Affective Neuroscience, 11(4), 604–611. 10.1093/scan/nsv143 [DOI] [PMC free article] [PubMed] [Google Scholar]
- Versace F, Kypriotakis G, Basen-Engquist K, & Schembre SMSM (2016b). Heterogeneity in brain reactivity to pleasant and food cues: Evidence of sign-tracking in humans. Social Cognitive and Affective Neuroscience, 11(4), 604–611. 10.1093/scan/nsv143 [DOI] [PMC free article] [PubMed] [Google Scholar]
- Versace F, Minnix JA, Robinson JD, Lam CY, Brown VL, & Cinciripini PM (2011). Brain reactivity to emotional, neutral and cigarette-related stimuli in smokers. Addiction Biology, 16(2), 296–307. 10.1111/j.1369-1600.2010.00273.x [DOI] [PMC free article] [PubMed] [Google Scholar]
- Volkow ND, Wang G-J, Tomasi D, & Baler RD (2013). The Addictive Dimensionality of Obesity. Biological Psychiatry, 73(9), 811–818. 10.1016/j.biopsych.2012.12.020 [DOI] [PMC free article] [PubMed] [Google Scholar]
- Weinberg A, & Hajcak G (2010). Beyond good and evil: The time-course of neural activity elicited by specific picture content. Emotion, 10(6), 767–782. 10.1037/a0020242 [DOI] [PubMed] [Google Scholar]
- Zoon HFA, Ohla K, de Graaf C, & Boesveldt S (2018). Modulation of event-related potentials to food cues upon sensory-specific satiety. Physiology & Behavior, 196, 126–134. 10.1016/j.physbeh.2018.08.020 [DOI] [PubMed] [Google Scholar]
Associated Data
This section collects any data citations, data availability statements, or supplementary materials included in this article.