

Abstract
Background:
Asthma is common, resulting in 53 million emergency department (ED) visits annually. Little is known about variation in cost and quality of ED asthma care.
Study objective:
We sought to describe variation in costs and 7-day ED revisit rates for asthma care across EDs. Our primary objective was to test for an association between ED costs and the likelihood of a 7-day revisit for another asthma exacerbation.
Methods:
We used the 2014 Florida State Emergency Department Database to perform an observational study of ED visits by patients ≥18 years old with a primary diagnosis of asthma that were discharged home. We compared patient and hospital characteristics of index ED discharges with and without 7-day revisits, then tested the association between ED revisits and index ED costs. Multilevel regression was performed to account for hospital-level clustering.
Results:
In 2014, there were 54,060 adult ED visits for asthma resulting in discharge, and 1,667 (3%) were associated with an asthma-related ED revisit within 7 days. Median cost for an episode of ED asthma care was $597 with an interquartile range of $371–980. After adjusting for both patient and hospital characteristics, lack of insurance was associated with higher odds of revisit (OR 1.42, 95% CI 1.18–1.71), while private insurance, female gender, and older age were associated with lower odds of revisit. Hospital costs were not associated with ED revisits (OR = 1.00; 95% CI 1.00–1.00).
Conclusion:
Hospital costs associated with ED asthma visits vary but are not associated with odds of ED revisit.
Keywords: asthma, ED revisits, cost variation, emergency medicine, health services research
Introduction
Asthma affects 19 million U.S. adults (1), resulting in an estimated $50.3 billion in annual medical costs as of 2013 (2). One contributor to these costs, and an important marker of morbidity, are the 1.22 million asthma-related visits to emergency departments (EDs) that occur every year (3, 4). Given the disease burden and costs associated with asthma, it is important to optimize transitions of care for this population. Even after appropriate emergency care, patients with asthma may decompensate resulting in a return to the ED. Patient education improves the likelihood of primary care follow-up and treatment adherence (5), which may decrease the risk of ED revisits. Thus, improving transitions of care after ED discharge for asthma patients has been proposed as an area for quality improvement.
The American College of Emergency Physicians (ACEP) has identified ED revisit rate as one indicator of the quality of emergency care for patients with asthma (6). Among all pediatric patients, 4–5% patients will revisit an emergency department within 7 days (7, 8). Among adult ED patients with ‘upper respiratory tract infections’, there is a 4.9% three-day revisit rate (9). Roughly 9.2% of adult asthma patients relapse - as defined by any urgent/unplanned ED, clinic, or physician office visit – within seven days of receiving emergent asthma care in the ED (10).
At the same time, the Merit-Based Incentive Program System (MIPS) track of the Quality Payment Program (QPP) implemented in 2015 requires cost be considered as one factor in determining up to 30% of overall reimbursement from Medicare in 2022. The cost category incorporates episode-based cost measures for targeted conditions, and a cost measure for emergency department visits for asthma is under consideration for development (11). Prior research suggests the average charge for an ED visit for asthma is $1,502 (12); however, variations in costs for asthma across EDs has yet to be described. The relationship between cost and quality remains poorly defined across healthcare settings (ie, hospital or outpatient) and medical specialties (13). When episode-based cost measures are implemented—for example, as part of the QPP regulation mandated by the Centers for Medicare and Medicaid Services comparing the costs of emergency care costs between and within clinician groups—it is possible that clinicians expending fewer resources per episode will be awarded bonus payments regardless of quality (14). However, it is unknown if increased costs are associated with improved outcomes for patients with asthma. We sought to use a statewide ED database to describe variation in costs for asthma care and subsequent revisit rates across emergency departments. We hypothesized that there was wide cost variation among emergency departments. Furthermore, we hypothesized there was no relationship between resources utilized for an initial episode of care and the likelihood of a patient returning to an ED for asthma care.
Materials and Methods
Data and Sample
We performed an observational study using the Healthcare Cost and Utilization Project (HCUP) State Emergency Department Database (SEDD). SEDD includes patient level data on emergency department visits resulting in discharge. Data elements include all listed patient diagnoses, patient demographics (e.g., age, race, and insurance status), total charges and discharge information. We used the 2014 Florida SEDD because it had the largest volume of adult ED visits in the state dataset with a revisit variable verification rate >97% at the time of the analysis (15). This study was determined to be exempt from review by the Institutional Review Board of the Icahn School of Medicine at Mount Sinai.
The study population included ED visits with a primary diagnosis of asthma as identified by Agency for Healthcare Research and Quality’s (AHRQ) Clinical Classifications Software (CCS) codes (CCS code 128). We restricted our analyses to visits by adults (e.g., ≥ 18 years old) because the pathogenesis of childhood and adult asthma are known to be different, thus requiring different clinical approaches (16, 17). We focused on patients who were discharged because inpatient costs are not attributable to a single provider. In addition, there are established guidelines for the outpatient management of asthma in EDs (18). Given the co-occurrence of respiratory infections and acute asthma exacerbation, visits with a primary diagnosis of “Other Upper Respiratory Infections” (CCS 126), “COPD and Bronchiectasis” (CCS 127), and “Acute Bronchitis” (CCS 125) were included when there was a concurrent secondary diagnosis code for asthma. These CCS codes were selected as they were the most prevalent secondary diagnosis codes when asthma was the primary diagnosis code in a prior national analysis (accounting for 6.12%, 3.79%, and 2.93% of ED visits, respectively) (4). Finally, any visits occurring at hospitals with fewer than 30 ED visits for asthma in a year and subjects with missing charge or demographic data were excluded (0.9%).
Study outcomes and variables
We performed a descriptive analysis to identify patient and hospital predictors of ED revisits and variation in costs. Our primary outcome of interest was the association between index ED visit cost and likelihood of ED revisit within 7 days. Revisits related to asthma were identified using the same diagnostic CCS codes as listed above. We selected 7 days for our primary outcome based on prior evidence suggesting potentially avoidable ED revisits occur 3 to 9 days after the initial visit and regulatory programs include 7 days as a quality measure for unplanned hospital-based encounters (19, 20). In our preliminary analyses, we performed descriptive statistics on the distribution of revisit rates. SEDD provides data on total facility charges (i.e., amount billed by hospitals) for ED visits. Given that charges may not represent the actual expenses incurred, to estimate costs (i.e., actual expenses incurred), we use the hospital charges supplemental file and applied hospital-specific cost-to-charge ratios from HCUP to estimate cost (21, 22).
Patient and Hospital characteristics
Patient demographics included age, gender, median income of the residence zip code, and a combined variable for race and ethnicity (White, Black, Hispanic, other). Charlson comorbidity index scores were calculated from secondary ICD-9 diagnosis codes to adjust for the burden of comorbid chronic conditions among patients. Hospital characteristics included urban vs rural location and annual ED visit volume.
Statistical Methods
We performed descriptive statistics to describe patient and hospital characteristics associated with unadjusted 7-day revisit rates. The distribution of revisits and costs were assessed using histograms and scatter plots. From these graphs, we determined whether any statistical transformations would be necessary prior to performing adjusted multivariable analyses. Descriptive statistics, including median and interquartile range, were used to further characterize variability in costs. We calculated the coefficient of interquartile variation (CQV) by (23). The CQV was used to assess the extent and dispersion of variability in the distribution of charges and costs.
We then used multivariable regression to assess if there was an association between ED visit costs and the likelihood of a revisit after adjusting for patient and hospital characteristics. We adjusted for race and ethnicity as black and Hispanic patients have been shown to have more severe asthma resulting in higher utilization and worse outcomes (24). Because both costs and revisit rates are likely to be clustered within the same ED, we fit a multilevel regression model using generalized linear models with mixed effects at the level of the hospital given that standard errors are more likely to be similar for patients treated at the same hospitals (vs. patients treated at different hospitals). All analyses were performed in Stata/SE 15.1.
Results
From 8,168,641 total ED visits in Florida in 2014, we identified 54,060 index adult asthma ED visits resulting in discharge across 187 hospitals. The mean age was 41 (SD 16), 42.3% were white, and the subjects were mostly female (65.5%) (Table 1). Most of the cohort had a Charlson comorbidity score of 1–2 (85.8%). Compared to all index asthma visits discharged home, ED revisits were less frequent among female patients (56% vs 65.5%) and privately insured patients (15.4% vs 22.8%), and were more frequent among uninsured (43% vs 32.7%) and Black (40% vs 33.6%) patients. Figure 1 demonstrates the distribution of days to revisit from an index visit among all study subjects. Using a 7-day cutoff, we identified 1,670 patients (3.1% of the initial sample) who experienced an asthma-related ED revisit.
Table 1.
Patient and hospital characteristics among ED asthma discharges by index visit and those with a revisit within 7 days.
| Variables | Index ED asthma discharge | Asthma or Asthma related revisit within 7 days | ||
|---|---|---|---|---|
| (N =54,060) | (N=1,667) | |||
| No. | % | No. | % | |
| Age (SD) | 41 (16)) | N/A | 38 (14) | N/A |
| Gender | ||||
| Male | 18,673 | 34.5 | 734 | 44 |
| Female | 35,387 | 65.5 | 933 | 56 |
| Insurance | ||||
| Medicare | 8,603 | 15.9 | 190 | 11.4 |
| Medicaid | 15,452 | 28.6 | 500 | 30 |
| Private insurance | 12,321 | 22.8 | 256 | 15.4 |
| Self-Pay/No Charge/Other/Unknown | 17,684 | 32.7 | 721 | 43.3 |
| Race | ||||
| White | 22,852 | 42.3 | 654 | 39.2 |
| Black | 18,154 | 33.6 | 670 | 40.2 |
| Hispanic | 11,657 | 21.6 | 308 | 18.5 |
| Other/Unknown | 1,397 | 2.6 | 35 | 2.1 |
| Charlson Score Groups | ||||
| Score 0 | 0 | 0 | 0 | 0 |
| Score 1 or 2 (1) | 46,373 | 85.8 | 1,443 | 86.6 |
| Score 3 or more (2) | 7,687 | 14.2 | 224 | 13.4 |
| Hospital Type | ||||
| Private Hospital | 21,218 | 39.3 | 667 | 40 |
| Urban Hospital | 32,211 | 59.6 | 969 | 58.1 |
| Rural Hospital | 631 | 1.2 | 31 | 1.9 |
| Median household income national quartile for patient ZIP Code | ||||
| Quartile 1 | 27,866 | 51.6 | 893 | 53.6 |
| Quartile 2 | 16,459 | 30.5 | 489 | 29.3 |
| Quartile 3 | 6,581 | 12.2 | 192 | 11.5 |
| Quartile 4 | 2,077 | 3.8 | 51 | 3.1 |
| Missing | 1,077 | 2.0 | 42 | 2.5 |
| Average Annual Total ED Visit Volume per Hospital | 85,086 | 85,085 | ||
| Median charge at index visit | $2,952 | $2,839 | ||
| Median cost at index visitⱡ | $597 | $572 | ||
Costs were calculated as a function of charge using hospital specific cost-to-charge ratios provided by the Healthcare Cost and Utilization Project.
Figure. 1.
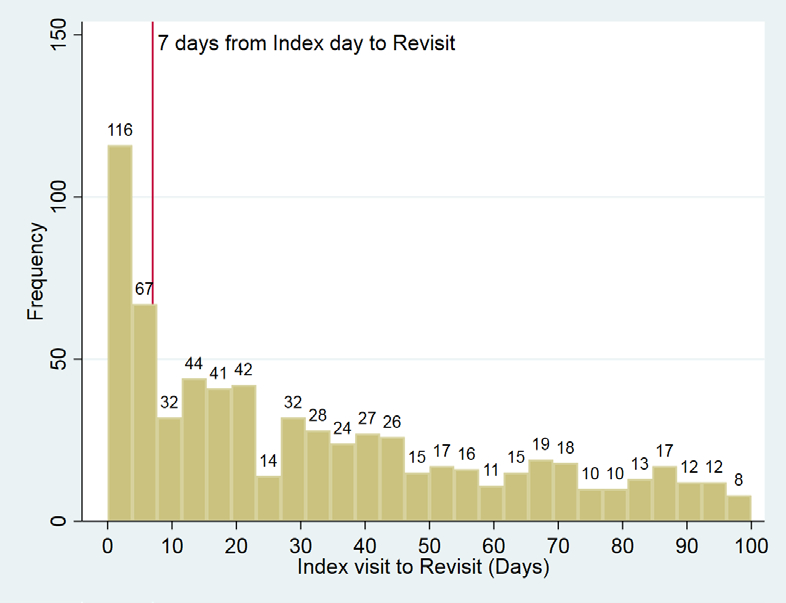
Distribution of ED Revisits by Days after Index Discharge
For the index visit, median charge and cost were $2,952 (IQR: $1774–4841) and $597 (IQR: $371–980) respectively. For patients revisiting the ED, median charge and cost at the index visit were $2,839 (IQR: $1704–4598) and $572 (IQR: $351–971) respectively. Slightly over 20% of patients incurred costs more than $1000. The coefficient of quartile variation on the index ED visit was 46 and 45 for charges and cost, respectively.
In the simple logistic model adjusting for patient and hospital characteristics, Black patients (OR = 1.20 ; 95% CI 1.07–1.34), those with Medicaid insurance (OR = 1.23 ; 95% CI 1.00–1.51), self-pay/unknown (OR = 1.46 ; 95% CI: 1.20–1.78), and index ED visits occurring at a rural, non-profit hospital (OR = 1.57 ; 95% CI 1.08–2.27) were associated with higher odds of 7-day ED revisit (Table 2). Female patients (OR = 0.71; 95% CI 0.65–0.79), older age (OR 0.99; 95% CI 0.987–0.995) and those with private insurance (OR = 0.79; 95% CI 0.64–0.98) had lower odds of 7-day revisits. After additionally adjusting for clustering by hospital site, uninsured patients were still more likely to experience 7-day ED revisits (OR = 1.42; 95% CI 1.18–1.71), while female patients (OR = 0.72, 95% CI 0.65–0.80), older age (OR 0.99; 95% CI 0.986–0.994), and privately insured patients (OR = 0.79, 95% CI 0.64–0.97) continued to be have lower odds of revisit. There was no association between initial ED visit cost and revisit rate after adjusting for both patient and hospital characteristics (OR = 1.00 ; 95% CI 1.00–1.00, Table 2).
Table 2.
Visit-level association between ED cost and likelihood of revisit adjusting for patient and hospital characteristics.
| Multivariable logistic regression | Multilevel regression with generalized linear models | |||
|---|---|---|---|---|
| Variable | OR | 95% CI | OR | 95% CI |
|
| ||||
| Cost | 1.00 | 1.00–1.00 | 1.00 | 1.00–1.00 |
| Age | 0.99* | 0.987–0.995 | 0.99* | 0.986—0.994 |
| Female | 0.71* | 0.65 – 0.79 | 0.72* | 0.65–0.80 |
| Insurance | ||||
| Medicare | ref | ref | ref | ref |
| Medicaid | 1.23* | 1.00–1.51 | 1.21 | 0.997–1.47 |
| Private | 0.79* | 0.64–0.98 | 0.79* | 0.64–0.97 |
| Self-pay, other, unknown | 1.46* | 1.20–1.78 | 1.42* | 1.18–1.71 |
| Race | ||||
| White | Ref | ref | ref | ref |
| Black | 1.20* | 1.07–1.34 | 1.12 | 0.997–1.27 |
| Hispanic | 0.90 | 0.78–1.03 | 0.89 | 0.77–1.03 |
| Other / Unknown | 0.82 | 0.58–1.16 | 0.82 | 0.58–1.16 |
| Charlson Score Group ⱡ | ||||
| Score 1–2 | Ref | ref | ref | ref |
| Score 3+ | 1.02 | 0.88–1.18 | 1.03 | 0.89–1.21 |
| Hospital type | ||||
| For profit | Ref | ref | ref | ref |
| Non-profit urban | 0.92 | 0.83–1.03 | 0.88 | 0.75–1.04 |
| Non-profit rural | 1.57* | 1.08–2.27 | 1.58 | 0.99–2.52 |
| Median household income * | ||||
| Quartile 1 | Ref | ref | ref | ref |
| Quartile 2 | 0.98 | 0.87–1.09 | 1.01 | 0.90–1.14 |
| Quartile 3 | 1.02 | 0.87–1.20 | 1.06 | 0.90–1.23 |
| Quartile 4 | 0.94 | 0.70–1.25 | 0.94 | 0.70–1.26 |
| Missing | 1.24 | 0.90–1.70 | 1.32 | 0.96–1.81 |
| Hospital volume | 1.00 | 1.00–1.00 | 1.00 | 1.00–1.000 |
- p < 0.05
- Patients could not have a Charlson score of 0 as everyone in the study cohort has a designation of chronic pulmonary disease.
Discussion
In this analysis, we observed variation in costs for an ED asthma discharges and no association between cost and ED revisit rate. Rather we observed associations between revisit rates and patient characteristics, including age, gender, and insurance status, that persisted after adjusting for confounders.
The lack of an association between cost and ED revisit rate suggests an opportunity to improve value among the subset of facilities with high charges and no difference in revisit outcomes. Cost variation among ED asthma discharges is likely driven by variation in hospital facility fees, which have been shown to vary widely across institutions and have been implicated as a major driver of ED charges (25, 26). Prior studies have demonstrated wide variation in costs and charges related to care for emergency medical conditions (26–28). Our findings are consistent with prior work demonstrating little association between overall health care costs and outcomes (13, 29, 30) with one recent exception relevant to emergency care, which suggested that Medicare patients transported by EMS to higher cost hospitals have lower mortality (31). Payment reform programs like episode-based measures mandated by the QPP are intended to drive value by improving quality while reducing costs. Clinician quality and cost scores achieved in the QPP are used to adjust their total Medicare reimbursement as mandated by federal law. Initially, QPP scores were based primarily on quality; however, the quality category receives lower weight over time, while the cost category increases so that by 2022, each is weighted at 30% (32). Therefore, while clinicians would maximize their reimbursement by achieving high quality and low cost, it is possible for some clinicians to have significantly lower costs and average or below-average quality and still receive QPP scores that quality for financial incentives.
Our findings demonstrate that lack of insurance had the largest magnitude association with ED revisits after adjusting for patient and hospital factors. While this finding is unsurprising given the barriers to obtaining prescribed medications and follow-up care among the uninsured, it suggests that ED revisits for asthma may be less of an indicator of quality and more of an indicator of the patient population served by the ED. Thus, payment programs based on outcomes that do not consider socioeconomic drivers of health outside of health care providers’ control may result in unintended consequences, as observed in the disproportionately higher financial penalties experienced by safety-net facilities as a consequence of the Hospital Readmissions Reduction Program (which then further reduce the resources and capacity for safety-net facilities to improve quality) (33, 34).
We also found that younger, male patients had higher odds of revisit, consistent with prior studies (9, 35, 36). While female asthma patients tend to have higher severity disease, they may also be more likely to report a usual source of care and follow up (37), which may reduce the likelihood of an ED revisit. While older patients tend to be sicker and have higher acute care needs; however, older patients are also more likely to have Medicare, which likely provides improved access to prescriptions and outpatient care compared to Medicaid or no insurance. Targeted interventions to improve care transitions for these higher risk subgroups - such as appropriate use of steroids, providing patients with inhalers on ED discharge or engaging in patient education – may improve care transitions and long-term asthma management (38–40).
Our findings have several limitations common to administrative datasets. First, we were not able to access information on the severity of clinical presentation, such as vital signs and respiratory status, which might drive both revisits and resource expenditures; however, this is mitigated in part by selecting a subset of patients who were discharged to home. Secondly, we could not measure patient-centered outcomes such as symptom improvement. Further some ED revisits are due to natural progression of disease and adherence to appropriate return precautions, and thus do not necessarily represent adverse outcomes. However, there are no validated measures to capture symptom improvement and revisit rate has been identified as a patient-centered adverse outcome (41). Our dataset may have limited national generalizability given that we restricted our analysis to the state of Florida in 2014; however, Florida is the third most populous state in the US and has a high diversity index (42). Further, as previously discussed, Florida is the only state with a high verification (>97%) of the ED revisit variable at the time of the analysis (15). Finally, the charge-to-cost ratio only accounts for facility fees and excludes any professional fees involved in an episode of care. While we likely underestimated the costs for an episode of care, the facility fees have historically exceeded the professional fees and likely represent most of the costs.
Conclusion
There is variability in the costs and revisits for asthma across emergency departments. Increased costs do not appear to have a meaningful impact on short-term future healthcare utilization. However, female sex, older age, and lack of private insurance were associated with a higher adjusted odds of a subsequent ED revisit. While reducing variation in costs is an opportunity to improve value, the implementation of value-based payment programs should consider the unintended consequences these policies may have on EDs who disproportionately serve high-cost, high-need populations.
Funding:
Dr. Casey was supported by a Visiting Scholar Award from the American Board of Medical Specialties, Chicago, IL. Dr. Lin’s effort was supported by funding from the National Heart, Lung, Blood Institute (NHLBI/ NIH K23-HL143042).
Footnotes
Competing Interests: The authors report no conflicts of interest
References.
- [1].Most Recent National Asthma Data. Centers for Disease Control. https://www.cdc.gov/asthma/most_recent_national_asthma_data.htm. Last accessed November 11, 2019/.
- [2].Nurmagambetov T, Kuwahara R, Garbe P. The Economic Burden of Asthma in the United States, 2008–2013. Annals of the American Thoracic Society. 2018;15:348–56. [DOI] [PubMed] [Google Scholar]
- [3].Ginde AA, Espinola JA, Camargo CA Jr. Improved overall trends but persistent racial disparities in emergency department visits for acute asthma, 1993–2005. The Journal of allergy and clinical immunology. 2008;122:313–8. [DOI] [PMC free article] [PubMed] [Google Scholar]
- [4].Lin MP, Vargas-Torres C, Schuur JD, Shi D, Wisnivesky J, Richardson LD. Trends and predictors of hospitalization after emergency department asthma visits among U.S. Adults, 2006–2014. The Journal of asthma : official journal of the Association for the Care of Asthma. 2019:1–9. [DOI] [PMC free article] [PubMed] [Google Scholar]
- [5].Villa-Roel C, Nikel T, Ospina M, Voaklander B, Campbell S, Rowe BH. Effectiveness of Educational Interventions to Increase Primary Care Follow-up for Adults Seen in the Emergency Department for Acute Asthma: A Systematic Review and Meta-analysis. Academic emergency medicine : official journal of the Society for Academic Emergency Medicine. 2016;23:5–13. [DOI] [PubMed] [Google Scholar]
- [6].Appendix B. ACEP CEDR QCDR Measure Information. American College of Physicians. www.acep.org. Last accessed November 2016/. [Google Scholar]
- [7].Guttmann A, Zagorski B, Austin PC, et al. Effectiveness of emergency department asthma management strategies on return visits in children: a population-based study. Pediatrics. 2007;120:e1402–10. [DOI] [PubMed] [Google Scholar]
- [8].Walsh-Kelly CM, Kelly KJ, Drendel AL, Grabowski L, Kuhn EM. Emergency department revisits for pediatric acute asthma exacerbations: association of factors identified in an emergency department asthma tracking system. Pediatric emergency care. 2008;24:505–10. [DOI] [PubMed] [Google Scholar]
- [9].Duseja R, Bardach NS, Lin GA, et al. Revisit rates and associated costs after an emergency department encounter: a multistate analysis. Annals of internal medicine. 2015;162:750–6. [DOI] [PubMed] [Google Scholar]
- [10].Rowe BH, Villa-Roel C, Sivilotti ML, et al. Relapse after emergency department discharge for acute asthma. Academic emergency medicine : official journal of the Society for Academic Emergency Medicine. 2008;15:709–17. [DOI] [PubMed] [Google Scholar]
- [11].Duseja R, Andress J, Sandhu A, et al. Development of Episode-Based Cost Measures for the US Medicare Merit-based Incentive Payment System. JAMA Health Forum. 2021;2:e210451. [DOI] [PubMed] [Google Scholar]
- [12].Wang T, Srebotnjak T, Brownell J, Hsia RY. Emergency department charges for asthma-related outpatient visits by insurance status. Journal of health care for the poor and underserved. 2014;25:396–405. [DOI] [PMC free article] [PubMed] [Google Scholar]
- [13].Hussey PS, Wertheimer S, Mehrotra A. The association between health care quality and cost: a systematic review. Annals of internal medicine. 2013;158:27–34. [DOI] [PMC free article] [PubMed] [Google Scholar]
- [14].CMS. Quality Payment Program: Episode-Based Cost Measures Field Testing Wave 4 Measure Development Process https://www.cms.gov/files/document/wave-4-measure-development-process-macra.pdf. Last accessed July 22/2022.
- [15].User Guide: HCUP Supplemental Variables For Revisit Analyses. Healthcare Cost and Utilization Project https://hcup-us.ahrq.gov/toolssoftware/revisit/UserGuide-SuppRevisitFilesCD.pdf. Last accessed July 25, 2022/.
- [16].Larsen GL. Differences between adult and childhood asthma. The Journal of allergy and clinical immunology. 2000;106:S153–7. [DOI] [PubMed] [Google Scholar]
- [17].Trivedi M, Denton E. Asthma in Children and Adults-What Are the Differences and What Can They Tell us About Asthma? Front Pediatr. 2019;7:256. [DOI] [PMC free article] [PubMed] [Google Scholar]
- [18].Hasegawa K, Tsugawa Y, Clark S, et al. Improving Quality of Acute Asthma Care in US Hospitals: Changes Between 1999–2000 and 2012–2013. Chest. 2016;150:112–22. [DOI] [PMC free article] [PubMed] [Google Scholar]
- [19].Enard KR, Ganelin DM. Reducing preventable emergency department utilization and costs by using community health workers as patient navigators. J Healthc Manag. 2013;58:412–27; discussion 28. [PMC free article] [PubMed] [Google Scholar]
- [20].CMS.gov. Unplanned hospital visits. https://data.cms.gov/provider-data/topics/hospitals/unplanned-hospital-visits/. Last accessed July 22/2022.
- [21].Kaufman E, Rising K, Wiebe DJ, Ebler DJ, Crandall ML, Delgado MK. Recurrent violent injury: magnitude, risk factors, and opportunities for intervention from a statewide analysis. The American journal of emergency medicine. 2016;34:1823–30. [DOI] [PMC free article] [PubMed] [Google Scholar]
- [22].Finkler SA. The distinction between cost and charges. Annals of internal medicine. 1982;96:102–9. [DOI] [PubMed] [Google Scholar]
- [23].Bonett DG. Confidence interval for a coefficient of quartile variation. Computational Statistics & Data Analysis. 2006;50:2953–7. [Google Scholar]
- [24].Tschudy MM, Cheng TL. The “Black Box” of Racial Disparities in Asthma. JAMA Pediatr. 2016;170:644–5. [DOI] [PubMed] [Google Scholar]
- [25].Kliff S I read 1,182 emergency room bills this year. Here’s what I learned. https://www.vox.com/health-care/2018/12/18/18134825/emergency-room-bills-health-care-costs-america. Last accessed April/2021. [Google Scholar]
- [26].Hsia RY, Akosa Antwi Y. Variation in charges for emergency department visits across California. Ann Emerg Med. 2014;64:120–6, 6 e1–4. [DOI] [PMC free article] [PubMed] [Google Scholar]
- [27].Xu T, Park A, Bai G, et al. Variation in Emergency Department vs Internal Medicine Excess Charges in the United States. JAMA Intern Med. 2017;177:1139–45. [DOI] [PMC free article] [PubMed] [Google Scholar]
- [28].Vashi AA, Urech T, Carr B, et al. Identification of Emergency Care-Sensitive Conditions and Characteristics of Emergency Department Utilization. JAMA Netw Open. 2019;2:e198642. [DOI] [PMC free article] [PubMed] [Google Scholar]
- [29].Solberg LI, Lyles CA, Shore AD, Lemke KW, Weiner JP. Is quality free? The relationship between cost and quality across 18 provider groups. Am J Manag Care. 2002;8:413–22. [PubMed] [Google Scholar]
- [30].Starfield B, Powe NR, Weiner JR, et al. Costs vs quality in different types of primary care settings. JAMA. 1994;272:1903–8. [PubMed] [Google Scholar]
- [31].Doyle J, Graves J, Gruber J, Kleiner S. Measuring Returns to Hospital Care: Evidence from Ambulance Referral Patterns. J Polit Econ. 2015;123:170–214. [DOI] [PMC free article] [PubMed] [Google Scholar]
- [32].CMS. Cost Performance Category: Traditional MIPS Requirements. https://qpp.cms.gov/mips/cost. Last accessed July 22/2022.
- [33].Figueroa JF, Joynt KE, Zhou X, Orav EJ, Jha AK. Safety-net Hospitals Face More Barriers Yet Use Fewer Strategies to Reduce Readmissions. Med Care. 2017;55:229–35. [DOI] [PMC free article] [PubMed] [Google Scholar]
- [34].Banerjee S, Paasche-Orlow MK, McCormick D, Lin MY, Hanchate AD. Readmissions performance and penalty experience of safety-net hospitals under Medicare’s Hospital Readmissions Reduction Program. BMC Health Serv Res. 2022;22:338. [DOI] [PMC free article] [PubMed] [Google Scholar]
- [35].de Gelder J, Lucke JA, de Groot B, et al. Predictors and Outcomes of Revisits in Older Adults Discharged from the Emergency Department. J Am Geriatr Soc. 2018;66:735–41. [DOI] [PubMed] [Google Scholar]
- [36].LaCalle E, Rabin E. Frequent users of emergency departments: the myths, the data, and the policy implications. Ann Emerg Med. 2010;56:42–8. [DOI] [PubMed] [Google Scholar]
- [37].Thompson AE, Anisimowicz Y, Miedema B, Hogg W, Wodchis WP, Aubrey-Bassler K. The influence of gender and other patient characteristics on health care-seeking behaviour: a QUALICOPC study. BMC Fam Pract. 2016;17:38. [DOI] [PMC free article] [PubMed] [Google Scholar]
- [38].Press VG, Arora VM, Trela KC, et al. Effectiveness of Interventions to Teach Metered-Dose and Diskus Inhaler Techniques. A Randomized Trial. Annals of the American Thoracic Society. 2016;13:816–24. [DOI] [PMC free article] [PubMed] [Google Scholar]
- [39].Abaya R, Delgado EM, Scarfone RJ, et al. Improving efficiency of pediatric emergency asthma treatment by using metered dose inhaler. The Journal of asthma : official journal of the Association for the Care of Asthma. 2018:1–8. [DOI] [PubMed] [Google Scholar]
- [40].Hall AB, Novotny A, Bhisitkul DM, Melton J, Regan T, Leckie M. Association of emergency department albuterol dispensing with pediatric asthma revisits and readmissions. The Journal of asthma : official journal of the Association for the Care of Asthma. 2017;54:498–503. [DOI] [PubMed] [Google Scholar]
- [41].Research AFHQa. Improving the Emergency Department Discharge Process: Environmental Scan Report Improving the Emergency Department Discharge Process:Environmental Scan Report. Last accessed April/2021. [Google Scholar]
- [42].United States Census Bureau: Florida Was Third-Largest State in 2020 With Population of 21.5 Million. https://www.census.gov/library/stories/state-by-state/florida-population-change-between-census-decade.html. Last accessed Aug 16/2022.