. 2022 Oct 12;11:e74270. doi: 10.7554/eLife.74270

Figure 4. Axon orientation profiling reveals increased posterior directionality of peripheral axons in klc4uw314 mutants.

(A–B) A representative region of axon analysis for a 24 hpf wild type (A) and klc4uw314 (B) embryo. The axons are color coded for directionality according to the legend in the upper left corner of (A). (C) Plot of axon directionality in 24 hpf wild type (green) and klc4uw314 mutants (magenta). (D) Axon directionality data was normalized to total signal and posterior angles are displayed to compare directional bias. Area under the curve was measured for shaded area and tested for statistical significance using a t-test. **P=0.0047. For (C–D), error bars = 95% CI. Wild type N=40 embryos, klc4uw314 N=23 embryos.

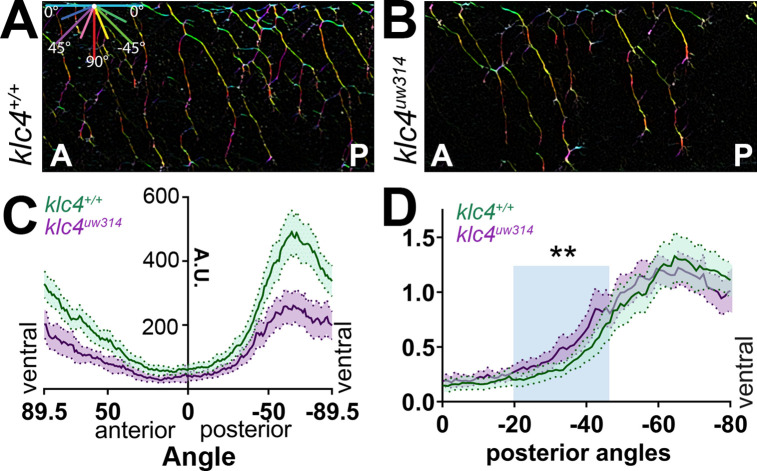
Figure 4—source data 1. Histogram of the axon signal at each angle for wild type and klc4uw314 mutant axons, used to generate directional distribution plots.
Figure 4—source data 2. Histogram data in Source Data 1 that has been normalized to the total axon signal present in the sample.
Presented as a percentage of total signal.

Figure 4.

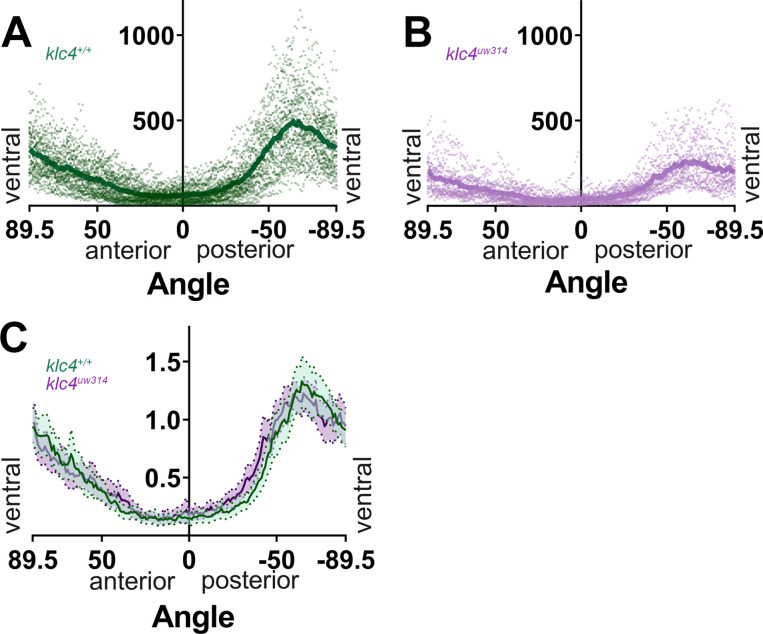
Figure 4—figure supplement 1. Additional data for branch directionality profiling.

Figure 4—figure supplement 1.

(A) All individual data points for the 40 wild-type embryos analyzed (dots), with the mean overlayed (dark green line). (B) All individual data points for the 23 klc4uw314 mutant embryos analyzed (dots), with the mean overlayed (magenta line). (C) Axon directionality data normalized to total signal with posterior and anterior data displayed. Error bars = 95% CI.