. 2022 Oct 12;11:e74270. doi: 10.7554/eLife.74270

Figure 8. Endosomal trafficking dynamics are disrupted in klc4314 mutants.

(A) Live RB neuron expressing eGFP-Rab5c. Scale bar = 10 μm. (A’) Representative kymograph of axon segment boxed in magenta in (A).(B) Percentage of anterogradely moving vesicles out of all motile Rab5 vesicles in peripheral axons. The proportion of anterogradely moving vesicles is decreased in klc4314 mutants, *p=0.0372 by Mann-Whitney test; error bars = mean with SD. Wild type N=15 embryos, klc4314 N=15 embryos. (C) Average Rab5 vesicle run length and maximum anterograde vesicle run length in peripheral axons. *p=0.0358, ns p=0.5359, Mann-Whitney test. (D) Rab5 vesicle velocity in peripheral axons. NS by Mann-Whitney test (anterograde p=0.6505, retrograde p=0.0792), wild type N=12 embryos, klc4314 N=11 embryos. For all data, one neuron per embryo was analyzed. Error bars in box and whisker plots represent 5-95th percentile.

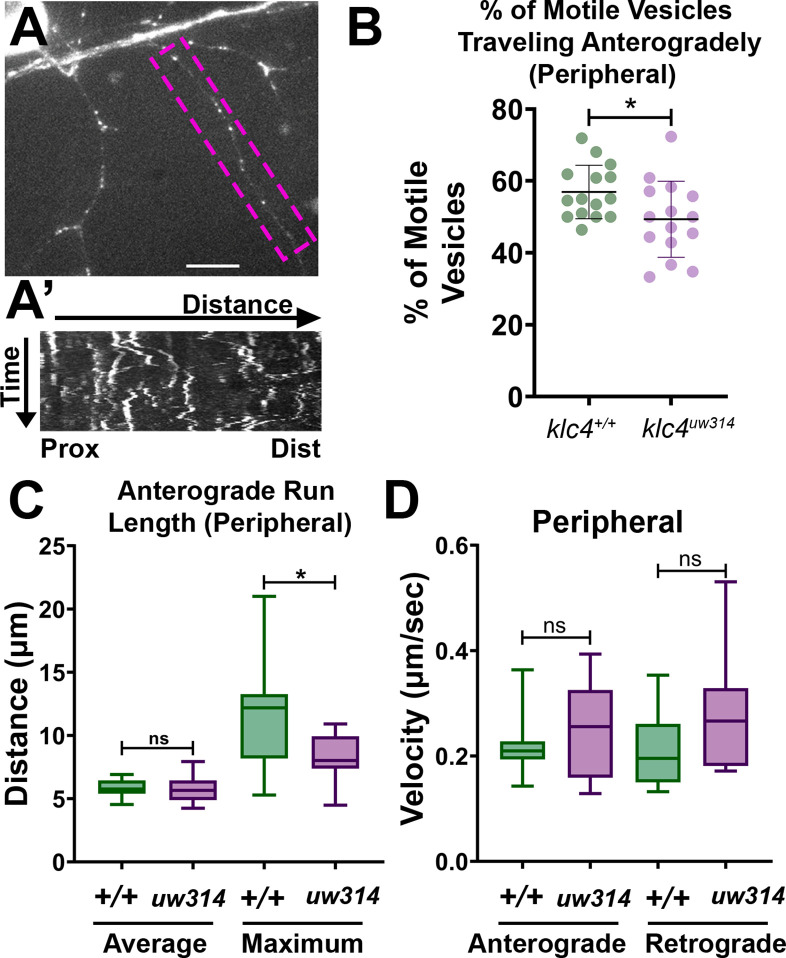
Figure 8—source data 1. The percentage of motile vesicles per cell that were traveling anterogradely in peripheral RB axon branches.
Figure 8—source data 2. The distance traveled by Rab5 comets, including both average and maximum run length.
Figure 8—source data 3. The measured velocity of Rab5 comets in peripheral axons.

Figure 8.

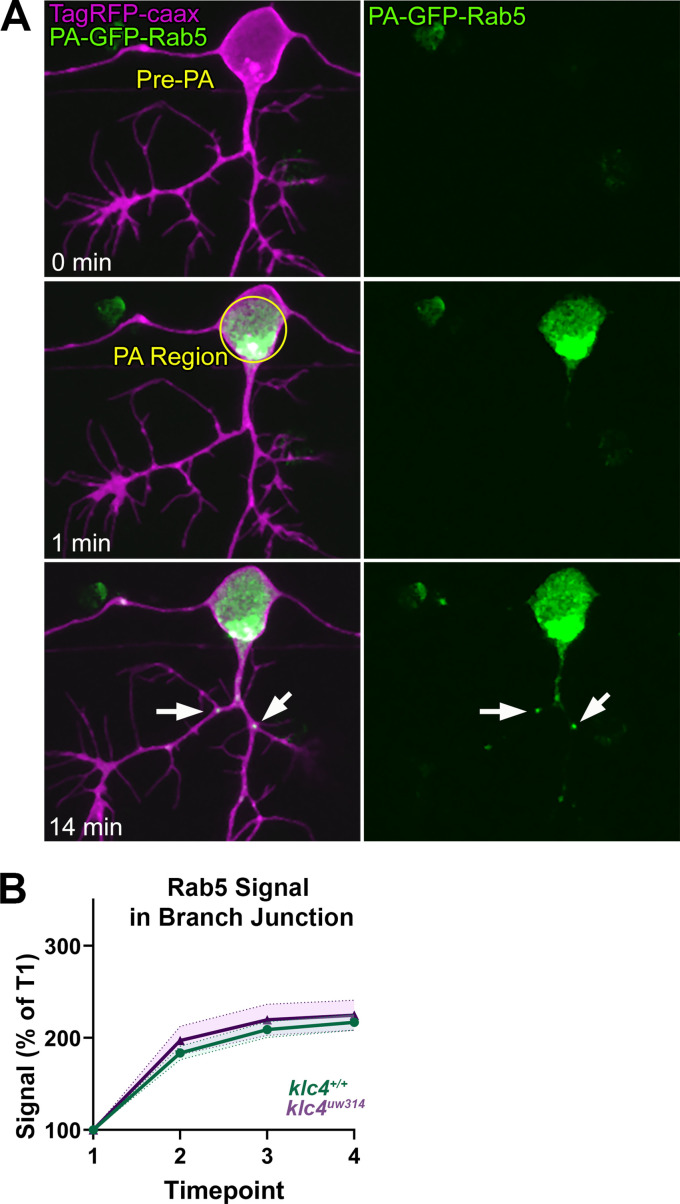
Figure 8—figure supplement 1. Vesicles labeled with photoactivatable Rab5 accumulate normally at branch points.

Figure 8—figure supplement 1.

(A) Representative image series of PA-GFP-Rab5 photoactivation. A region outlining the cell body is selected and photoactivated using a 405 nm laser (middle panel). Rab5 vesicles can then be visualized moving into the axon and into branch points (lower panel). (B) We quantified the accumulation of Rab5 at branch points by dividing the acquired images into 4 time periods (t1–t4) comprised of 7–8 min intervals and measuring the signal at branch points from maximum intensity projections of each time period (t1–t4). Signal was normalized to the signal at t1. There was no significant difference in the area under the curve between klc4+/+ and klc4uw314 mutants (p=0.1319, t-test, klc4+/+ N = 42 branches from 20 embryos, klc4uw314 N=18 branches from 8 embryos). Error bars = SEM.
Figure 8—video 1. An RB neuron expressing photoactivatable Rab5 (green) and membrane-bound TagRFP (magenta).
Download video file (2.2MB, mp4)
Upon photoactivation, vesicles can be seen traveling into the peripheral axons. The second half of the movie shows the maximum intensity projections of time intervals (T1-4) used to analyze vesicle accumulation at branch points. Each time interval represents a maximum intensity projection of 6.5 minutes of time. T0 represents the frame prior to photoactivation.