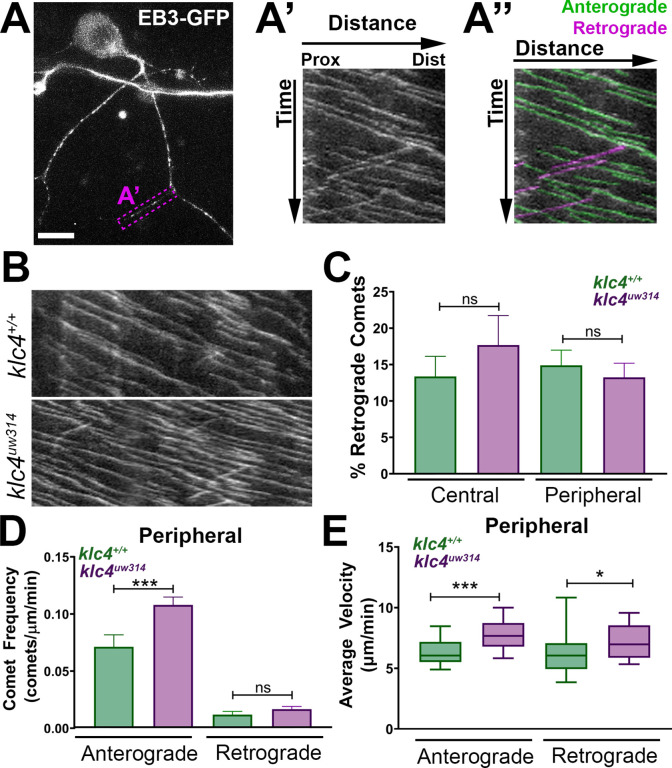
Figure 9. Microtubule dynamics are increased in klc4uw314 mutants.
(A-A”) Live RB neuron expressing EB3-GFP, scale bar = 10 μm. Magenta box in (A) indicates axon segment selected for kymograph in (A’). (A”) EB3 comets identified as anterogradely (green) or retrogradely (magenta) directed based on their angle. (B) Representative kymographs from peripheral axon segments of wildtype (top) or klc4uw314 (bottom). (C) Quantification of the percentage of retrograde comets out of all comets imaged for both peripheral and central axons. NS by Mann-Whitney test. (D) Peripheral axon comet frequency. ***p=0.0003, Mann-Whitney test. (E) Peripheral axon comet velocity. ***p=0.0004, *p=0.042, Mann-Whitney test. For all data, error bars = SEM. Wild type central N=8 segments, klc4uw314 central N=15 segments, Wild type peripheral N=26 segments, klc4uw314 peripheral N=48 segments. Wild type data from 10 neurons in 7 embryos. Klc4uw314 data from 13 neurons in 8 embryos. All comets in a kymograph were measured.


