

Abstract
Background
Although numerous studies have shown that the expression and activation of TRPV1 have an important role in cancer development, a comprehensive exploration of associations between TRPV1 expression and tumor proliferation, microenvironment, and clinical outcomes in pan-cancer remains insufficient.
Methods
From The Cancer Genome Atlas (TCGA) program, we downloaded multiomics data of ten cancer cohorts and investigated the correlations between TRPV1 expression and immune signatures' enrichment, stromal content, genomic features, oncogenic signaling, and clinical features in these cancer cohorts and pan-cancer.
Results
Elevated expression of TRPV1 correlated with better clinical outcomes in pan-cancer and diverse cancer types. In multiple cancer types, TRPV1 expression correlated negatively with the expression of tumor proliferation marker genes (MKI67 and RACGAP1), proliferation scores, cell cycle scores, stemness scores, epithelial-mesenchymal transition scores, oncogenic pathways' enrichment, tumor immunosuppressive signals, intratumor heterogeneity, homologous recombination deficiency, tumor mutation burden, and stromal content. Moreover, TRPV1 expression was downregulated in late-stage versus early-stage tumors. In breast cancer, bladder cancer, and low-grade glioma, TRPV1 expression was more inferior in invasive than in noninvasive subtypes. Pathway analysis showed that the enrichment of cancer-associated pathways correlated inversely with TRPV1 expression levels.
Conclusion
TRPV1 upregulation correlates with decreased tumor proliferation, tumor driver gene expression, genomic instability, and tumor immunosuppressive signals in various cancers. Our results provide new understanding of the role of TRPV1 in both cancer biology and clinical practice.
1. Introduction
Ion channels are important in modulating a variety of biological processes, such as intracellular calcium (Ca2+) functioning in regulating cell motility, cell cycle, and apoptosis [1] and potassium (K+) channels modifying cell proliferation, cell migration, invasion, and apoptosis [2]. Ion channels are potential pharmacological targets for cancer treatment for their essential roles in tumor development, proliferation, and invasion [3, 4]. The nonselective cation channel TRPV1 (transient receptor potential cation channel subfamily V member 1) plays significant roles in cancer onset and advancement [5, 6]. TRPV1 was first discovered in 1997 and was defined as a pain and heat receptor [7]. It can be activated by a variety of factors, including capsaicin [7], lipopolysaccharides [8], vanilloids [9], heat [9], protons [9], phosphoinositide 4,5-bisphosphate [10], vitamin D [11], and Toll-like receptor 4 [12]. TRPV1 is also activated in a variety of cancers, such as tongue squamous cell cancer [13], pancreatic cancer [14], breast cancer [15], and prostate cancer [16]. Nevertheless, some studies have revealed a tumor suppressor role of TRPV1 in various cancers. For example, TRPV1 activation can reduce glioma expansion and prolong survival of glioma patients [17]. TRPV1 can inhibit the development of gastric cancer, and its downregulation is associated with poor survival in gastric cancer [18]. TRPV1 can downregulate EGFR levels by inducing EGFR ubiquitination and degradation, thereby inhibiting the EGFR/MAPK signaling in pancreatic cancer cells [19]. In clear cell renal cell carcinoma (ccRCC), TRPV1 expression is associated with immune infiltration and inhibits the progression of ccRCC [20]. The expression and activation of TRPV1 can activate protein tyrosine phosphatase 1B (PTP1B) to inhibit EGFR-associated intestinal tumorigenesis [21]. TRPV1 overexpression can activate p53 and induce apoptosis to inhibit tumor proliferation in melanoma [22].
Although these prior studies have revealed the diverse roles of TRPV1 in cancer, a systematic investigation of its associations with various clinical and molecular features in pan-cancer remains insufficient. To fill this research gap, we explored correlations of TRPV1 expression with immune signatures' enrichment, progression phenotypes, and clinical outcomes in ten cancer types from The Cancer Genome Atlas (TCGA) program. This study is aimed at furnishing novel insights into the role of TRPV1 in both cancer biology and clinical practice.
2. Materials and Methods
2.1. Datasets
We downloaded the data of transcriptomes (RSEM normalized), somatic mutations, and clinical information for ten TCGA cancer cohorts from the GDC database (https://portal.gdc.cancer.gov/). All gene expression values were transformed by log2(x + 1) before subsequent analyses. The ten cancer types included brain lower grade glioma (LGG), head and neck squamous cell carcinoma (HNSC), lung adenocarcinoma (LUAD), breast invasive carcinoma (BRCA), stomach adenocarcinoma (STAD), pancreatic adenocarcinoma (PAAD), liver hepatocellular carcinoma (LIHC), bladder urothelial carcinoma (BLCA), cervical squamous cell carcinoma and endocervical adenocarcinoma (CESC), and skin cutaneous melanoma (SKCM). We summarized these datasets in Supplementary Table S1. We also downloaded subtype-related data from TCGA with the R function “TCGAquery_subtype” in the R package “TCGAbiolinks” [23].
2.2. Calculation of the Enrichment Scores of Immune-Related Signatures, Phenotypes, and Cancer-Related Pathways
We calculated the enrichment score of an immune-related signature, tumor phenotype, or cancer-related pathway in a tumor sample by the ssGSEA algorithm [24] based on the expression profiles of their marker or pathway gene sets. We presented these gene sets in Supplementary Table S2.
2.3. Quantification of Tumor Purity and Stromal Components
We quantified tumor purity and stromal components for each tumor with the ESTIMATE algorithm [25] with the input of gene expression profiles.
2.4. Quantification of Tumor Mutation Burden (TMB), Homologous Recombination Deficiency (HRD), and Intratumor Heterogeneity (ITH)
A tumor's TMB was defined as its total number of somatic mutations. The HRD scores of TCGA cancers were obtained from a previous publication [26]. We used the DEPTH algorithm [27] to evaluate ITH.
2.5. Survival Analysis
We compared the survival rates between different subgroups of cancer patients. A total of four endpoints were compared, including overall survival (OS), disease-free survival (DFS), disease-specific survival (DSS), and progression-free interval (PFI). We plotted the Kaplan−Meier survival curves to exhibit the differences in survival rates. The log-rank test was used to assess the significance of survival differences. We utilized the R package “survival” to perform survival analyses.
2.6. Identification of an Interaction Network of TRPV1
The interaction network of TRPV1 was identified by BioGRID [27] with the default parameters in the tool.
2.7. Pathway Analysis
Based on TRPV1 expression levels, we defined the high-TRPV1-expression-level (upper third) and low-TRPV1-expression-level (bottom third) subgroups in pan-cancer. We first identified differentially expressed genes with a threshold of fold change (FC) > 1.5 and the false discovery rate (FDR) < 0.05. We then selected the 500 upregulated genes in high-TRPV1-expression-level tumors and the 500 upregulated genes in low-TRPV1-expression-level tumors with the smallest FDRs. We input both sets of genes into the GSEA web tool [26] to identify the pathways significantly associated with them, respectively, with a threshold of FDR < 0.05.
2.8. Statistical Analysis
We performed two-class comparisons using Student's t-test for normally distributed data. Pearson's or Spearman's correlation test was used to evaluate the correlation between two variables. In analyzing correlations between TRPV1 expression levels and the enrichment scores of tumor immunosuppressive signatures, tumor stemness, epithelial-mesenchymal transition (EMT), and cancer-related pathways, tumor purity, and stromal scores, we used Spearman's correlation test and reported correlation coefficients (ρ). We used Pearson's correlation test, to analyze correlations between TRPV1 expression levels and the expression levels of a single gene and the ratios of immune signatures, and reported correlation coefficients (r). We employed the Benjamini and Hochberg method [28] to calculate the FDR to correct p values in multiple tests.
3. Results
3.1. TRPV1 Expression Is Negatively Associated with Tumor Proliferation, EMT, Stemness, and Oncogenic Signatures in Cancer
Sustaining proliferative signaling and enabling replicative immortality are two hallmarks of cancer [29]. Notably, TRPV1 expression had a negative correlation with the expression of MKI67, a marker for cell proliferation [28], in pan-cancer (p = 3.04 × 10−93; r = −0.28) and in five cancer types (p < 0.05) (Figure 1(a)). Moreover, TRPV1 expression correlated negatively with the expression of RACGAP1, another marker for cell proliferation [30], in pan-cancer (p = 5.80 × 10−98; r = −0.29) as well as in five cancer types (p < 0.001) (Figure 1(a)). We further analyzed the expression correlation of TRPV1 with a proliferation signature, which involves seven marker genes (CCNB1, CDC20, CDKN3, CDK1, MAD2L1, PRC1, and RRM2) [31]. Again, their correlation was significant and negative in pan-cancer (p = 2.20 × 10−98; ρ = −0.29) and in five cancer types (p < 0.001) (Figure 1(b)). Likewise, TRPV1 expression levels also displayed a significant inverse correlation with cell cycle scores in pan-cancer (p = 9.75 × 10−71; ρ = −0.24) and in six cancer types (p < 0.01) (Figure 1(c)).
Figure 1.

Correlations of TRPV1 expression with tumor proliferation, stemness, EMT, and oncogenic signaling. Significant negative correlations of TRPV1 expression levels with MKI67 expression levels and RACGAP1 expression levels (a), proliferation scores (b), tumor stemness scores (c), cell cycle scores (d), EMT scores (e), and the enrichment of five oncogenic pathways (f) in pan-cancer and multiple cancer types. Pearson's or Spearman's correlation test p value <0.05 indicates a significant correlation; the correlation coefficients are shown. All analyses were performed in 10 cancer types, while only the cancer types in which the results were significant (p < 0.05) are shown in the figure.
Tumor stemness indicates the stem cell-like feature shown in certain tumor cells that drives cancer advancement, invasion, immunosuppression, and drug resistance [32]. We found significant negative correlations between TRPV1 expression levels and tumor stemness scores in pan-cancer (p = 1.47 × 10−77; ρ = −0.26) and in eight cancer types (p < 0.01) (Figure 1(d)).
EMT has an important role in malignant transformation and tumor progression [33]. Interestingly, TRPV1 expression levels correlated negatively with the enrichment scores of the EMT signature in nine individual cancer types (p < 0.001) (Figure 1(e)). However, in pan-cancer, they showed a positive correlation (p = 0.006; ρ = 0.04). These results reflect Simpson's paradox [34], an uninformative statistical error.
We also explored the correlations of TRPV1 expression levels with the enrichment of five cancer-related pathways (p53, mTOR, Wnt, MAPK, and ErbB signaling) in cancer. Our analysis showed that the correlations tended to be negative (p < 0.05) (Figure 1(f)).
In summary, our results suggest that TRPV1 downregulation is associated with unfavorable tumor progression phenotypes in cancer.
3.2. TRPV1 Downregulation Is Associated with Inferior Clinical Outcomes in Cancer
Survival analyses showed a positive correlation between TRPV1 expression and survival prognosis (OS, DSS, and PFI) in pan-cancer (log-rank test, p < 0.001) (Figure 2(a)). Also, in five individual cancer types (BLCA, HNSC, LIHC, PAAD, and SKCM), TRPV1 downregulation correlated with worse OS (p < 0.05) (Figure 2(a)). Moreover, TRPV1 expression levels were markedly lower in late-stage (stage III-IV) than in early-stage (stage I-II) tumors in pan-cancer (p = 2.80 × 10⁻²⁸) (Figure 2(b)).
Figure 2.

Correlations of TRPV1 expression with clinical characteristics and cancer subtypes. TRPV1 expression levels correlate positively with survival prognosis (a) and are lower in late-stage than in early-stage tumors in pan-cancer (b). TRPV1 expression levels are significantly higher in papillary than in nonpapillary subtypes of BLCA, and the papillary subtype has a better OS than the nonpapillary subtype (c). In BRCA, TRPV1 expression is significantly lower in basal-like than in luminal A&B and in HER2-enriched than in luminal A&B (d). In LGG, TRPV1 expression levels are significantly higher in IDH-mutated than in IDH-wild-type tumors, and the IDH-mutated subtype has a better OS than the IDH-wild-type subtype (e). OS: overall survival; DSS: disease-specific survival; PFI: progression-free interval. The log-rank test p values, the Chi-squared test p values, and Student's t-test p values are shown.
Furthermore, we compared TRPV1 expression levels among subtypes of several common cancer types, including BLCA, BRCA, and LGG. In BLCA, TRPV1 expression levels were markedly higher in papillary than in nonpapillary tumors (p < 0.05) (Figure 2(c)). Again, it suggests a positive association between TRPV1 expression and clinical outcomes in BLCA since the papillary subtype has a better prognosis than the nonpapillary subtype (Figure 2(c)). In BRCA, we compared TRPV1 expression levels among breast cancer subtypes defined by the PAM50 assay [35]. Notably, TRPV1 expression levels were significantly lower in basal-like than in luminal A&B (p = 7.55 × 10⁻⁹) and in HER2-enriched than in luminal A&B (p = 2.25 × 10⁻⁵) (Figure 2(d)). These results again indicate that TRPV1 is a positive prognostic factor in breast cancer since basal-like and HER2-enriched subtypes have a worse prognosis than luminal A&B subtypes [36]. In LGG, TRPV1 expression was remarkably upregulated in IDH-mutated versus IDH-wild-type tumors (p = 0.0002) (Figure 2(e)). Because the IDH-mutated subtype has a better OS prognosis compared with the IDH-wild-type subtype (Figure 2(e)), it suggests a positive relationship between TRPV1 expression and clinical outcomes in LGG.
Taken together, our analysis suggests a significant positive association between TRPV1 expression and clinical outcomes in cancer.
3.3. TRPV1 Expression Is Positively Correlated with Tumor Purity and Negatively Correlated with Stromal Content and Genomic Instability
Our analysis revealed that TRPV1 expression had a marked positive correlation with tumor purity in pan-cancer and seven cancer types (p < 0.01), while it showed a significant negative correlation with stromal content in pan-cancer and nine cancer types (p < 0.05) (Figure 3(a)).
Figure 3.

Correlations of TRPV1 expression with tumor purity, stromal content, TMB, HRD, and DEPTH. The TRPV1 expression levels correlate positively with tumor purity and correlate negatively with stromal content (a). Significant negative correlations of TRPV1 expression levels with TMB scores (b), HRD scores (c), and DEPTH scores (d) in pan-cancer. Spearman's correlation test p value < 0.05 indicates a significant correlation; the correlation coefficients are shown. All analyses were performed in 10 cancer types, while only the cancer types in which the results were significant (p < 0.05) are shown in the figure.
Genomic instability plays a key role in tumor initiation and progression [37] and often results in increased TMB and tumor aneuploidy [38]. Our analysis showed that TRPV1 expression levels correlated negatively with TMB in pan-cancer (p = 8.92 × 10−51; ρ = −0.23) (Figure 3(b)). Large-scale genomic instability and tumor aneuploidy are consequences of HRD [26]. Our analysis showed that TRPV1 expression levels correlated negatively with HRD scores in pan-cancer (p = 1.84 × 10⁻¹⁴; ρ = −0.12) (Figure 3(c)). ITH is a consequence of genomic instability [39] that has a significant association with unfavorable clinical outcomes in cancer [40]. Our analysis revealed a significant negative correlation between TRPV1 expression levels and ITH scores in pan-cancer (p = 9.61 × 10⁻⁸; ρ = −0.081) (Figure 3(d)). These results collectively suggest a negative association between that TRPV1 expression and genomic instability in cancer.
3.4. TRPV1 Expression Correlated Inversely with Immunosuppressive Signatures in Cancer
Our analysis revealed significant negative correlations between TRPV1 expression levels and the enrichment scores of numerous immunosuppressive signatures in pan-cancer and in most cancer types (p < 0.05) (Figure 4(a)). These immunosuppressive signatures included myeloid-derived suppressor cells (MDSCs), T cell exhaustion, PD-L1, anti-inflammatory cytokines, M2 macrophages, TGF-β, and CD4+ regulatory T cells. However, TRPV1 expression levels had a positive correlation with the ratios of immunostimulatory over immunosuppressive signatures (CD8+ T cell/PD-L1) in pan-cancer and in five cancer types (p < 0.05) (Figure 4(b)). These results suggest that TRPV1 may play a role in promoting the antitumor immune response.
Figure 4.

Correlations of TRPV1 expression with tumor immunosuppressive signature scores and ratios of CD8+ T cell/PD-L1. The significant negative correlation between TRPV1 expression levels and tumor immunosuppressive signatures' scores (a). TRPV1 expression levels correlate positively with the ratios of CD8+ T cell/PD-L1 (b). Pearson's or Spearman's correlation test p value < 0.05 indicates a significant correlation; the correlation coefficients (r or ρ) are shown. All analyses were performed in 10 cancer types, while only the cancer types in which the results were significant (p < 0.05) are shown in the figure.
3.5. Identification of TRPV1-Associated Network and Pathway
Network analysis by BioGRID [41] uncovered the interaction relationship between TRPV1 and eight proteins/genes (Figure 5(a)). The eight interactors of TRPV1 included CBL, EGFR, CALM1, HNRNPH1, AKAP5, SYT9, OS9, and SNAPIN. Among those interactors, CBL as a proto-oncogene plays an important role in cancer, whose mutations can enhance the PI3K/AKT signaling [42]. EGFR is a tumor driver factor whose overexpression may promote tumor cell proliferation [43]. TRPV1 promotes the ubiquitination of EGFR by the ubiquitin ligase Cbl, leading to the degradation of EGFR through the lysosomal pathway [44]. It indicates that TRPV1 expression is positively associated with tumor prognosis through multiple mechanisms.
Figure 5.

TRPV1 interaction network analysis and pathways significantly associated with TRPV1 expression. (a) The TRPV1 interaction network and its eight gene interactors identified by BioGRID [41]. (b) Cancer-related pathways whose enrichment shows significant negative correlations with TRPV1 expression (FDR < 0.05), identified by GSEA [47].
GSEA [26] identified 37 and 29 KEGG pathways significantly associated with the top 500 genes upregulated in the high- and low-TRPV1-expression subgroups, respectively. Notably, there were numerous oncogenic pathways upregulated in the low-TRPV1-expression subgroup, including pathways in cancer, small cell lung cancer, Jak-STAT signaling, p53 signaling, and calcium signaling (Figure 5(b)). It supports the previous results of the negative association between TRPV1 expression and the enrichment of oncogenic pathways.
4. Discussion
For the first time, we comprehensively analyzed the correlations of TRPV1 expression levels with tumor proliferation, stemness, EMT, genomic instability, ITH, immunity, and various clinical features in pan-cancer and diverse cancer types. We found that TRPV1 expression levels correlated negatively with the expression levels of the tumor proliferation index marker MKI67 and RACGAP1, proliferation score, cell cycle score, tumor stemness, EMT, TMB, HRD, ITH, stromal content, tumor immunosuppressive signatures, and oncogenic pathways' enrichment. As a result, TRPV1 downregulation was associated with unfavorable clinical outcomes in cancer.
Our analysis supports a significant negative correlation between TRPV1 expression and tumor progression in pan-cancer and multiple individual cancer types. It is in line with previous studies showing that TRPV1 expression correlates negatively with the expression of cancer proliferation and metastasis-related markers (Ki67 and VEGFR) [18] and that the activation of TRPV1 can significantly inhibit cancer cell growth by inducing apoptosis and necrosis [15]. In fact, a previous study has demonstrated that the use of TRPV1 agonists can promote tumor cell proliferation [45], supporting our findings.
The tumor suppressive effect of TRPV1 may be achieved through multiple pathways. First, TRPV1 can regulate the flow of calcium ions, thereby reducing the proliferation of tumor cells. Previous studies have shown that TRPV1 can inhibit the development of cancer by regulating the Ca2+/CaMKKβ/AMPK pathway [18]. Second, TRPV1 expression can downregulate the EGFR/MAPK signaling [19], thereby inhibiting the EGFR-induced epithelial cell proliferation [21]. Finally, TRPV1 expression may promote antitumor immunity. It supports a previous study showing that the tumor suppression role of TRPV1 is associated with its positive correlation with antitumor immune infiltration in ccRCC [20]. Our analysis also demonstrates the positive association between TRPV1 expression and antitumor immune responses, as evidenced by TRPV1 expression having a negative association with tumor immunosuppressive signaling and a positive association with the ratio of immunostimulatory to immunosuppressive signatures.
Notably, the p53 pathway is recognized as a tumor suppressor pathway, while our prior study has shown that the tumors highly expressing TP53 have worse prognosis than the tumors lowly expressing TP53 [35]. A potential explanation for this could be that tumor progression stimulates the upregulation of the p53 pathway. Therefore, the negative correlation between the expression levels of TRPV1 and the enrichment scores of the p53 pathway could be attributed to the inhibitory effect of TRPV1 on cancer progression that reduces the stimulatory upregulation of the p53 pathway.
Notably, TRPV1 as a pain and heat receptor is often considered a target for pain relief [46]. However, our study suggests that TRPV1 is likely to act as a tumor suppressor (Figure 6). Thus, treating pain with a high dose or long-term usage of TRPV1 inhibitors should be cautious for their potential adverse oncogenic effects.
Figure 6.
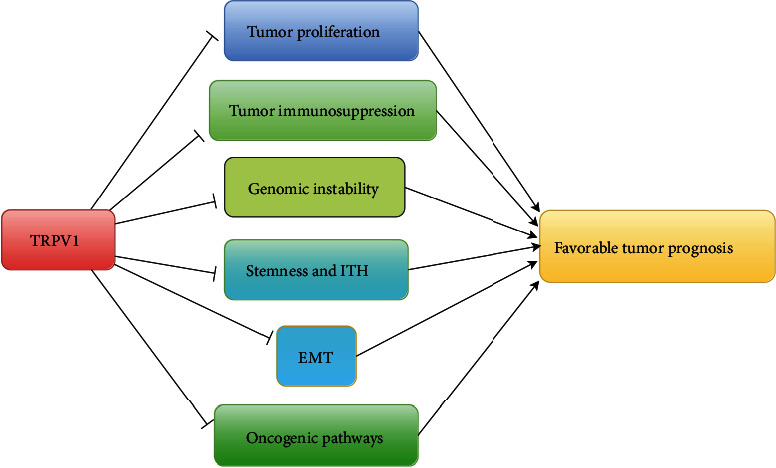
The potential mechanism of TRPV1 functioning as a tumor suppressor.
This research has several limitations. First, our analyses are merely based on bioinformatics analysis but lack of experimental validation. Second, this research used the mRNA expression data to perform all analyses, which may not fully recapitulate the protein expression profiles of TRPV1 in cancer.
Acknowledgments
This work was supported by the China Pharmaceutical University (grant number 3150120001 to XW).
Data Availability
The datasets of RNA-seq, somatic mutations, and clinical information for ten TCGA cancer cohorts can be downloaded from the GDC database (https://portal.gdc.cancer.gov/). The cancer subtype-related data can be downloaded from TCGA with the R function “TCGAquery_subtype” in the R package “TCGAbiolinks”.
Conflicts of Interest
The authors declare that they have no competing interests.
Authors' Contributions
Rongfang Nie was responsible for the software, validation, formal analysis, investigation, data curation, visualization, and writing of original draft, reviewing, and editing. Qian Liu was responsible for the software, formal analysis, investigation, and visualization. Xiaosheng Wang was responsible for the conceptualization, methodology, resources, investigation, writing of original draft, review, and editing, supervision, project administration, and funding acquisition.
Supplementary Materials
Table S1: a description of the datasets for ten TCGA cancer cohorts analyzed in this study. Table S2: the gene sets representing immune signatures, tumor phenotypes, and pathways.
References
- 1.Berridge M. J., Lipp P., Bootman M. D. The versatility and universality of calcium signalling. Nature Reviews. Molecular Cell Biology . 2000;1(1):11–21. doi: 10.1038/35036035. [DOI] [PubMed] [Google Scholar]
- 2.Pardo L. A., Stuhmer W. The roles of K+ channels in cancer. Nature Reviews Cancer . 2014;14(1):39–48. doi: 10.1038/nrc3635. [DOI] [PubMed] [Google Scholar]
- 3.Prevarskaya N., Skryma R., Shuba Y. Ion channels in cancer: are cancer hallmarks oncochannelopathies? Physiological Reviews . 2018;98(2):559–621. doi: 10.1152/physrev.00044.2016. [DOI] [PubMed] [Google Scholar]
- 4.Leanza L., Managò A., Zoratti M., Gulbins E., Szabo I. Pharmacological targeting of ion channels for cancer therapy: In vivo evidences. Biochim Biophys Acta . 2016;1863(6):1385–1397. doi: 10.1016/j.bbamcr.2015.11.032. [DOI] [PubMed] [Google Scholar]
- 5.Li L., Chen C., Chiang C., et al. The impact of TRPV1 on cancer pathogenesis and therapy: a systematic review. International Journal of Biological Sciences . 2021;17(8):2034–2049. doi: 10.7150/ijbs.59918. [DOI] [PMC free article] [PubMed] [Google Scholar]
- 6.Bujak J. K., Kosmala D., Szopa I. M., Majchrzak K., Bednarczyk P. Inflammation, cancer and immunity-implication of TRPV1 channel. Frontiers in Oncology . 2019;9:p. 1087. doi: 10.3389/fonc.2019.01087. [DOI] [PMC free article] [PubMed] [Google Scholar]
- 7.Caterina M. J., Schumacher M. A., Tominaga M., Rosen T. A., Levine J. D., Julius D. The capsaicin receptor: a heat-activated ion channel in the pain pathway. Nature . 1997;389(6653):816–824. doi: 10.1038/39807. [DOI] [PubMed] [Google Scholar]
- 8.Boonen B., Alpizar Y. A., Sanchez A., López-Requena A., Voets T., Talavera K. Differential effects of lipopolysaccharide on mouse sensory TRP channels. Cell Calcium . 2018;73:72–81. doi: 10.1016/j.ceca.2018.04.004. [DOI] [PubMed] [Google Scholar]
- 9.Tominaga M., Caterina M. J., Malmberg A. B., et al. The cloned capsaicin receptor integrates multiple pain-producing stimuli. Neuron . 1998;21(3):531–543. doi: 10.1016/S0896-6273(00)80564-4. [DOI] [PubMed] [Google Scholar]
- 10.Ufret-Vincenty C. A., Klein R. M., Hua L., Angueyra J., Gordon S. E. Localization of the PIP2 sensor of TRPV1 ion channels. The Journal of Biological Chemistry . 2011;286(11):9688–9698. doi: 10.1074/jbc.M110.192526. [DOI] [PMC free article] [PubMed] [Google Scholar]
- 11.Long W., Fatehi M., Soni S., et al. Vitamin D is an endogenous partial agonist of the transient receptor potential vanilloid 1 channel. The Journal of Physiology . 2020;598(19):4321–4338. doi: 10.1113/JP279961. [DOI] [PMC free article] [PubMed] [Google Scholar]
- 12.Min H., Cho W. H., Lee H., et al. Association of TRPV1 and TLR4 through the TIR domain potentiates TRPV1 activity by blocking activation-induced desensitization. Molecular Pain . 2018;14 doi: 10.1177/1744806918812636. [DOI] [PMC free article] [PubMed] [Google Scholar]
- 13.Marincsák R., Tóth B. I., Czifra G., et al. Increased expression of TRPV1 in squamous cell carcinoma of the human tongue. Oral Diseases . 2009;15(5):328–335. doi: 10.1111/j.1601-0825.2009.01526.x. [DOI] [PubMed] [Google Scholar]
- 14.Hartel M., di Mola F. F., Selvaggi F., et al. Vanilloids in pancreatic cancer: potential for chemotherapy and pain management. Gut . 2006;55(4):519–528. doi: 10.1136/gut.2005.073205. [DOI] [PMC free article] [PubMed] [Google Scholar]
- 15.Weber L. V., al-Refae K., Wölk G., et al. Expression and functionality of TRPV1 in breast cancer cells. Breast Cancer (Dove Med Press) . 2016;8:243–252. doi: 10.2147/BCTT.S121610. [DOI] [PMC free article] [PubMed] [Google Scholar]
- 16.Czifra G., Varga A., Nyeste K., et al. Increased expressions of cannabinoid receptor-1 and transient receptor potential vanilloid-1 in human prostate carcinoma. Journal of Cancer Research and Clinical Oncology . 2009;135(4):507–514. doi: 10.1007/s00432-008-0482-3. [DOI] [PMC free article] [PubMed] [Google Scholar]
- 17.Stock K., Kumar J., Synowitz M., et al. Neural precursor cells induce cell death of high-grade astrocytomas through stimulation of TRPV1. Nature Medicine . 2012;18(8):p. 1232. doi: 10.1038/nm.2827. [DOI] [PMC free article] [PubMed] [Google Scholar]
- 18.Gao N., Yang F., Chen S., Wan H., Zhao X., Dong H. The role of TRPV1 ion channels in the suppression of gastric cancer development. Journal of Experimental & Clinical Cancer Research . 2020;39(1):p. 206. doi: 10.1186/s13046-020-01707-7. [DOI] [PMC free article] [PubMed] [Google Scholar]
- 19.Huang J., Liu J., Qiu L. Transient receptor potential vanilloid 1 promotes EGFR ubiquitination and modulates EGFR/MAPK signalling in pancreatic cancer cells. Cell Biochemistry and Function . 2020;38(4):401–408. doi: 10.1002/cbf.3483. [DOI] [PubMed] [Google Scholar]
- 20.Zheng L., Dou X., Song H., Gao R., Tang X. TRPV1 acts as a tumor suppressor and is associated with immune cell infiltration in clear cell renal cell carcinoma: evidence from integrated analysis. Journal of Cancer . 2020;11(19):5678–5688. doi: 10.7150/jca.45918. [DOI] [PMC free article] [PubMed] [Google Scholar]
- 21.de Jong P. R., Takahashi N., Harris A. R., et al. Ion channel TRPV1-dependent activation of PTP1B suppresses EGFR-associated intestinal tumorigenesis. The Journal of Clinical Investigation . 2014;124(9):3793–3806. doi: 10.1172/JCI72340. [DOI] [PMC free article] [PubMed] [Google Scholar]
- 22.Yang Y., Guo W., Ma J., et al. Downregulated TRPV1 expression contributes to melanoma growth via the calcineurin-ATF3-p53 pathway. The Journal of Investigative Dermatology . 2018;138(10):2205–2215. doi: 10.1016/j.jid.2018.03.1510. [DOI] [PubMed] [Google Scholar]
- 23.Colaprico A., Silva T. C., Olsen C., et al. TCGAbiolinks: an R/Bioconductor package for integrative analysis of TCGA data. Nucleic Acids Research . 2016;44(8, article e71) doi: 10.1093/nar/gkv1507. [DOI] [PMC free article] [PubMed] [Google Scholar]
- 24.Hanzelmann S., Castelo R., Guinney J. GSVA: gene set variation analysis for microarray and RNA-seq data. BMC Bioinformatics . 2013;14(1):p. 7. doi: 10.1186/1471-2105-14-7. [DOI] [PMC free article] [PubMed] [Google Scholar]
- 25.Yoshihara K., Shahmoradgoli M., Martínez E., et al. Inferring tumour purity and stromal and immune cell admixture from expression data. Nature Communications . 2013;4(1):p. 2612. doi: 10.1038/ncomms3612. [DOI] [PMC free article] [PubMed] [Google Scholar]
- 26.Knijnenburg T. A., Wang L., Zimmermann M. T., et al. Genomic and molecular landscape of DNA damage repair deficiency across the cancer genome atlas. Cell Reports . 2018;23(1):239–254.e6. doi: 10.1016/j.celrep.2018.03.076. [DOI] [PMC free article] [PubMed] [Google Scholar]
- 27.Li M., Zhang Z., Li L., Wang X. An algorithm to quantify intratumor heterogeneity based on alterations of gene expression profiles. Communications Biology . 2020;3(1):p. 505. doi: 10.1038/s42003-020-01230-7. [DOI] [PMC free article] [PubMed] [Google Scholar]
- 28.Scholzen T., Gerdes J. The Ki-67 protein: from the known and the unknown. Journal of Cellular Physiology . 2000;182(3):311–322. doi: 10.1002/(SICI)1097-4652(200003)182:3<311::AID-JCP1>3.0.CO;2-9. [DOI] [PubMed] [Google Scholar]
- 29.Hanahan D., Weinberg R. A. Hallmarks of cancer: the next generation. Cell . 2011;144(5):646–674. doi: 10.1016/j.cell.2011.02.013. [DOI] [PubMed] [Google Scholar]
- 30.Milde-Langosch K., Karn T., Müller V., et al. Validity of the proliferation markers Ki67, TOP2A, and RacGAP1 in molecular subgroups of breast cancer. Breast Cancer Research and Treatment . 2013;137(1):57–67. doi: 10.1007/s10549-012-2296-x. [DOI] [PubMed] [Google Scholar]
- 31.MacDermed D. M., Khodarev N. N., Pitroda S. P., et al. MUC1-associated proliferation signature predicts outcomes in lung adenocarcinoma patients. BMC Medical Genomics . 2010;3(1):p. 16. doi: 10.1186/1755-8794-3-16. [DOI] [PMC free article] [PubMed] [Google Scholar]
- 32.Miranda A., Hamilton P. T., Zhang A. W., et al. Cancer stemness, intratumoral heterogeneity, and immune response across cancers. Proceedings of the National Academy of Sciences of the United States of America . 2019;116(18):9020–9029. doi: 10.1073/pnas.1818210116. [DOI] [PMC free article] [PubMed] [Google Scholar]
- 33.Larue L., Bellacosa A. Epithelial-mesenchymal transition in development and cancer: role of phosphatidylinositol 3′kinase/AKT pathways. Oncogene . 2005;24(50):7443–7454. doi: 10.1038/sj.onc.1209091. [DOI] [PubMed] [Google Scholar]
- 34.Simpson E. H. The interpretation of interaction in contingency tables. Journal of the Royal Statistical Society. Series B (Methodological) . 1951;13(2):238–241. doi: 10.1111/j.2517-6161.1951.tb00088.x. [DOI] [Google Scholar]
- 35.Parker J. S., Mullins M., Cheang M. C. U., et al. Supervised risk predictor of breast cancer based on intrinsic subtypes. Journal of Clinical Oncology . 2009;27(8):1160–1167. doi: 10.1200/JCO.2008.18.1370. [DOI] [PMC free article] [PubMed] [Google Scholar]
- 36.Howlader N., Cronin K. A., Kurian A. W., Andridge R. Differences in breast cancer survival by molecular subtypes in the United States. Cancer Epidemiology, Biomarkers & Prevention . 2018;27(6):619–626. doi: 10.1158/1055-9965.EPI-17-0627. [DOI] [PubMed] [Google Scholar]
- 37.Ferguson L. R., Chen H., Collins A. R., et al. Genomic instability in human cancer: molecular insights and opportunities for therapeutic attack and prevention through diet and nutrition. Seminars in Cancer Biology . 2015;35:S5–S24. doi: 10.1016/j.semcancer.2015.03.005. [DOI] [PMC free article] [PubMed] [Google Scholar]
- 38.Palmieri G., Colombino M., Cossu A., Marchetti A., Botti G., Ascierto P. A. Genetic instability and increased mutational load: which diagnostic tool best direct patients with cancer to immunotherapy? Journal of Translational Medicine . 2017;15(1):p. 17. doi: 10.1186/s12967-017-1119-6. [DOI] [PMC free article] [PubMed] [Google Scholar]
- 39.Burrell R. A., McGranahan N., Bartek J., Swanton C. The causes and consequences of genetic heterogeneity in cancer evolution. Nature . 2013;501(7467):338–345. doi: 10.1038/nature12625. [DOI] [PubMed] [Google Scholar]
- 40.Li L., Chen C., Wang X. DITHER: an algorithm for defining intratumor heterogeneity based on entropy. Briefings in Bioinformatics . 2021;22(6) doi: 10.1093/bib/bbab202. [DOI] [PubMed] [Google Scholar]
- 41.Stark C., Breitkreutz B. J., Reguly T., Boucher L., Breitkreutz A., Tyers M. BioGRID: a general repository for interaction datasets. Nucleic Acids Research . 2006;34(90001):D535–D539. doi: 10.1093/nar/gkj109. [DOI] [PMC free article] [PubMed] [Google Scholar]
- 42.Belizaire R., Koochaki S. H. J., Udeshi N. D., et al. CBL mutations drive PI3K/AKT signaling via increased interaction with LYN and PIK3R1. Blood . 2021;137(16):2209–2220. doi: 10.1182/blood.2020006528. [DOI] [PMC free article] [PubMed] [Google Scholar]
- 43.Yewale C., Baradia D., Vhora I., Patil S., Misra A. Epidermal growth factor receptor targeting in cancer: a review of trends and strategies. Biomaterials . 2013;34(34):8690–8707. doi: 10.1016/j.biomaterials.2013.07.100. [DOI] [PubMed] [Google Scholar]
- 44.Bode A. M., Cho Y. Y., Zheng D., et al. Transient receptor potential type vanilloid 1 suppresses skin carcinogenesis. Cancer Research . 2009;69(3):905–913. doi: 10.1158/0008-5472.CAN-08-3263. [DOI] [PMC free article] [PubMed] [Google Scholar]
- 45.Zhai K., Liskova A., Kubatka P., Büsselberg D. Calcium entry through TRPV1: a potential target for the regulation of proliferation and apoptosis in cancerous and healthy cells. International Journal of Molecular Sciences . 2020;21(11):p. 4177. doi: 10.3390/ijms21114177. [DOI] [PMC free article] [PubMed] [Google Scholar]
- 46.Szallasi A., Sheta M. Targeting TRPV1 for pain relief: limits, losers and laurels. Expert Opinion on Investigational Drugs . 2012;21(9):1351–1369. doi: 10.1517/13543784.2012.704021. [DOI] [PubMed] [Google Scholar]
- 47.Subramanian A., Tamayo P., Mootha V. K., et al. Gene set enrichment analysis: a knowledge-based approach for interpreting genome-wide expression profiles. Proceedings of the National Academy of Sciences of the United States of America . 2005;102(43):15545–15550. doi: 10.1073/pnas.0506580102. [DOI] [PMC free article] [PubMed] [Google Scholar]
Associated Data
This section collects any data citations, data availability statements, or supplementary materials included in this article.
Supplementary Materials
Table S1: a description of the datasets for ten TCGA cancer cohorts analyzed in this study. Table S2: the gene sets representing immune signatures, tumor phenotypes, and pathways.
Data Availability Statement
The datasets of RNA-seq, somatic mutations, and clinical information for ten TCGA cancer cohorts can be downloaded from the GDC database (https://portal.gdc.cancer.gov/). The cancer subtype-related data can be downloaded from TCGA with the R function “TCGAquery_subtype” in the R package “TCGAbiolinks”.