



Abstract
Gas‐mediated sonodynamic therapy (SDT) has the potential to become an effective strategy to improve the therapeutic outcome and survival rate of cancer patients. Herein, titanium sulfide nanosheets (TiS X NSs) are prepared as cascade bioreactors for sequential gas–sonodynamic cancer therapy. TiS X NSs themselves as hydrogen sulfide (H2S) donors can burst release H2S gas. Following H2S generation, TiS X NSs are gradually degraded to become S‐defective and partly oxidized into TiO X on their surface, which endows TiS X NSs with high sonodynamic properties under ultrasound (US) irradiation. In vitro and in vivo experiments show the excellent therapeutic effects of TiS X NSs. In detail, large amounts of H2S gas and reactive oxygen species (ROS) can simultaneously inhibit mitochondrial respiration and ATP synthesis, leading to cancer cell apoptosis. Of note, H2S gas also plays important roles in modulating and activating the immune system to effectively inhibit pulmonary metastasis. Finally, the metabolizable TiS X NSs are excreted out of the body without inducing any significant long‐term toxicity. Collectively, this work establishes a cascade bioreactor of TiS X NSs with satisfactory H2S release ability and excellent ROS generation properties under US irradiation for programmed gas–sonodynamic cancer therapy.
Keywords: cascade bioreactors, gas therapy, immune modulation, sonodynamic therapy, TiS X nanosheets
Titanium sulfide (TiS X ) nanosheets synthesized via a convenient high‐temperature organic‐phase method are used as a cascade bioreactor for H2S‐mediated programmed gas–sonodynamic cancer therapy.
1. Introduction
Sonodynamic therapy (SDT), as an emerging therapeutic modality that generates reactive oxygen species (ROS) under ultrasound (US) irradiation with sonosensitizers, has been advanced treatment modality owing to its high tissue‐penetration depth, highly focused properties, and minimal damage to normal tissues.[ 1 ] To date, various kinds of novel sonosensitizers, including organic and inorganic sonosensitizers, have been successfully applied for cancer SDT.[ 2 ] Although multiple strategies focusing on these sonosensitizers have been widely investigated to improve the efficacy of SDT, for example, promoting electron (e–) conduction by establishing heterojunction construction,[ 3] reducing the bandgap to accelerate electron–hole (h+) separation,[ 4 ] and constructing defect structure to inhibit e––h+ recombination,[ 5] this field is still in its infancy due to the limited anticancer efficacy of SDT‐based monotherapy. Moreover, the complicated tumor microenvironment (TME), involving the highly reductive glutathione (GSH), hypoxia, and insufficient immune cell infiltration, further impedes the effectiveness of SDT. Thus, other treatment modalities need to be applied in combination with SDT to improve the anticancer efficacy.[ 6]
Gas therapy (GT), which utilizes some sorts of gases to modulate the course of diseases, has emerged as a promising strategy for cancer therapy.[ 7 ] To date, various kinds of gases, including hydrogen (H2), nitric oxide (NO), carbon monoxide (CO), and hydrogen sulfide (H2S), have been reported to specifically act on the glycolysis‐based energy consumption pathway by blocking the “Warburg effect” to fight against cancer.[7a,8 ] Obviously, considering the metabolic differences between the tumor cells and the normal cells, GT is highly desired and is superior to some of the clinically approved chemotherapeutics, endoradiotherapy, and even external radiotherapy, due to its high tumor cell selectivity.[ 7 , 8 ] Among them, H2S, as a type of gasotransmitter, plays multiple roles in cancer therapy. At higher concentrations, H2S not only disrupts the mitochondrial electron transport chain by inhibiting cytochrome c oxidase, but also exerts pro‐oxidant and DNA‐damaging effects.[ 6 , 9 ] Moreover, it has a positive impact on the regulation and activation of the immune system by inhibiting the accumulation of immunosuppressive myeloid‐derived suppressor cells (MDSCs) within the tumors, increasing T cells’ proliferation, and inducing the maturation of dendritic cells (DCs) to inhibit tumor metastasis.[ 11 ] Based on these encouraging preliminary findings, GT has been considered as a “green” strategy to work along with SDT for enhanced long‐term anticancer effects by inhibiting the primary, metastatic, and even recurrent tumors. Recently, some studies combined SDT with GT by the mechanical combination of individual components of gas‐releasing prodrugs and sonosensitizers, which simultaneously produced gas and ROS under US irradiation, thus lacking the programmed release mechanism.[ 12 ] Also, the absence of programmed generation of gas and ROS did not result in cascade‐amplified killing effects on the cancer cells. More importantly, these related studies could not modulate the TME to achieve long‐term tumor growth inhibition by gas–sonodynamic therapy alone, requiring further combination with an immune checkpoint inhibitor for immunotherapy.[ 13 ] Therefore, developing a gas‐releasing sonosensitizer with programmed generation of gas as well as ROS, immunomodulation, good biosafety parameters is urgently needed for improving the efficacy of gas–sonodynamic cancer therapy.
Transition metal dichalcogenides (TMDs), which consist of transition metals and sulfur (S) elements, are famous and well‐developed two‐dimensional (2D) nanomaterials for wide biomedical applications.[ 14 ] Therefore, TMDs have the potential for H2S gas generation owing to the presence of S sources. Moreover, the loss of sulfur through H2S release in turn changes the composition and structure, which may endow defective TMDs with unique properties that can be used for cancer therapy. Herein, titanium sulfide nanosheets (TiS X NSs) were synthesized by a convenient high‐temperature organic‐phase method to serve as a cascade bioreactor for sequential gas‐enhanced SDT for cancer treatment (Scheme 1 ). TiS X NSs themselves burst released H2S gas without any additional H2S donor. Interestingly, along with the release of H2S, the lack of S contributed to the formation of sulfur vacancies on the surface of TiS X NSs and formed TiO X , which significantly improved its sonodynamic performance under US irradiation. In vitro and in vivo studies confirmed the excellent effect of GT–SDT based on the cascade amplification of TiS X NSs. Importantly, the generated H2S activated the host's immune system to inhibit the lung metastasis of breast cancer cells and prolong the overall survival of the mice by suppressing MDSCs, promoting the expression of cytotoxic T lymphocytes, and inducing the maturation of DCs. Of note, the synthesized TiS X NSs possessed excellent biocompatibility and biodegradability, which meant that they were excreted in a timely manner. Collectively, our work highlighted that the TiS X NSs as cascade bioreactors with sequential GT and SDT performance, enhanced the host's antitumor immune response to improve the treatment efficacy, further extending the biological applications of TMDs‐based nanoplatforms.
Scheme 1.
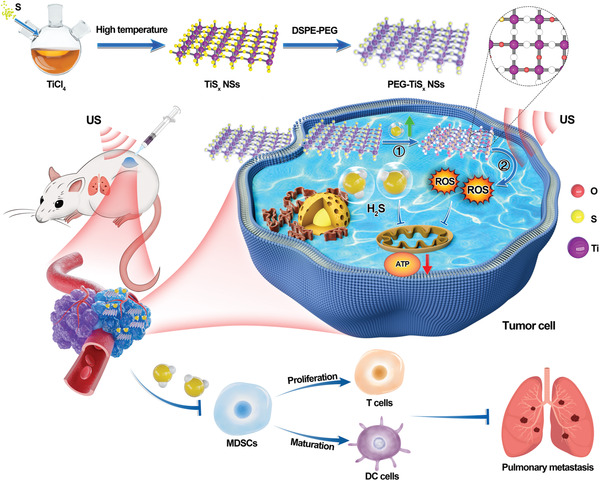
Schematic of TiS X nanosheets synthesized via a convenient high‐temperature organic‐phase method and as a cascade bioreactor for H2S‐mediated programmed gas–sonodynamic cancer therapy.
2. Results and Discussion
The easy‐to‐obtain TiS X NSs were fabricated using the typical organic‐phase strategy with TiCl4 as the precursor. Transmission electron microscopy (TEM) images showed that the TiS X NSs had a uniform sheet morphology (Figure 1a,b), and the diameters of the TiS X NSs were distributed between 100 and 110 nm (Figure 1c). Although the X‐ray powder diffraction (XRD) spectrum did not show any characteristic peaks of crystal structured titanium sulfide (Figure S1, Supporting Information), element mapping and X‐ray energy dispersive spectrometry (EDS) were utilized to reveal the composition of the TiS X NSs (Figure 1d,e). The existing O element in the TiS X NSs was most likely due to the partial oxidation of TiS X . The valence states of Ti and S elements were analyzed by X‐ray electron spectroscopy (XPS). The full‐scan XPS spectrum revealed typical Ti and S peaks (Figure S2, Supporting Information). In detail, for the Ti 2p region, the binding energies at 456.50, 458.07, 463.40, and 464.29 eV corresponded to Ti3+ 2p3/2, Ti4+ 2p3/2, Ti3+ 2p1/2, and Ti4+ 2p1/2, respectively (Figure 1f). In the S 2p region, the binding energies at S 2p3/2 and S 2p1/2 were obviously observed at 160.25 and 161.74 eV, respectively, revealing that the prepared TiS X NSs were rich in sulfur (Figure 1g). Raman spectrum further reflected the TiS X peaks at ≈230 and ≈330 cm–1, and a weak S peak was also observed at ≈320 cm–1 (Figure 1h; Figure S3, Supporting Information), which demonstrated that the TiS X NSs were successfully prepared. The amorphous structure was better for the subsequent H2S gas release.[ 15 ] To enhance the biocompatibility of the TiS X NSs for biological applications, they were modified with an amphiphilic polymer, 1, 2‐distearoyl‐sn‐glycero‐3‐phosphoethanolamine‐N‐[methoxy(polyethylene glycol)] (DSPE–PEG) to form PEG–TiS X NSs through noncovalent interactions. Dynamic light scattering (DLS) revealed that the average hydrodynamic size of the PEG–TiS X NSs was ≈160 nm (Figure S4, Supporting Information), and the TEM images reflected the great dispersibility of the PEG–TiS X NSs (Figure S5, Supporting Information). The UV–vis–NIR spectra showed that the PEG–TiS X NSs possessed high NIR absorbance in a concentration‐dependent manner, enabling them to serve as contrast agents for photoacoustic imaging (Figure 1i). In addition, the PEG–TiS X NSs dispersed well in various simulated body fluids, including H2O, phosphate buffered solution (PBS), 0.9% NaCl, and Roswell Park Memorial Institute (RPMI) (Figure S6, Supporting Information). Combined with the scanning of UV–vis–NIR spectra, the PEG–TiSX NSs were gradually degraded (Figures S7 and S8, Supporting Information), showing a great potential for biomedical applications.
Figure 1.
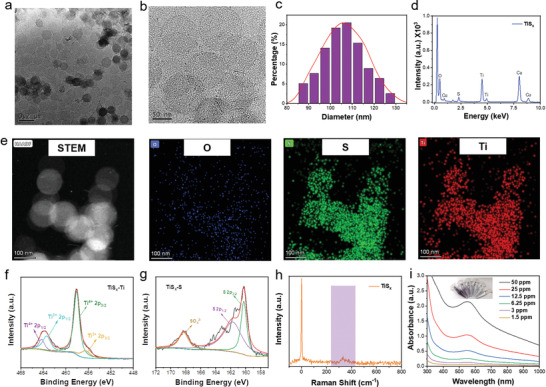
Preparation and characterization of TiS X NSs. a,b) TEM images of TiS X NSs. c) The diameter distribution of the freshly prepared TiS X NSs. d) EDX spectrum of TiS X NSs. e) Element mapping images of TiS X NSs. f,g) XPS spectra of f) Ti 2p and g) S 2p of TiS X NSs. h) Raman spectrum of TiS X NSs. i) UV–vis–NIR spectra of PEG–TiS X NSs.
The TiS X NSs containing abundant sulfur content could be functionalized as a source of S to generate H2S for GT (Figure 2a). To investigate the ability to release H2S gas, the lead acetate test paper was used as an indicator that could capture H2S to form black lead sulfide (PbS). The deeper color of the solution qualitatively reflected the higher concentration of the generated H2S (Figure 2b). In addition, the blue indigo color of oxTMB, which was the oxidized form of 3,3′,5,5′‐tetramethylbenzidine (TMB), was converted to colorless TMB under the reduction of H2S (Figure 2c). Similarly, the UV–vis–NIR spectra showed that the methylene blue (MB) probe further exhibited H2S gas generation ability with a decreasing characteristic absorption peak in a concentration‐dependent manner (Figure 2d). Washington State Probe‐1 (WSP‐1) was further applied to quantitatively detect H2S gas generation. It was found that the low concentration of the PEG–TiS X NSs generated enough H2S gas, leading to excellent efficacy of gas therapy (Figure 2e; Figures S12 and S13, Supporting Information). In addition, a reported H2S probe was further used to detect the H2S gas release, and the fluorescence signal increased gradually with the concentration and time (Figure 2f; Figure S15, Supporting Information), indicating the large amount of H2S release from the TiS X NSs.[ 16 ] Next, the H2S generation ability of the differently degraded PEG–TiS X NSs was measured. The longer the degradation time was, the more the H2S gas was generated by PEG–TiS X (Figure S9, Supporting Information). After the different degradation time, the other TMB and MB probes were used to detect reduced H2S gas release (Figures S10 and S11, Supporting Information), which was further precisely quantified by WSP‐1 detection (Figure S14, Supporting Information). In addition, it possessed the property of pH‐dependent H2S release under weakly acidic conditions (Figure S16, Supporting Information).
Figure 2.
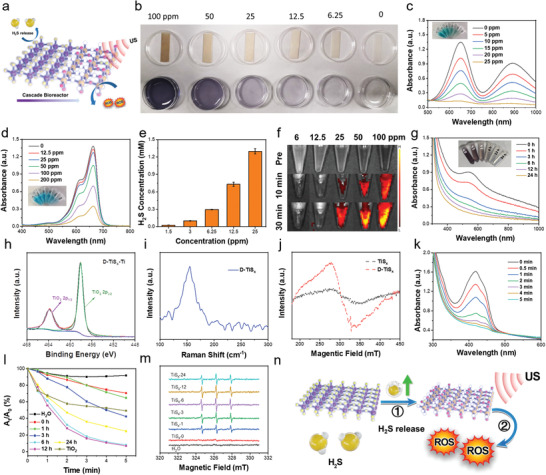
H2S release and sonodynamic performance of PEG–TiS X NSs. a) Schematic illustration of H2S release and sonodynamic properties of PEG–TiS X NSs. b–d) H2S release performance of PEG–TiS X NSs with different concentrations using b) lead acetate test paper, c) TMB, and d) MB as the indicators, respectively. e) H2S release property of PEG–TiS X NSs with different concentrations using WSP‐1 probe. f) The fluorescence imaging of PEG–TiS X NSs with different concentrations using H2S probe at different time points. g) UV–vis–NIR spectra of PEG–TiS X NSs with different degradation times. h) XPS spectrum of Ti 2p of D‐TiS X NSs. i) Raman spectrum of D‐TiS X NSs. j) ESR spectra demonstrating the sulfur vacancies of TiS X and D‐TiS X NSs. k) ROS generation ability of PEG–TiS X NSs after degradation for 12 h. l) Comparison of sonodynamic performance of PEG–TiS X NSs with different degradation times and commercial TiO2. m) ESR spectra exhibiting 1O2 generation by H2O and PEG–TiS X NSs with different degradation times under US irradiation. n) The schematic mechanism of TiS X NSs for sonodynamic property.
Interestingly, the TiS X NSs were gradually degraded upon H2S release. To investigate the changes in the morphology and structure of TiS X NSs, a series of different characterization approaches were used. With a long degradation time, the color of the PEG–TiS X NSs changed from atropurpureus to nearly white and the UV–vis–NIR spectra gradually decreased (Figure 2g). However, the DLS and TEM images showed little change of its size (Figures S17 and S18, Supporting Information), and there was no significant change in the structure as observed by XRD analysis (Figure S19, Supporting Information). The EDS spectrum revealed that the content of S was reduced, while the O content was enhanced (Figure S20, Supporting Information), and the element mapping images of D‐TiS X showed similar results (Figure S21, Supporting Information). XPS spectra revealed that the TiO2 peak appeared (Figure 2h), and owing to H2S gas release, the S signal became weak (Figure S22, Supporting Information). All the above results revealed that the TiS X NSs were partially oxidized to TiO X upon H2S gas release. Furthermore, Raman spectrum showed a TiO2 signal peak at ≈155 cm–1, which further confirmed the formation of TiO X (Figure 2i). Notably, the electron spin resonance (ESR) spectrum showed the signature of sulfur vacancies at g = 2.002. The ESR signal increased to 4.5 times with high degradation (Figure 2j; Figure S23, Supporting Information), which could be ascribed to the free electrons generated by the sulfur vacancies of TiS X .[ 17 ] To further verify its vacancy, the photoluminescence (PL) spectra were measured.[ 18 ] It could be seen that the PL spectra of the PEG–D‐TiS X NSs were much lower than that of the PEG–TiS X NSs, potentially due to the fact that most of the vacancies in the PEG–D‐TiS X NSs captured the photoexcited electrons, and then the decreased excitation energy reduced the photoluminescence intensity (Figure S24, Supporting Information).
It has been reported that the defective structure could capture the e– to enhance ROS generation.[ 4 , 18 ] Therefore, we hoped that the formation of TiO X and S defects might improve the sonodynamic performance of D‐TiS X NSs. Afterward, the sonodynamic efficacies of the TiS X NSs with different degradation degrees were evaluated using the 1,2‐diphenylisobenzofuran (DPBF) probe. From the UV–vis spectra, the attenuation rates of DPBF by different degraded TiS X NSs were calculated (Figure 2l). After 12 h of degradation, the D‐TiS X NSs produced the maximum ROS under US irradiation (Figure 2k). The commercial sonosensitizer TiO2 was also detected as the positive control, and the ROS generation efficacy of D‐TiS X NSs was much higher. However, the ROS generation ability of the D‐TiS X NSs after degradation for 24 h declined, potentially due to the decomposition of the TiS X NSs (Figure S25, Supporting Information). Meanwhile, the TiS X NSs themselves, with various degradation time, hardly generated ROS without US irradiation (Figure S26, Supporting Information). Furthermore, similar degree of ROS generation was found by using the diphenylamine (DPA) probe (Figures S27 and S28, Supporting Information). ESR spectra further distinguished the type of ROS, wherein the typical characteristic peaks of 1:1:1 appeared, reflecting 1O2 generation under US irradiation (Figure 2m; Figure S34, Supporting Information). In addition, TMB and o‐phenylenediamine (OPD) probes were used to detect other types of ROS, and it was found that there was no obvious signal change. The ESR spectra revealed that there were no hydroxyl radical (·OH) peaks, which indicated that the PEG–TiS X NSs generated 1O2 rather than ·OH under US irradiation (Figures S29–S31, Supporting Information). Significantly, the D‐TiS X NSs showed excellent stability under US irradiation (Figures S32 and S33, Supporting Information). TiO X is a known sonosensitizer, and the vacancies capture electrons (e–) to inhibit the recombination of e– and hole (h+) pairs. According to the above results, the potential mechanism was proposed (Figure 2n). With the release of H2S gas, S vacancies were formed and increased; meanwhile, partial S elements were replaced by O to form TiO X on the surface of TiS X NSs. The formation of TiO X endowed the sonodynamic effect, and the S vacancies further captured the e–, and then combined with O2 to produce 1O2 under US irradiation. Therefore, the cascade D‐TiS X NSs served as efficient sonosensitizers for SDT of cancer.
Motivated by the outstanding H2S release and sonodynamic performance of the TiS X NSs, we further evaluated its in vitro anticancer effects (Figure 3a). First, the standard methyl thiazolyl tetrazolium (MTT) assay was performed to evaluate the cytotoxicity of PEG–TiS X NSs. Owing to H2S release, the PEG–TiS X NSs exhibited significant lethality toward 4T1 cells (Figure 3b). Interestingly, the human umbilical vein endothelial cells (HUVECs) displayed higher viability than 4T1 cells after treatment with the PEG–TiS X NSs (Figure S35, Supporting Information). The weakly acidic condition of 4T1 cells constantly caused H2S release, inducing more severe damage. The MTT assay results for PEG–D‐TiS X NSs demonstrated that it was biocompatible (Figure S36, Supporting Information). Next, the standard MTT assay showed that SDT further killed the cancer cells and improved the therapeutic efficacy (Figure 3c). Meanwhile, comparing the overall therapeutic efficacy, the relative cell viabilities of the D‐TiS X +US and TiO2 +US groups were ≈74.15% and ≈90.52%, respectively. However, the viability of the TiS X ‐treated group was reduced to ≈50.18%. Interestingly, the cell viability of the TiS X +US group was further reduced to ≈33.06% (Figure 3d), which suggested that H2S‐mediated GT combined with SDT induced greater cytotoxic effects than the single treatment. Subsequently, the WSP‐1 probe with green fluorescence showed that H2S was generated within the cells, and the content of H2S from TiS X NSs was much higher than that of the standard donor of Na2S (Figure 3e; Figure S37, Supporting Information).
Figure 3.
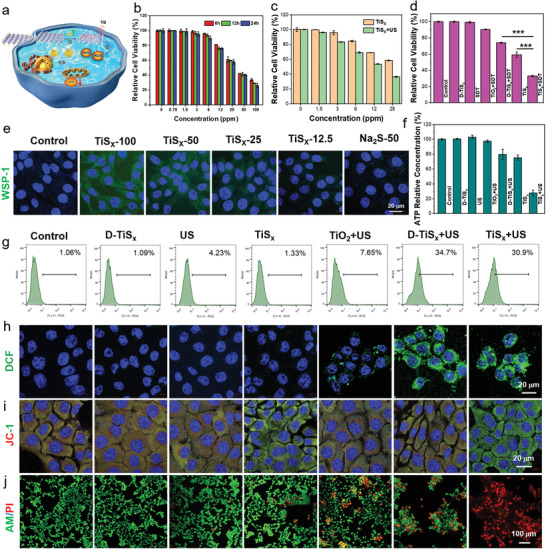
In vitro H2S release and SDT properties of PEG–TiS X NSs. a) Schematic illustration of PEG–TiS X NSs for H2S release‐mediated GT and SDT in vitro. b) Relative cell viability of 4T1 cells after treatments with PEG–TiS X NSs of different degradation time. c) Relative cell viability of 4T1 cells after incubation with different concentrations of PEG–TiS X NSs or combined with US (30 kHz, 5 min) irradiation for 12 h. d) Relative cell viability of 4T1 cells after different treatments. e) Performance of H2S release in vitro with PEG–TiS X NSs of different concentrations by the WSP‐1 probe. f) The relative concentration of intracellular ATP after different treatments. g) Flow cytometry to quantificationally display intracellular ROS generation after different treatments. h–j) Confocal images of 4T1 cells stained with h) DCFH‐DA, i) JC‐1, and j) Calcein acetoxymethyl ester/propidiumiodide (Calcein AM/PI) after various treatments, respectively. Data are presented as mean values ± standard deviation (SD, n = 6).
To further demonstrate the sonodynamic performance of TiS X NSs, the intracellular ROS level was evaluated by the 2,7‐dichlorofluorenscein diacetate (DCFH‐DA) probe. TiO2 only induced ≈7.65% ROS upon US irradiation, while high‐intensity ROS was induced in the D‐TiS X +US groups (≈34.9%) and the TiS X +US groups (≈30.9%), respectively (Figure 3g). Similarly, strong green fluorescence was observed in the D‐TiS X +US and TiS X +US groups, which reflected the abundant generation of ROS by the D‐TiS X NSs upon US irradiation to kill cells (Figure 3h; Figure S38, Supporting Information). Afterward, the mechanism of action and the therapeutic efficacy were investigated. According to previous studies, H2S‐mediated inhibition of mitochondrial respiration and ATP generation have been reported to promote cell necrosis and apoptosis.[ 7c ] Consequently, the JC‐1 kit was used to determine the mitochondrial membrane potential to verify the induction of apoptosis. Stronger green fluorescence was observed in the TiS X and TiS X +US groups, because both H2S and ROS generation could impair mitochondrial respiration (Figure 3i; Figure S39, Supporting Information). In addition, the ATP assay kit showed that excessive H2S and abundant ROS from SDT together inhibited ATP generation and then induced apoptosis (Figure 3f). The live/dead co‐staining assay ultimately confirmed the antitumor effects, with the TiS X +US group inducing the highest cytotoxicity to 4T1 cells (Figure 3j). In conclusion, the cascade bioreaction of TiS X NSs showed outstanding H2S release ability and subsequently enhanced the SDT performance to inhibit mitochondrial respiration and ATP synthesis to further kill the cancer cells.
Encouraged by the excellent H2S release and sonodynamic performance, we further investigated the in vivo antitumor effects of GT and SDT by the PEG–TiS X NSs (Figure 4a). First, the Cy5.5‐labeled PEG–TiS X NSs showed long‐term retention in the tumor upon intratumoral (i.t.) injection (Figure 4b; Figures S40 and S41, Supporting Information). Then, the photoacoustic (PA) signal gradually reduced, and the signal tended to reach that of the control group's level at 12 h (Figure 4c; Figure S42, Supporting Information), indicating that most of the H2S was released. Next, BALB/c mice bearing 4T1 tumors were randomly divided into eight groups: 1) control; 2) D‐TiS X (5 mg kg−1); 3) US; 4) TiS X ‐2 mg kg−1 (TiS X ‐(L)); 5) TiS X ‐5 mg kg−1 (TiS X ‐(H)); 6) TiO2 +US (5 mg kg−1); 7) D‐TiS X +US (5 mg kg−1); and 8) TiS X +US (5 mg kg−1). The PEG–TiS X NSs were administered intratumorally. Based on the in vitro degradation kinetics of the PEG–TiS X NSs and the result of PA signal in vivo, the tumors were exposed to US irradiation after 12 h of the i.t. injection. It was obvious that the tumor growth in the TiS X +US group was completely inhibited, and tumors in the TiS X (H) and D‐TiS X +US groups grew slowly, reflecting the high efficacy of the treatments in delaying tumor growth (Figure 4d). Photographs of tumors after treatments for 6 and 16 days showed similar results, respectively (Figure 4g; Figure S43, Supporting Information). From the survival analysis, the TiS X +US group exhibited the best therapeutic effect, with an inhibitory rate of 100%. However, the TiS X (H) and D‐TiS X +US groups showed only ≈33.9% and ≈46.7% tumor growth inhibition, respectively (Figure 4e). Moreover, all the mice in the TiS X +US group survived without any tumor recurrence, but the tumors in the other control groups gradually reached the death criteria, indicating the excellent therapeutic effects with programmed H2S release and US‐triggered ROS generation (Figure 4f).
Figure 4.
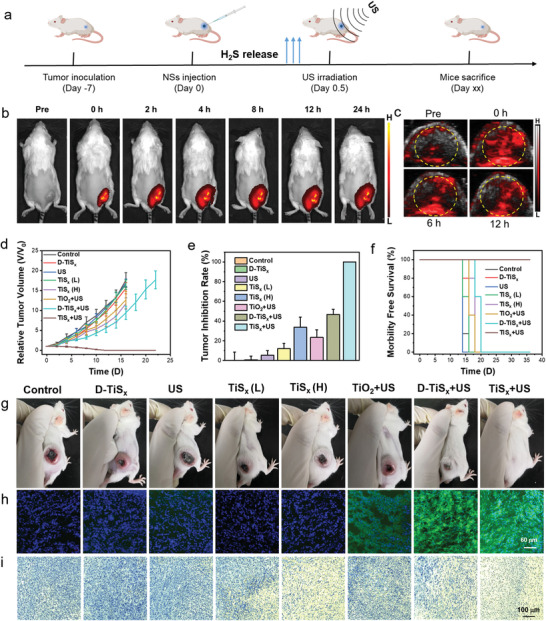
In vivo H2S release mediated GT and SDT properties. a) The therapeutic schedule for 4T1 tumor‐bearing mice. b) The fluorescence imaging of the retention after intratumoral (i.t.) injection with Cy5.5‐labeled PEG–TiS X NSs. c) The PA imaging of the PEG–TiS X NSs at different time points. d) The relative tumor volume in mice with various treatments. e) The tumor inhibition rates of mice with different management strategies. f) The overall survival curves of mice with different treatments. g) Photograph showing the tumor volume of mice after various treatments on the 16th day. h,i) Tumor staining for h) ROS and i) TUNEL after different treatments. Data are presented as mean values ± SD (n = 5 biologically independent mice).
The underlying tumoricidal mechanism of the PEG–TiS X NSs was further explored. First of all, the in vivo H2S release was detected by the fluorescence imaging of the reported ZM106‐NB probe, and it was found that the H2S release was about two times higher in the TiS X group than the control group (Figure S44, Supporting Information), demonstrating the high H2S release ability of the TiS X NSs. Next, we conducted ROS staining of tumors after the different treatments with a DCFH‐DA probe. Stronger green fluorescence appeared in the D‐TiS X +US and TiS X +US groups, while weaker signals appeared in the TiO2 +US and the control groups (Figure 4h; Figure S45, Supporting Information). Furthermore, the blood oxygen saturation levels measured by PA imaging reflected that the released H2S and the generated ROS under US irradiation inhibited mitochondrial respiration and ATP generation that further induced the cancer cell death (Figure S46, Supporting Information). Subsequently, the immunohistochemical TdT‐mediated dUTP Nick‐end labeling (TUNEL) analysis also reflected the maximum damage of tumor cells in the TiS X +US group, with nearly all the tumor cells being severely destroyed. However, the tumor cells in the TiS X (H), TiO2 +US, and D‐TiS X +US groups were partly damaged (Figure 4i). Besides, the hematoxylin and eosin (H&E) staining showed similar results (Figure S47, Supporting Information). Overall, the TiS X NSs possessed outstanding in vivo therapeutic effects with H2S release, followed by ROS generation upon US irradiation.
During cancer treatment, the mice in the control group gradually died, while the TiS X ‐treated mice still survived for a long time, this difference was potentially due to the occurrence of highly visible metastases in the control group (Figure 5a). Furthermore, H&E staining was utilized to visualize the metastases within the lungs, and fewer metastatic nodules were observed in the TiS X and TiS X +US treated groups (Figure 5b,c). To determine whether the TiS X NSs had the ability to inhibit lung metastasis, the released H2S‐mediated immunoregulatory effect was further investigated (Figure 5d). We first induced the MDSCs by adding granulocyte‐macrophage colony stimulating factor (GM‐CSF) and interleukin 6 (IL‐6) to the bone marrow precursor cells, and then treated them with PEG–TiS X NSs.[ 20 ] The results showed that the released H2S greatly inhibited the expression of MDSCs (Figure S48, Supporting Information). Next, the tumors and the nearby lymph nodes were collected to analyze different immune cells on day 7 after treatment. The TiS X NSs inhibited MDSCs’ expansion in the tumors, and both monocytic (mo, R1) and granulocytic (gr, R2) cells were inhibited by the released H2S gas (Figure 5e–g). The suppression of MDSCs might have activated the proliferation of cytotoxic T cells. Therefore, we further evaluated the T cells, and the results reflected that the CD4+ T cells’ infiltration increased in the tumor, which indirectly showed that lots of antibody could have been produced to suppress tumor growth (Figure 5h,i). DCs are a type of antigen‐presenting cells (APCs) that play a significant role during the immune response. Therefore, the treatment of TiS X NSs promoted DCs maturation in nearby tumor lymph nodes (Figure 5j,k). In addition, macrophages, known as a kind of phagocyte, were also analyzed for the two main phenotypes: classically activated (M1) and alternatively activated (M2) macrophages. M1 cells are known to release pro‐inflammatory cytokines, such as IL‐6, interleukin 12 (IL‐12), and tumor necrosis factor α (TNF‐α), to induce cancer cell apoptosis.[ 21 ] Interestingly, TiS X NSs’ treatment promoted M2 to M1 polarization (Figure 5l–o), and the related cytokines were all increased in the tumors (Figure S49, Supporting Information). In summary, TiS X NSs, as a cascade bioreactor, activated the immune system and greatly inhibited pulmonary metastasis of 4T1 breast tumors and prolonged the survival time of mice.
Figure 5.
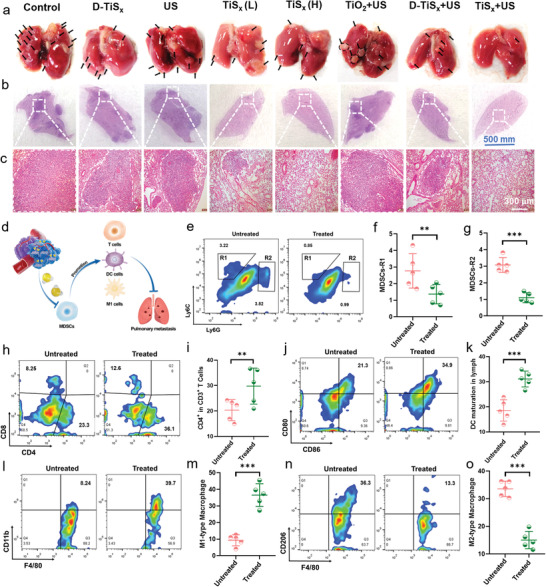
The immunoreaction regulation effect of H2S. a–c) Images of lung metastases in different groups by a) digital photography and b,c) the corresponding H&E staining of lung tissues on the 35th day. d) Schematic illustration of H2S‐regulated immunoreaction. e–i) Flow cytometry plots and related quantification of e–g) MDSCs and h,i) CD4+ T cells in tumors treated with PEG–TiS X NSs. j) Flow cytometry plots and k) related quantification of mature DCs in lymph. l–o) Flow cytometry plots and related quantification of l,m) M1 cells and n,o) M2 cells in tumors treated with PEG–TiS X NSs. Data are presented as mean values ± SD (n = 5 biologically independent mice).
Finally, the biosafety of inorganic nanomaterials must be considered for their wide biomedical applications. First, H&E staining of the vital organs (heart, liver, spleen, lung, kidney, and brain) was performed, and the results showed no obvious morphological changes with different durations of exposure to the TiS X NSs (Figure S50, Supporting Information). The body weight increased in all the groups, indicating that the TiS X NSs had no evident systemic toxicity at the dose of 10 mg kg−1 (Figure S51, Supporting Information). Afterward, the biodistribution and metabolism of TiS X NSs were investigated. The biodistribution profile indicated that the TiS X NSs mainly accumulated in organs that were rich in blood supply, such as the liver and spleen, and the content gradually decreased with time. To verify the metabolic route, the feces and urine of mice were collected to detect the Ti content. It was found that the TiS X NSs were mainly excreted out of the body through the feces, and ≈71.34 µg of Ti was detected within 7 days, accounting for 1/3 of the injected dose (Figure S52, Supporting Information). TEM images revealed a mixture of nanosheets and nanodots of PEG–TiS X NSs with amorphous structure after its degradation under physiological condition at 14 days (Figure S53, Supporting Information), indicating that the TiS X NSs were excreted through hepatic metabolism. Finally, the blood routine and blood biochemical tests showed that the hematological indexes were similar across all the experimental groups (Figure S54, Supporting Information). In short, the TiS X NSs possessed good biosafety for biological applications.
3. Conclusions
In summary, TiS X NSs were successfully established as cascade bioreactors to achieve programmed cancer therapy through H2S release‐mediated GT–SDT under US irradiation. A convenient method of organic‐phase synthesis was applied to fabricate the multifunctional bioreactor, TiS X NSs. Following modification with PEG, the PEG–TiS X NSs exhibited great biocompatibility. The TiS X NSs burst released vast amounts of H2S gas owing to the abundant sulfur element in the samples. With the release of H2S, the TiS X NSs degraded and were gradually oxidized, forming sulfur vacancies on the D‐TiS X NSs, which made the D‐TiS X NSs a highly efficient sonosensitizer with excellent sonodynamic activities. The cascade bioreactor of TiS X NSs with superb H2S release ability and sonodynamic effects significantly inhibited mitochondrial respiration and ATP synthesis, promoting therapeutic efficacy against cancer cells through apoptosis induction both in vitro and in vivo. In addition, H2S gas played a positive role in activating the immune system to effectively inhibit the pulmonary metastasis of breast cancer cells by inhibiting MDSCs, inducing T cells’ proliferation and DCs’ maturation. Importantly, TiS X NSs were excreted out of the body without any obvious long‐term toxicity. In conclusion, the current work established a cascade amplifying TiS X NSs for programmed cancer gas–sonodynamic therapy, extending the biomedical applications of TMDs‐based nanoplatforms for highly efficient cancer therapy by suppressing the primary tumor growth and inhibiting metastatic spread to other organs.
Conflict of Interest
The authors declare no conflict of interest.
Supporting information
Supporting Information
Acknowledgements
This article was partially supported by the National Natural Science Foundation of China (Grant Nos. U20A20254 and 52072253), the China Postdoctoral Science Foundation (Grant Nos. 2021TQ0229 and 2021M702383), Fundamental Research Funds for the Central Universities (Program No. 2662022JC002), Collaborative Innovation Center of Suzhou Nano Science and Technology, Suzhou Key Laboratory of Nanotechnology and Biomedicine, a Jiangsu Natural Science Fund for Distinguished Young Scholars (Grant No. BK20211544), a Jiangsu Natural Science Fund for Young Scholars (Grant No. BK20210730), the 111 Project, and Joint International Research Laboratory of Carbon‐Based Functional Materials and Devices, and Suzhou Key Laboratory of Nanotechnology and Biomedicine. All the animal experiments were carried out under the permission by Laboratory Animal Center of Soochow University.
Li G., Lei H., Yang Y., Zhong X., Gong F., Gong Y., Zhou Y., Zhang Y., Shi H., Xiao Z., Dong Z., Cheng L., Titanium Sulfide Nanosheets Serve as Cascade Bioreactors for H2S‐Mediated Programmed Gas–Sonodynamic Cancer Therapy. Adv. Sci. 2022, 9, 2201069. 10.1002/advs.202201069
Contributor Information
Xiaoyan Zhong, Email: xyzhong@suda.edu.cn.
Zhiqiang Dong, Email: dongz@mail.hzau.edu.cn.
Liang Cheng, Email: lcheng2@suda.edu.cn.
Data Availability Statement
The data that support the findings of this study are available from the corresponding author upon reasonable request.
References
- 1.a) Qian X. Q., Zheng Y. Y., Chen Y., Adv. Mater. 2016, 28, 8097; [DOI] [PubMed] [Google Scholar]; b) Lin X. H., Song J. B., Chen X. Y., Yang H. H., Angew. Chem., Int. Ed. 2020, 59, 14212; [DOI] [PubMed] [Google Scholar]; c) Wang X. W., Zhong X. Y., Gong F., Chao Y., Cheng L., Mater. Horiz. 2020, 7, 2028; [Google Scholar]; d) Zhang Y., Zhang X. Q., Yang H. C., Yu L., Xu Y., Sharma A., Yin P., Li X. Y., Kim J. S., Sun Y., Chem. Soc. Rev. 2021, 50, 11227; [DOI] [PubMed] [Google Scholar]; e) Lin X. H., Liu S. Y., Zhang X., Zhu R., Chen S., Chen X. Y., Song J. B., Yang H. H., Angew. Chem., Int. Ed. 2020, 59, 1682; [DOI] [PubMed] [Google Scholar]; f) Pan X. T., Bai L. X., Wang H., Wu Q. Y., Wang H. Y., Liu S., Xu B. L., Shi X. H., Liu H. Y., Adv. Mater. 2018, 30, 1800180; [DOI] [PubMed] [Google Scholar]; g) Gong F., Cheng L., Yang N. L., Gong Y. H., Ni Y. W., Bai S., Wang X. W., Chen M. C., Chen Q., Liu Z., Nat. Commun. 2020, 11, 3712. [DOI] [PMC free article] [PubMed] [Google Scholar]
- 2.a) Xing X. J., Zhao S. J., Xu T., Huang L., Zhang Y., Lan M. H., Lin C. W., Zheng X. L., Wang P. F., Coord. Chem. Rev. 2021, 445, 214087; [Google Scholar]; b) Li D., Yang Y., Li D. F., Pan J., Chu C. C., Liu G., Small 2021, 17, 2101976; [DOI] [PubMed] [Google Scholar]; c) Xu T., Zhao S. J., Lin C. W., Zheng X. L., Lan M. H., Nano Res. 2020, 13, 2898; [Google Scholar]; d) Sun L. H., Wang P., Zhang J. X., Sun Y., Sun S. H., Xu M. H., Zhang L. L., Wang S. M., Liang X. L., Cui L. G., Biomater. Sci. 2021, 9, 1945; [DOI] [PubMed] [Google Scholar]; e) Yang Y., Wang X., Qian H., Cheng L., Appl. Mater. Today 2021, 25, 101215. [Google Scholar]
- 3.a) Cao Y., Wu T. T., Dai W. H., Dong H. F., Zhang X. J., Chem. Mater. 2019, 31, 9105; [Google Scholar]; b) Deepagan V. G., You D. G., Um W., Ko H., Kwon S., Choi K. Y., Yi G. R., Lee J. Y., Lee D. S., Kim K., Kwon I. C., Park J. H., Nano Lett. 2016, 16, 6257. [DOI] [PubMed] [Google Scholar]
- 4.a) Wang X. W., Zhong X. Y., Bai L. X., Xu J., Gong F., Dong Z. L., Yang Z. J., Zeng Z. J., Liu Z., Cheng L., J. Am. Chem. Soc. 2020, 142, 6527; [DOI] [PubMed] [Google Scholar]; b) Bai S., Yang N. L., Wang X. W., Gong F., Dong Z. L., Gong Y. H., Liu Z., Cheng L., ACS Nano 2020, 14, 15119; [DOI] [PubMed] [Google Scholar]; c) Lei H. L., Wang X. W., Bai S., Gong F., Yang N. L., Gong Y. H., Hou L. Q., Cao M., Liu Z., Cheng L., ACS Appl. Mater. Interfaces 2020, 12, 52370. [DOI] [PubMed] [Google Scholar]
- 5.a) Li G., Zhong X., Wang X., Gong F., Lei H., Zhou Y., Li C., Xiao Z., Ren G., Zhang L., Dong Z., Liu Z., Cheng L., Bioact. Mater. 2022, 8, 409; [DOI] [PMC free article] [PubMed] [Google Scholar]; b) Liu Y., Wang Y., Zhen W. Y., Wang Y. H., Zhang S. T., Zhao Y., Song S. Y., Wu Z. J., Zhang H. J., Biomaterials 2020, 251, 120075; [DOI] [PubMed] [Google Scholar]; c) Jiao X. D., Sun L. H., Zhang W., Ren J. J., Zhang L., Cao Y., Xu Z. G., Kang Y. J., Xue P., Biomaterials 2021, 272, 120787. [DOI] [PubMed] [Google Scholar]
- 6.a) Zhong X. Y., Wang X. W., Li J. X., Hu J., Cheng L., Yang X. L., Coord. Chem. Rev. 2021, 437, 213828; [Google Scholar]; b) Gong F., Cheng L., Yang N. L., Betzer O., Feng L. Z., Zhou Q., Li Y. G., Chen R. H., Popovtzer R., Liu Z., Adv. Mater. 2019, 31, 1900730; [DOI] [PubMed] [Google Scholar]; c) Zhong X. Y., Wang X. W., Cheng L., Tang Y. A., Zhan G. T., Gong F., Zhang R., Hu J., Liu Z., Yang X. L., Adv. Funct. Mater. 2020, 30, 1907954. [Google Scholar]
- 7.a) Szabo C., Nat. Rev. Drug Discovery 2016, 15, 185; [DOI] [PMC free article] [PubMed] [Google Scholar]; b) Chen L. C., Zhou S. F., Su L. C., Song J. B., ACS Nano 2019, 13, 10887; [DOI] [PubMed] [Google Scholar]; c) Wang Y. S., Yang T., He Q. J., Natl. Sci. Rev. 2020, 7, 1485. [DOI] [PMC free article] [PubMed] [Google Scholar]
- 8.a) Fan W. P., Yung B. C., Chen X. Y., Angew. Chem., Int. Ed. 2018, 57, 8383; [DOI] [PubMed] [Google Scholar]; b) Kashfi K., Olson K. R., Biochem. Pharmacol. 2013, 85, 689; [DOI] [PMC free article] [PubMed] [Google Scholar]; c) Szabo C., Papapetropoulos A., Pharmacol. Rev. 2017, 69, 497; [DOI] [PMC free article] [PubMed] [Google Scholar]; d) Tian L. L., Wang Y. X., Sun L. L., Xu J., Chao Y., Yang K., Wang S., Liu Z., Matter 2019, 1, 1061; [Google Scholar]; e) Yang N., Gong F., Liu B., Hao Y., Chao Y., Lei H., Yang X., Gong Y., Wang X., Liu Z., Cheng L., Nat. Commun. 2022, 13, 2336. [DOI] [PMC free article] [PubMed] [Google Scholar]
- 9. He Q. J., Biomater. Sci. 2017, 5, 2226. [DOI] [PubMed] [Google Scholar]
- 10. Attene‐Ramos M. S., Wagner E. D., Gaskins H. R., Plewa M. J., Mol. Cancer Res. 2007, 5, 455. [DOI] [PubMed] [Google Scholar]
- 11. De Cicco P., Ercolano G., Rubino V., Terrazzano G., Ruggiero G., Cirino G., Ianaro A., Br. J. Pharmacol. 2020, 177, 884. [DOI] [PMC free article] [PubMed] [Google Scholar]
- 12.a) Zheng Y., Liu Y. P., Wei F. Y., Xiao H. Y., Mou J., Wu H. X., Yang S. P., Acta Biomater. 2021, 121, 592; [DOI] [PubMed] [Google Scholar]; b) Wang M. F., Hou Z. Y., Liu S. N., Liang S., Ding B. B., Zhao Y. J., Chang M. Y., Han G., Kheraif A. A. A., Lin J., Small 2021, 17, 2005728; [DOI] [PubMed] [Google Scholar]; c) Feng Q. H., Zhang W. X., Yang X. M., Li Y. Z., Hao Y. W., Zhang H. L., Hou L., Zhang Z. Z., Adv. Healthcare Mater. 2018, 7, 1700957. [DOI] [PubMed] [Google Scholar]
- 13.a) Yue W. W., Chen L., Yu L. D., Zhou B. G., Yin H. H., Ren W. W., Liu C., Guo L. H., Zhang Y. F., Sun L. P., Zhang K., Xu H. X., Chen Y., Nat. Commun. 2019, 10, 2025; [DOI] [PMC free article] [PubMed] [Google Scholar]; b) Zhu W. J., Chen Q., Jin Q. T., Chao Y., Sun L. L., Han X., Xu J., Tian L. L., Zhang J. L., Liu T., Liu Z., Nano Res. 2021, 14, 212; [Google Scholar]; c) Wan G. Y., Chen X. H., Wang H. J., Hou S. L., Wang Q., Cheng Y. Y., Chen Q., Lv Y. G., Chen H. L., Zhang Q. Q., J. Nanobiotechnol. 2021, 19, 347. [DOI] [PMC free article] [PubMed] [Google Scholar]
- 14.a) Cheng L., Wang X. W., Gong F., Liu T., Liu Z., Adv. Mater. 2020, 32, 1902333; [DOI] [PubMed] [Google Scholar]; b) Gao P., Xiao Y. F., Wang Y. L., Li L. J., Li W. L., Tao W., J. Nanobiotechnol. 2021, 19, 96; [DOI] [PMC free article] [PubMed] [Google Scholar]; c) Manzeli S., Ovchinnikov D., Pasquier D., Yazyev O. V., Kis A., Nat. Rev. Mater. 2017, 2, 17033; [Google Scholar]; d) Huang H., Zha J., Li S., Tan C., Chin. Chem. Lett. 2021, 33, 163. [Google Scholar]
- 15. Varin R. A., Mattar D. K., Bidabadi A. S., Polanski M., J. Energy Chem. 2017, 26, 24. [Google Scholar]
- 16. Zhang Y., Fang J., Ye S., Zhao Y., Wang A., Mao Q., Cui C., Feng Y., Li J., Li S., Zhang M., Shi H., Nat. Commun. 2022, 13, 1685. [DOI] [PMC free article] [PubMed] [Google Scholar]
- 17.a) Gong F. L., Ye S., Liu M. M., Zhang J. W., Gong L. H., Zeng G., Meng E. C., Su P. P., Xie K. F., Zhang Y. H., Liu J., Nano Energy 2020, 78, 105284; [Google Scholar]; b) Zhao Y. Y., Cai W. L., Fang Y. T., Ao H. S., Zhu Y. C., Qian Y. T., ChemElectroChem 2019, 6, 2231. [Google Scholar]
- 18.a) Song S., Li Y., Shi Y., Xu Y., Niu Y., J. Electroanal. Chem. 2022, 906, 115986; [Google Scholar]; b) Qin Z., Xu K., Yue H., Wang H., Zhang J., Ouyang C., Xie C., Zeng D., Sens. Actuators, B 2018, 262, 771. [Google Scholar]
- 19. Liang S., Xiao X., Bai L. X., Liu B., Yuan M., Ma P. A., Pang M. L., Cheng Z. Y., Lin J., Adv. Mater. 2021, 33, 2100333. [DOI] [PubMed] [Google Scholar]
- 20.a) Weber R., Riester Z., Hüser L., Sticht C., Siebenmorgen A., Groth C., Hu X., Altevogt P., Utikal J. S., Umansky V., J. Immunother. Cancer 2020, 8, e000949; [DOI] [PMC free article] [PubMed] [Google Scholar]; b) Marigo I., Bosio E., Solito S., Mesa C., Fernandez A., Dolcetti L., Ugel S., Sonda N., Bicciato S., Falisi E., Calabrese F., Basso G., Zanovello P., Cozzi E., Mandruzzato S., Bronte V., Immunity 2010, 32, 790. [DOI] [PubMed] [Google Scholar]
- 21.a) Mills C. D., Crit. Rev. Immunol. 2012, 32, 463; [DOI] [PubMed] [Google Scholar]; b) Jayasingam S. D., Citartan M., Thang T. H., Zin A. A. M., Ang K. C., Ch'ng E. S., Front. Oncol. 2020, 9, 1512. [DOI] [PMC free article] [PubMed] [Google Scholar]
Associated Data
This section collects any data citations, data availability statements, or supplementary materials included in this article.
Supplementary Materials
Supporting Information
Data Availability Statement
The data that support the findings of this study are available from the corresponding author upon reasonable request.